Abstract
The dynamic rearrangement of the actin cytoskeleton plays critical roles in T-cell receptor (TCR) signaling and immunological synapse (IS) formation in T cells. Following actin rearrangement in T cells upon TCR stimulation, we found a unique ring-shaped reorganization of actin called the “actin cloud,” which was specifically induced by outside-in signals through lymphocyte function–associated antigen-1 (LFA-1) engagement. In T-cell–antigen-presenting cell (APC) interactions, the actin cloud is generated in the absence of antigen and localized at the center of the T-cell–APC interface, where it accumulates LFA-1 and tyrosine-phosphorylated proteins. The LFA-1–induced actin cloud formation involves ADAP (adhesion- and degranulation-promoting adaptor protein) phosphorylation, LFA-1/ADAP assembly, and c-Jun N-terminal kinase (JNK) activation, and occurs independent of TCR and its proximal signaling. The formation of the actin cloud lowers the threshold for subsequent T-cell activation. Thus, the actin cloud induced by LFA-1 engagement may serve as a possible platform for LFA-1–mediated costimulatory function for T-cell activation.
Introduction
The engagement of T-cell receptors (TCRs) by antigen (Ag) peptide in conjugation with major histocompatibility complex (MHC) triggers signaling and results in T-cell activation.1 However, triggering naive T cells requires both TCR-mediated signals and additional costimulatory signals delivered through the interaction of costimulatory receptors on the T cells with their ligands on Ag-presenting cells (APCs). The most important costimulatory receptors are CD28 and lymphocyte function–associated antigen-1 (LFA-1) on T cells, the ligands of which are CD80/862 and intercellular adhesion molecule-1 (ICAM-1)3 on APCs, respectively.
During Ag recognition, T cells interact with APCs in a specific configuration where the TCR is accumulated in the center of the interface as c-SMAC (central supramolecular activation cluster),4 whereas LFA-1 is accumulated in the periphery as peripheral (p)–SMAC.4 This structure has been designated the immunologic synapse (IS).5,6 The peripheral localization of the TCR at an early time point is indicative of an immature IS, whereas the central localization of the TCR at a later time is the hallmark of a mature IS.6 The dynamic rearrangement and accumulation of these molecules to form IS require the engagement of the costimulatory receptor LFA-1 and cytoskeletal rearrangement.7
LFA-1,8 a member of the integrin family, is composed of α and β chains and expressed on T cells, binds to the ligand ICAM-1 on APCs, and is important for T-cell activation and proliferation.9 Blockade of the interaction between LFA-1 and ICAM-1 results in the inhibition of T-cell activation10 and induces tolerance.11 LFA-1 is expressed in the inactive and closed form on naive T cells and mediates only weak interactions with ICAMs.8,12 The stimulation of T cells through TCRs and chemokine receptors generates an “inside-out” signal that leads to the activation of LFA-1 with an open configuration, increasing its affinity for ICAMs.3 The inside-out signals have been shown to involve several molecules, including ADAP (adhesion- and degranulation-promoting adaptor protein),13,14 SLP-76, Vav,15 DNAM-1,16 and Rap-1.17 In T cells from mice deficient in ADAP (ADAP-KO), TCR-induced LFA-1 activation and clustering were impaired.13,14 In addition to its role in inside-out signaling, ADAP may also play a role in outside-in signaling from integrins, as very late antigen-4 (VLA-4) stimulation resulted in the phosphorylation of ADAP.18 LFA-1 also induces activation signals that have costimulatory function. LFA-1 engagement induces the activation of mitogen-activated protein kinases (MAPKs), including extracellular signal–regulated kinase 1 (Erk1)/Erk2 through the activation of LFA-1–associated cytohesin-1 and Jun, which is mediated by JAB-1 and c-Jun N-terminal kinase (JNK).19-21
The dynamic rearrangement of the actin cytoskeleton plays an important role in T-cell signaling.22,23 Inhibitors of actin polymerization completely terminate ongoing TCR-stimulated signaling. TCR-mediated changes in the actin cytoskeleton have been proposed to regulate T-cell activation through several mechanisms involving Vav, WASP, Arp2/3, Nck, and Cdc42.24,25 Although LFA-1/ICAM-1 interaction also induces cytoskeletal rearrangement,26 the LFA-1–induced actin rearrangement for T-cell activation is not fully understood.
The stimulation of T cells with immobilized anti-TCR antibody (Ab) results in T-cell spreading and actin rearrangement.27-29 Following the analysis of the dynamic rearrangement of actin in this system, we discovered a unique phenomenon of actin cloud formation by LFA-1 stimulation. This actin cloud is localized at the center of T cells above the contact site, and is induced by LFA-1–mediated outside-in signals through the activation of ADAP and JNK. Our results demonstrate that the formation of the actin cloud augments T-cell activation and imply that the actin cloud lowers the threshold for T-cell activation.
Materials and methods
Antibodies and reagents
TP1/32 (Upstate Biotechnology, Lake Placid, NY), R7.1 (Bender MedSystems, Burlingame, CA), mouse anti–human LFA-1 (Southern Biotech, Birmingham, AL), T1/18 and anti–human LFA-1β (provided by Dr A. Shibuya, Tsukuba University, Tsukuba, Japan), M17/4 and anti–mouse LFA-1 (BD Biosciences, Palo Alto, CA), OKT3, mouse anti–human CD3ϵ, 53.6.7, and rat anti–mouse CD8 were used for T-cell stimulation. Alexa 488– or Alexa 568–phalloidin for F-actin (Molecular Probes, Eugene, OR), Alexa 488–P-20, a goat anti–human CD3ϵ Ab (Santa Cruz Biotechnology, Santa Cruz, CA), MEM48, a mouse anti-CD18 (LFA-1β; R&D Systems, Minneapolis, MN), Alexa 488–anti–human CD4, APC–anti–human CD8, and biotin-PY20, an antiphosphotyrosine mAb (BD Biosciences), were used for imaging; and APC–anti–mouse immunoglobulin Gs (IgGs) or Cy5-conjugated streptavidin was used as secondary Ab for staining. Antiphospho–c-Jun, anti-JNK (Promega, Madison, WI), anti-PY, 4G10 (Upstate Biotechnology), anti–LFA-1, anti-CD18 (β2 integrin/LFA-1β), and anti-ADAP (BD Biosciences) were used for biochemical analysis. Recombinant ICAM-1/Ig chimera and human stromal cell–derived factor-1 (SDF-1) were purchased from R&D Systems (Minneapolis, MN) and Pepro Tech (Rocky Hill, NJ), respectively.
Mice
Cells and cell culture
Cells were maintained in 10% fetal calf serum (FCS)–RPMI 1640. P116, a ZAP-70–deficient Jurkat cell line, and J.14, an SLP-76–deficient Jurkat cell line, were provided by R. Abraham (National Institutes of Health [NIH]) and A. Weiss (University of California San Francisco [UCSF]), respectively. The LFA-1–deficient Jurkat cell line was established in our laboratory. For analysis of human peripheral T cells, peripheral blood lymphocytes (PBLs) were separated using Ficoll, stimulated with anti-CD3 (OKT3)–coated 16-well plates in the presence of recombinant interleukin-2 (IL-2; 20 U/well) for 4 days, and cultured for another 3 days after washing the exogenous IL-2.
Transfection and retrovirus-mediated gene transfer
For retrovirus production, packaging cells were transiently transfected with pMX-CD8/ADAP chimeric construct or pMX-IRES-rat CD2 containing a dominant-negative form of JNK (dn-JNK) with Lipofectamine PLUS (Invitrogen, Carlsbad, CA), and the supernatant was used as the source of retrovirus. Parental and mutant Jurkat cells were infected with retrovirus supernatant. Transgene-positive cells were collected for the expression of CD8 using AutoMACS (Miltenyi Biotec, Auburn, CA).
CD8/ADAP was constructed as a fusion construct of the extracellular and transmembrane regions of mouse CD8 and part of human ADAP (amino acids 615-817) by recombinant polymerase chain reaction (PCR), and subcloned into a retroviral vector (pMX-IRES-EGFP). This construct was shown to be sufficient for SLP-76 activation (data not shown). The kinase-inactive JNK3 (by R-to-K mutation) was constructed as dn-JNK by PCR and site-directed mutagenesis and subcloned into pMX-IRES-rCD2.30
Assay for actin rearrangement
Coverslips were treated with poly-L-lysine solution (Sigma, St Louis, MO) for 10 minutes, coated with secondary Ab (anti–human Ig, mouse Ig, rat Ig, or hamster Ig; 3 μg/mL) for 3 hours at 37°C, and then coated with primary Ab (1 μg/mL) for 3 hours at 37°C. Anti-mouse Ig Ab for human LFA-1, CD45, MHC, and human CD3, anti–hamster Ig Ab for mouse CD3, and anti–rat Ig Ab for CD8 were used as the secondary Abs. Jurkat cells (3 × 10⁵) were added dropwise to the coverslips. In some cases, SDF-1 (100 ng/mL) or Mn2+ (1 mM) was added to activate integrins during stimulation. Cells were fixed with 4% paraformaldehyde in phosphate-buffered saline (PBS) after 10 or 30 minutes, treated with 5% bovine serum albumin (BSA)–PBS, stained with phalloidin, and analyzed using a confocal laser microscope (LSM510; Carl Zeiss, Jena, Germany; or TCS SP2; Leica, Heidelberg, Germany) with Leica Applications Suite 1.5.1 software. An oil-immersion objective lens (63×/1.32) was used. The actin cloud was defined as a doughnut-like actin accumulation having more than 5-fold higher fluorescence intensity than the background and a diameter of approximately 5 to 12 μm. We determined the density and size by measuring the fluorescence by scanning confocal microscopy (an example is shown at the bottom of Figure 1B) Jurkat cells were treated with various inhibitors (Calbiochem, San Diego, CA) at 37°C for 30 minutes prior to and during the assay. The inhibitors used were PP2 for src family kinases (30 μM), cytochalasin B (6 μM), wortmannin for PI3K (3 μM), FK506 for calcineurin (3 nM), PD98059 for Mek1 (500 μM), SP600125 for JNK (500 nM), and SB203580 for p38 (6 μM).
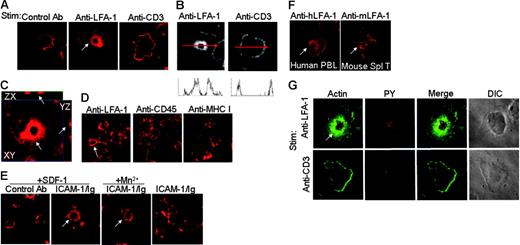
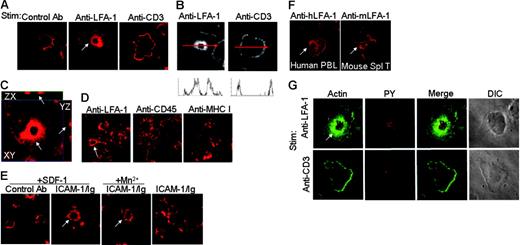
LFA-1 stimulation induces actin cloud formation. (A) Difference in actin rearrangement upon stimulation with TCR and LFA-1. Jurkat cells were plated on a glass-based dish coated with anti-CD3, anti–LFA-1, or control Ab for 30 minutes (“Assay for actin rearrangement”). Cells were fixed and stained with phalloidin–Alexa 568. The spreading area and the actin cloud area were 294 ± 125 μm2 and 64 ± 21 μm2, respectively. The average diameter of the actin cloud was 10 to 11 μm (n = 20). (B) Quantitative analysis of actin cloud formation versus peripheral actin rearrangement upon stimulation with anti–LFA-1 or anti-CD3, respectively. The bottom histograms show the fluorescence intensity of the section that is shown by red arrows in the corresponding top panels. (C) Intracellular localization of actin cloud. Three-dimensional localization of actin cloud was analyzed by confocal microscopy. (D) Actin cloud is specifically induced by LFA-1 stimulation. Jurkat cells were stimulated in plates coated with Ab against LFA-1, CD45, or MHC class I for 30 minutes. (E) Actin cloud formation upon stimulation with ICAM-1. Jurkat cells were plated on coverslips coated with human ICAM-1/Ig or control Ig in the presence of SDF-1 (100 ng/mL) or Mn2+ (1 mM) for 30 minutes. (F) Actin cloud formation in normal T cells. Human PBLs that were stimulated with anti-CD3 in the presence of IL-2 for 4 days and rested for 3 days, or mouse naive splenic T cells were stimulated with immobilized anti–LFA-1 for 30 minutes. Each of the CD4+ and CD8+ human T cells were further analyzed by staining with CD4–Alexa 488 or CD8-APC together with phalloidin–Alexa 568. Approximately 10% of the cells formed actin clouds. Among them, approximately 25% were by CD4+ T cells and 75% were by CD8+ T cells (by counting 50 cells). (G) Accumulation of tyrosine-phosphorylated proteins within the actin cloud. Jurkat cells were stimulated with anti–LFA-1 or anti-CD3 for 10 minutes, fixed, and stained with phalloidin–Alexa 488 and anti-pY–biotin Ab, followed by streptavidin-Cy3. More than 100 cells were analyzed, and one T cell is shown as a representative. White arrows indicate actin cloud.
LFA-1 stimulation induces actin cloud formation. (A) Difference in actin rearrangement upon stimulation with TCR and LFA-1. Jurkat cells were plated on a glass-based dish coated with anti-CD3, anti–LFA-1, or control Ab for 30 minutes (“Assay for actin rearrangement”). Cells were fixed and stained with phalloidin–Alexa 568. The spreading area and the actin cloud area were 294 ± 125 μm2 and 64 ± 21 μm2, respectively. The average diameter of the actin cloud was 10 to 11 μm (n = 20). (B) Quantitative analysis of actin cloud formation versus peripheral actin rearrangement upon stimulation with anti–LFA-1 or anti-CD3, respectively. The bottom histograms show the fluorescence intensity of the section that is shown by red arrows in the corresponding top panels. (C) Intracellular localization of actin cloud. Three-dimensional localization of actin cloud was analyzed by confocal microscopy. (D) Actin cloud is specifically induced by LFA-1 stimulation. Jurkat cells were stimulated in plates coated with Ab against LFA-1, CD45, or MHC class I for 30 minutes. (E) Actin cloud formation upon stimulation with ICAM-1. Jurkat cells were plated on coverslips coated with human ICAM-1/Ig or control Ig in the presence of SDF-1 (100 ng/mL) or Mn2+ (1 mM) for 30 minutes. (F) Actin cloud formation in normal T cells. Human PBLs that were stimulated with anti-CD3 in the presence of IL-2 for 4 days and rested for 3 days, or mouse naive splenic T cells were stimulated with immobilized anti–LFA-1 for 30 minutes. Each of the CD4+ and CD8+ human T cells were further analyzed by staining with CD4–Alexa 488 or CD8-APC together with phalloidin–Alexa 568. Approximately 10% of the cells formed actin clouds. Among them, approximately 25% were by CD4+ T cells and 75% were by CD8+ T cells (by counting 50 cells). (G) Accumulation of tyrosine-phosphorylated proteins within the actin cloud. Jurkat cells were stimulated with anti–LFA-1 or anti-CD3 for 10 minutes, fixed, and stained with phalloidin–Alexa 488 and anti-pY–biotin Ab, followed by streptavidin-Cy3. More than 100 cells were analyzed, and one T cell is shown as a representative. White arrows indicate actin cloud.
IS formation
Raji cells used as APCs were preincubated with SEE (200 ng/mL) at 37°C for 30 minutes. Jurkat and Raji cells were conjugated on poly-l-lysine–coated coverslips at 37°C for 30 minutes. The cells were fixed and stained with Abs. IS formation was analyzed by confocal laser microscopy. Z-axis images were recorded with a Leica TCS SP2 confocal scanning system equipped with a galvo stage. The percentage of cells showing recruitment of molecules within the interface was calculated among the number of cells exhibiting conjugate formation with APCs. The conjugate formation between Jurkat cells and SEE-pulsed Raji cells was approximately 40% to 60%.
Immunoprecipitation and Western blot analysis
Jurkat cells were stimulated with plate-coated anti–LFA-1 Ab or anti-CD3 Abs for indicated periods. Cells were lysed with 1% NP-40 lysis buffer (1% NP-40, 50 mM Tris, 150 mM NaCl, 5 mM EDTA, 10 μg/mL aprotinin, 12.5 μg/mL chemostatin, 50 μg/mL leupeptin, 25 μg/mL pepstatin A, 1 μM phenylmethylsulfonyl fluoride, and 2 mM Na3VO4). Lysates were immunoprecipitated by protein A–Sepharose conjugated with anti-CD18 (β2 integrin, LFA-1β) or anti-ADAP Abs. Western blots were carried out with the enhanced chemiluminescence assay.
T-cell stimulation for IL-2 production and CD69 expression
Jurkat cells expressing CD8/ADAP were stimulated with various amounts of plate-coated anti-CD3 and anti-CD8. The surface expression of CD69 was analyzed 24 hours later by flow cytometry with PE–anti–human CD69 mAb (clone FN50, catalog no. 555531; BD Pharmingen, San Diego, CA) using FACSCalibur, and IL-2 production was assessed by enzyme-linked immunosorbent assay (ELISA).
Results
Actin cloud formation induced by LFA-1–mediated outside-in signaling
To analyze actin rearrangement during T-cell activation, Jurkat T cells were added dropwise to a glass dish coated with anti-CD3 or anti–LFA-1 for 30 minutes. The cells were fixed and stained with phalloidin for actin polymerization. As previously reported,27-29 actin accumulated rapidly at the periphery of the cells as the cells spread upon stimulation with the immobilized anti-CD3. In contrast, anti–LFA-1 stimulation triggered a unique actin rearrangement that involved the formation of a small ring-shaped actin accumulation within the cell above the contact site (Figure 1A). Quantification of accumulated actin revealed differential assembly of actin between anti–LFA-1–induced actin cloud formation and anti-CD3–stimulated peripheral actin rearrangement (Figure 1B).
This ring-shaped actin rearrangement is due to the accumulation of small actin clusters and is similar to the previously described “actin cloud” that was induced in melanoma cells.31 The formation was observed not only by phalloidin staining but also in the cells transfected with actin-GFP. The actin cloud appeared as early as 2 to 3 minutes after the cells attached to the anti–LFA-1–coated plate and remained visible for 10 to 15 minutes. The actin cloud was localized independently of the nuclei and was located in the vicinity of stimuli, such as anti–LFA-1 or ICAM-1/Ig (Figure 1C). In most cells, a single actin cloud was observed, and the size of the actin cloud varied (approximately 5 to 15 μm).
Actin cloud formation was observed upon stimulation with anti–LFA-1 but not with nonstimulatory anti–LFA-1β Ab (Figure S1, available at the Blood website; see the Supplemental Figures link at the top of the online article). Furthermore, it was not induced by crosslinking with other surface molecules that are abundant on T cells, such as CD45 or MHC class I (Figure 1D). The actin cloud was observed upon stimulation through LFA-1 not only with anti–LFA-1 Ab, but also with the physiologic ligand ICAM-1 in the presence of a chemokine, SDF-1, which is known to activate LFA-1 and induce high-affinity binding for ICAM-1,17,32 whereas the stimulation by SDF-1 alone or ICAM-1 alone elicited no such response (Figure 1E). In addition, we found that other activation protocols of LFA-1 such as ICAM-1 in the presence of Mn2+, which is known to induce conformational change of integrin,33 also induced actin cloud formation (Figure 1E). The critical role of LFA-1 was also confirmed by the observation that the addition of anti–LFA-1 resulted in the blockade of cell adhesion, spreading, and actin cloud formation (data not shown). Furthermore, stimulation of normal T cells, including human PBLs and mouse splenic T cells, with anti–LFA-1–induced actin cloud formation (Figure 1F). Activated T cells that are capable of forming actin clouds contain 3 times more CD8+ T cells than CD4+ T cells.
Collectively, these data suggest that actin cloud formation, a novel form of actin rearrangement, is induced by LFA-1–mediated outside-in signals.
Accumulation of LFA-1 and phosphoproteins in the actin cloud
To investigate the function of the actin cloud during T-cell activation, Jurkat cells were probed for events related to T-cell activation. Upon LFA-1 engagement, tyrosine-phosphorylated proteins accumulated at the center of the actin cloud (Figure 1G), suggesting that the actin cloud is a structure relevant to signaling.
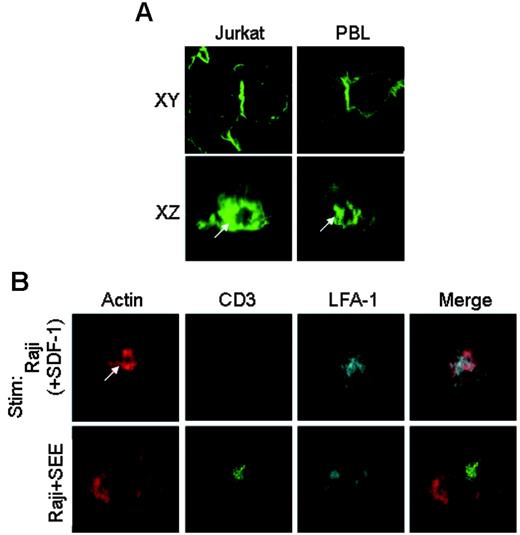
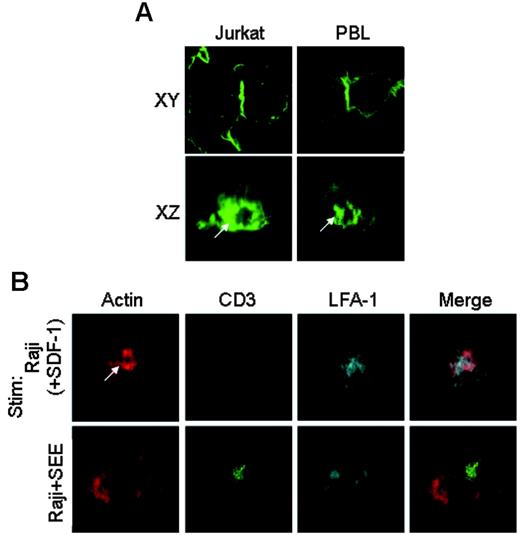
We next examined whether the actin cloud is generated at the T-cell–APC interface upon interacting LFA-1 with ICAM-1 in the absence of Ag. Jurkat cells or IL-2–cultured peripheral T cells (PBLs) were stimulated with SDF-1 and mixed with Raji cells as APCs in the absence of Ag, and the localization of F-actin at the z-axis as well as at the xy-axis of the T-cell–APC conjugates was analyzed by confocal microscopy. Both T cells formed conjugates with Raji cells, and the actin cloud was clearly formed at the interface (Figure 2A) This result was also confirmed by differential staining of T cells and B cells to distinguish between these two cell populations (Figure S2). These data suggest that the actin cloud is formed at the center of the T-cell–APC interface without Ag stimulation.
Actin cloud is formed at the center of the T-cell–APC interface. (A) An actin cloud is formed at the T-cell–APC interface. Jurkat cells (left) or IL-2–cultured human PBLs (right) were stimulated with SDF-1 and conjugated with Raji cells for 30 minutes in the absence of Ag. Stimulated cells were fixed and stained with phalloidin–Alexa 488. Images in both xy-axes (top) and xz-axes (bottom) axes are shown. Those in the z-axis are reconstituted with a TCS SP2 confocal laser microscope equipped with a galvo stage. The images after staining B-cell surface with anti-CD19 to identify the border between T and B cells are shown in Figure S2. (B) The actin cloud accumulated LFA-1 and phosphoproteins but not TCR. SDF-1–stimulated Jurkat cells were conjugated with Raji cells in the absence of Ag (top panels), whereas Jurkat cells were mixed with Raji cells that had been pulsed with SEE (200 ng/mL; bottom panels). After incubation for 30 minutes, the cells were fixed and stained with phalloidin–Alexa 488, anti-CD3, and anti–mouse LFA-1β, followed by avidin-Cy3 or anti–mouse IgG–APC. The white arrow indicates representative actin cloud. All analyses were performed on more than 100 cells.
Actin cloud is formed at the center of the T-cell–APC interface. (A) An actin cloud is formed at the T-cell–APC interface. Jurkat cells (left) or IL-2–cultured human PBLs (right) were stimulated with SDF-1 and conjugated with Raji cells for 30 minutes in the absence of Ag. Stimulated cells were fixed and stained with phalloidin–Alexa 488. Images in both xy-axes (top) and xz-axes (bottom) axes are shown. Those in the z-axis are reconstituted with a TCS SP2 confocal laser microscope equipped with a galvo stage. The images after staining B-cell surface with anti-CD19 to identify the border between T and B cells are shown in Figure S2. (B) The actin cloud accumulated LFA-1 and phosphoproteins but not TCR. SDF-1–stimulated Jurkat cells were conjugated with Raji cells in the absence of Ag (top panels), whereas Jurkat cells were mixed with Raji cells that had been pulsed with SEE (200 ng/mL; bottom panels). After incubation for 30 minutes, the cells were fixed and stained with phalloidin–Alexa 488, anti-CD3, and anti–mouse LFA-1β, followed by avidin-Cy3 or anti–mouse IgG–APC. The white arrow indicates representative actin cloud. All analyses were performed on more than 100 cells.
We then compared the interface of the actin cloud–containing structure with that of an IS induced by Ag. Jurkat cells were conjugated with Raji cells and stimulated with either SDF-1 or superantigen (SEE). Upon stimulation with SEE/Raji, TCR-CD3 was clustered at the center (c-SMAC), and LFA-1 was localized at the periphery as p-SMAC, forming a typical IS. Actin was accumulated around the center but did not form an actin cloud (Figure 2B, bottom panels). In contrast, upon conjugate formation with APCs in the presence of SDF-1 but not Ag, the actin cloud was formed around the center of the contact site. In addition, LFA-1 was also accumulated and overlapped with the actin cloud, although no CD3 clustering was observed (Figure 2B, top panels). These data suggest that SDF-1–stimulated T cells can form the actin cloud structure with the accumulation of LFA-1 and phosphoproteins without TCR segregation at the interface with APCs in the absence of Ag, through the interaction of activated LFA-1 on T cells with ICAM-1 on APCs.
ADAP activation induces actin cloud formation
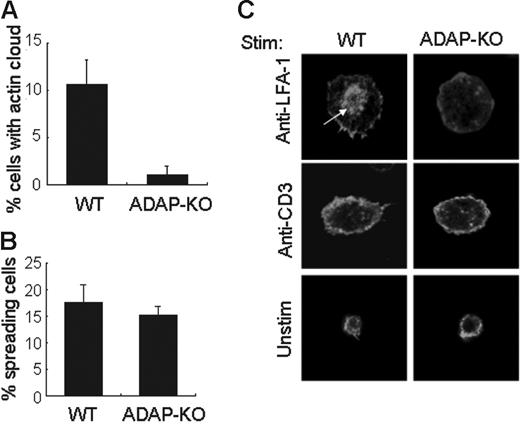
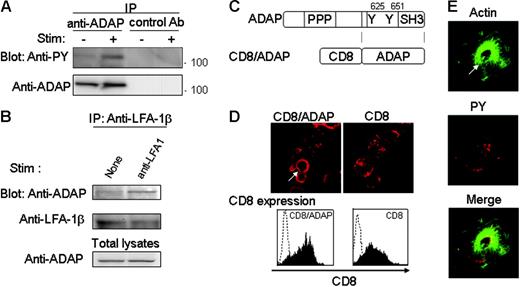
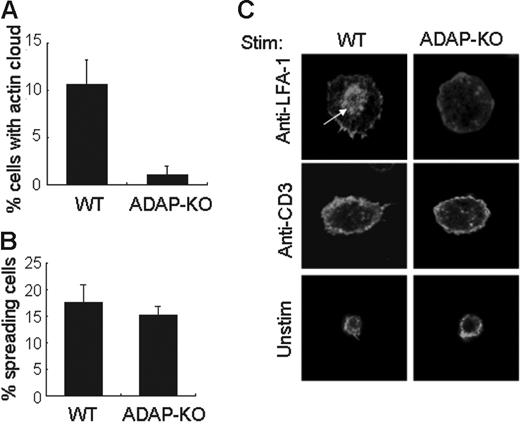
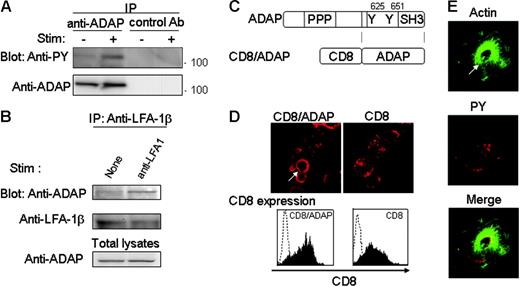
ADAP is a key intermediate of TCR-induced inside-out signaling leading to integrin activation. In the absence of ADAP, LFA-1 clustering is lost, and T-cell activation is severely compromised.13,14 We examined whether ADAP is involved in actin cloud formation using ADAP-deficient T cells. When T cells from ADAP-KO mice were stimulated with anti–LFA-1 independently of TCR proximal signaling, no actin cloud formation was observed (Figure 3A,C) in spite of the similar proportion of spreading cells from ADAP-KO mice to those from WT mice (Figure 3B). In contrast, peripheral actin rearrangement upon stimulation with high doses of anti-CD3 was normally seen in ADAP−/− T cells, similar to normal T cells (Figure 3B-C). These results demonstrate that ADAP is critically involved in LFA-1–induced outside-in signals leading to actin cloud formation. Indeed, as shown in Figure 4A, LFA-1 stimulation induced tyrosine phosphorylation of ADAP, similar to the previous result.18 Furthermore, we observed that ADAP is coimmunoprecipitated with LFA-1 from LFA-1–stimulated cells (Figure 4B), suggesting that ADAP is directly involved in the outside-in signals through LFA-1.
Failure of actin cloud formation by T cells from ADAP-KO mice. (A) Quantification of T cells with actin cloud formation upon stimulation with immobilized anti–LFA-1 Ab from wild-type (WT) and ADAP-KO mice. The percentage represents T cells with actin clouds among T cells with LFA-1–induced spreading. (B) Quantification of T cells with cell spreading upon stimulation with immobilized anti-CD3 Ab. Data in A and B represent the mean ± SD of 500 cells each in 3 experiments. (C) Confocal analysis of representative cells in panels A and B. Splenic T cells from wild-type (WT) and ADAP-KO mice were unstimulated (Unstim) or stimulated with immobilized anti–LFA-1 or anti-CD3 Ab. White arrow indicates the actin cloud. For panels A and B, more than 500 cells were analyzed.
Failure of actin cloud formation by T cells from ADAP-KO mice. (A) Quantification of T cells with actin cloud formation upon stimulation with immobilized anti–LFA-1 Ab from wild-type (WT) and ADAP-KO mice. The percentage represents T cells with actin clouds among T cells with LFA-1–induced spreading. (B) Quantification of T cells with cell spreading upon stimulation with immobilized anti-CD3 Ab. Data in A and B represent the mean ± SD of 500 cells each in 3 experiments. (C) Confocal analysis of representative cells in panels A and B. Splenic T cells from wild-type (WT) and ADAP-KO mice were unstimulated (Unstim) or stimulated with immobilized anti–LFA-1 or anti-CD3 Ab. White arrow indicates the actin cloud. For panels A and B, more than 500 cells were analyzed.
ADAP is involved in outside-in signals by LFA-1, and ADAP ligation induces actin cloud formation. (A) Phosphorylation of ADAP upon LFA-1 stimulation. Jurkat cells were stimulated for 10 minutes with anti–LFA-1 followed by anti–mouse Ig (+) or left unstimulated (−), and cell lysates were immunoprecipitated with anti-ADAP Ab and blotted with anti-PY Ab. (B) Association of LFA-1 with ADAP upon LFA-1 stimulation. Jurkat cells were stimulated for 10 minutes with anti–LFA-1 or left unstimulated (None), and the cell lysates were immunoprecipitated with anti–LFA-1β and blotted with anti-ADAP or anti–LFA-1β. The amounts of ADAP in total lysates were equivalent (bottom blot). (C) Schematic structure of CD8/ADAP constructs. (D) Direct ligation of ADAP induces actin cloud formation. CD8/ADAP- or CD8-expressing Jurkat cells were stimulated on coverslips coated with anti-CD8 for 10 minutes, fixed, and stained with phalloidin–Alexa 568. Most of the T cells (> 80%) formed actin clouds (top panels). The surface expression of CD8 was analyzed by flow cytometry using FACSCalibur (bottom panels). (E) ADAP activation induces the accumulation of tyrosine-phosphorylated proteins in the actin cloud. Jurkat cells, as in panel D, were stained with phalloidin–Alexa 488 and anti-PY–biotin, followed by avidin-Cy3. The white arrow indicates the representative actin cloud in panels D and E. More than 100 cells were analyzed for panels D and E.
ADAP is involved in outside-in signals by LFA-1, and ADAP ligation induces actin cloud formation. (A) Phosphorylation of ADAP upon LFA-1 stimulation. Jurkat cells were stimulated for 10 minutes with anti–LFA-1 followed by anti–mouse Ig (+) or left unstimulated (−), and cell lysates were immunoprecipitated with anti-ADAP Ab and blotted with anti-PY Ab. (B) Association of LFA-1 with ADAP upon LFA-1 stimulation. Jurkat cells were stimulated for 10 minutes with anti–LFA-1 or left unstimulated (None), and the cell lysates were immunoprecipitated with anti–LFA-1β and blotted with anti-ADAP or anti–LFA-1β. The amounts of ADAP in total lysates were equivalent (bottom blot). (C) Schematic structure of CD8/ADAP constructs. (D) Direct ligation of ADAP induces actin cloud formation. CD8/ADAP- or CD8-expressing Jurkat cells were stimulated on coverslips coated with anti-CD8 for 10 minutes, fixed, and stained with phalloidin–Alexa 568. Most of the T cells (> 80%) formed actin clouds (top panels). The surface expression of CD8 was analyzed by flow cytometry using FACSCalibur (bottom panels). (E) ADAP activation induces the accumulation of tyrosine-phosphorylated proteins in the actin cloud. Jurkat cells, as in panel D, were stained with phalloidin–Alexa 488 and anti-PY–biotin, followed by avidin-Cy3. The white arrow indicates the representative actin cloud in panels D and E. More than 100 cells were analyzed for panels D and E.
Then, we examined if the direct engagement of ADAP independently of TCR proximal signals can induce actin cloud formation. For this purpose, a chimeric molecule (CD8/ADAP) composed of the extracellular and transmembrane regions of CD8 and the C-terminal half of ADAP, which contains tyrosines responsible for Fyn and SLP-76 binding and the SH3-like domain, was constructed (Figure 4C) and transfected into Jurkat cells that do not express endogenous CD8, and stimulated by crosslinking with anti-CD8. Jurkat cells expressing CD8/ADAP but not CD8 alone exhibited ADAP phosphorylation (data not shown) and actin cloud formation upon anti-CD8 stimulation, although both transfectants showed high expression of CD8 on the cell surface (Figure 4D). Anti-pY staining indicated that the phosphoproteins were clustered around the center of the actin cloud (Figure 4E) similar to the stimulation with anti–LFA-1 (Figure 1G). These results indicate that the direct crosslinking of ADAP induces the formation of an actin cloud similar to LFA-1 engagement, suggesting that ADAP is directly involved in the outside-in signals mediated by LFA-1.
Signaling pathways required for LFA-1–ADAP–induced actin cloud formation
We attempted to analyze which signals are required for actin cloud formation as LFA-1–induced outside-in signals by using several mutant T cells and several pharmacologic inhibitors of signaling cascades. Jurkat mutants lacking ZAP-70 (P116), SLP-76 (J14), or TCR (J.RT1-T3.1) were infected with CD8/ADAP, and actin cloud formation was examined by CD8 crosslinking. CD8/ADAP-induced actin cloud formation required SLP-76 but not ZAP-70 (Figure 5A) or TCR (data not shown). As ADAP binds to SLP-76,34,35 the association of SLP-76 with ADAP may be critical for actin cloud formation. Indeed, this dependence was confirmed by the observation that a mutant CD8/ADAP lacking the SLP-76 binding site (Y651F) but not the SH3 mutants failed to induce actin cloud formation (data not shown).
LFA-1– and ADAP-induced actin cloud formation requires SLP-76 and JNK activation. (A) CD8/ADAP induced actin cloud formation in Jurkat mutants lacking ZAP-70 (ZAP-70null) but not SLP-76 (SLP-76null). CD8/ADAP was transfected into Jurkat (E6.1) and Jurkat mutants lacking ZAP-70 (P116) or SLP-76 (J14). The expression levels of CD8/ADAP in these cells were equivalent (not shown). Each CD8+ transfectant was stimulated on coverslips coated with anti-CD8 for 30 minutes. (B) Actin cloud formation requires JNK activation. CD8/ADAP-expressing Jurkat cells were pretreated for 30 minutes with various inhibitors: cytochalasin B for actin rearrangement (Cyt.B), PP2 for src family kinases, wortmannin (Wort) for PI3K, FK506 (FK) for calcineurin, PD98059 (PD) for Mek1, SP600125 (SP) for JNK, and SB203580 (SB) for p38. Pretreated Jurkat cells were stimulated on coverslips coated with anti-CD8 for 30 minutes. The percentage of cells with actin cloud formation among activated (spread) cells is shown. Approximately 80% of the cells were spread. Activated cells (200) were analyzed per inhibitor, and representative results of 3 independent experiments are shown. (C) LFA-1–induced actin cloud formation requires JNK activation. Jurkat cells were pretreated with 3 MAPK inhibitors (SP600125 [JNK], PD98059 [Mek1], and SB203580 [p38]), and stimulated on coverslips coated with anti–LFA-1 for 30 minutes. (D) Quantification of panel C. Data represent the mean ± SD of 400 cells each in 3 experiments. (E) Specific inhibition of actin cloud formation by overexpression of dn-JNK. dn-JNK in a vector containing IRES–rat CD2 or vector alone was transfected into Jurkat cells and stimulated on coverslips coated with anti–LFA-1. Rat CD2 was stained green and actin was stained red (right panel). High and low expressions of dn-JNK was determined from the relative brightness of rat CD2 (left panel). Cells (200) were analyzed for panels B, D, and E. (F) Activation of JNK upon LFA-1 stimulation. Jurkat cells were stimulated in plates coated with 10 mg/mL anti–LFA-1 or anti-CD3 for 30 minutes. Total cell lysates were blotted with anti–phospho–c-Jun or anti-JNK Ab. White arrows indicate representative actin clouds.
LFA-1– and ADAP-induced actin cloud formation requires SLP-76 and JNK activation. (A) CD8/ADAP induced actin cloud formation in Jurkat mutants lacking ZAP-70 (ZAP-70null) but not SLP-76 (SLP-76null). CD8/ADAP was transfected into Jurkat (E6.1) and Jurkat mutants lacking ZAP-70 (P116) or SLP-76 (J14). The expression levels of CD8/ADAP in these cells were equivalent (not shown). Each CD8+ transfectant was stimulated on coverslips coated with anti-CD8 for 30 minutes. (B) Actin cloud formation requires JNK activation. CD8/ADAP-expressing Jurkat cells were pretreated for 30 minutes with various inhibitors: cytochalasin B for actin rearrangement (Cyt.B), PP2 for src family kinases, wortmannin (Wort) for PI3K, FK506 (FK) for calcineurin, PD98059 (PD) for Mek1, SP600125 (SP) for JNK, and SB203580 (SB) for p38. Pretreated Jurkat cells were stimulated on coverslips coated with anti-CD8 for 30 minutes. The percentage of cells with actin cloud formation among activated (spread) cells is shown. Approximately 80% of the cells were spread. Activated cells (200) were analyzed per inhibitor, and representative results of 3 independent experiments are shown. (C) LFA-1–induced actin cloud formation requires JNK activation. Jurkat cells were pretreated with 3 MAPK inhibitors (SP600125 [JNK], PD98059 [Mek1], and SB203580 [p38]), and stimulated on coverslips coated with anti–LFA-1 for 30 minutes. (D) Quantification of panel C. Data represent the mean ± SD of 400 cells each in 3 experiments. (E) Specific inhibition of actin cloud formation by overexpression of dn-JNK. dn-JNK in a vector containing IRES–rat CD2 or vector alone was transfected into Jurkat cells and stimulated on coverslips coated with anti–LFA-1. Rat CD2 was stained green and actin was stained red (right panel). High and low expressions of dn-JNK was determined from the relative brightness of rat CD2 (left panel). Cells (200) were analyzed for panels B, D, and E. (F) Activation of JNK upon LFA-1 stimulation. Jurkat cells were stimulated in plates coated with 10 mg/mL anti–LFA-1 or anti-CD3 for 30 minutes. Total cell lysates were blotted with anti–phospho–c-Jun or anti-JNK Ab. White arrows indicate representative actin clouds.
To further analyze the signals required for actin cloud formation, several pharmacologic reagents known to block specific signaling pathways were used (Figure 5B). CD8/ADAP-expressing Jurkat cells were pretreated with the inhibitors, stimulated with anti-CD8, and then stained for actin. ADAP-induced actin cloud formation was obviously inhibited by cytochalasin B, an inhibitor of actin polymerization, and PP2, an inhibitor of src family protein tyrosine kinases (PTKs), consistent with the previous finding that LFA-1 proximal signaling involves an src family kinase.36 Notably, we found that a JNK inhibitor (SP600125),37 but not inhibitors of Mek1 (PD98059) or p38 (SB203580), blocked actin cloud formation (Figure 5B). This specific effect of SP600125 was also confirmed in LFA-1–induced actin cloud formation (Figure 5C-D), whereas it did not block anti-CD3–induced peripheral actin rearrangement (data not shown). We also confirmed the requirement of JNK activation for actin cloud formation by inhibiting JNK by introducing a dn form of JNK in a vector containing IRES–rat CD2. Cells expressing high levels of dn-JNK, which were isolated by the bicistronic expression of rat CD2, specifically inhibited actin cloud formation (Figure 5E). JNK activation was observed upon LFA-1 stimulation by analyzing the phosphorylation of c-Jun,38,39 and was similar to that by anti-CD3 stimulation (Figure 5F).
These data suggest that the actin cloud formation induced by LFA-1 requires activation of src kinases, SLP-76, ADAP, and JNK.
Actin cloud formation enhances TCR-induced activation
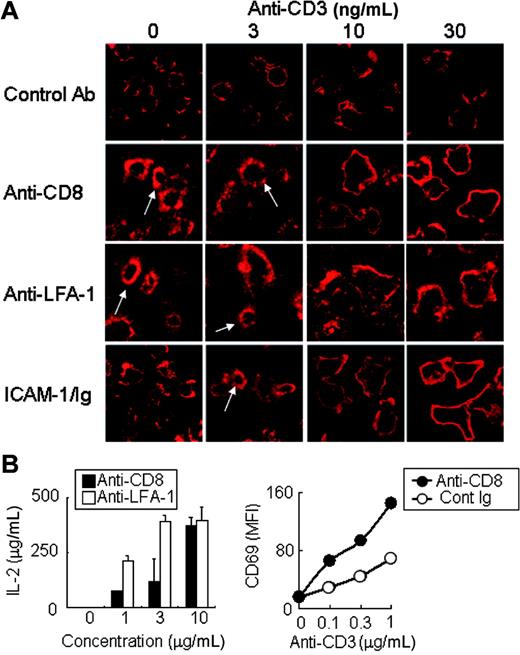
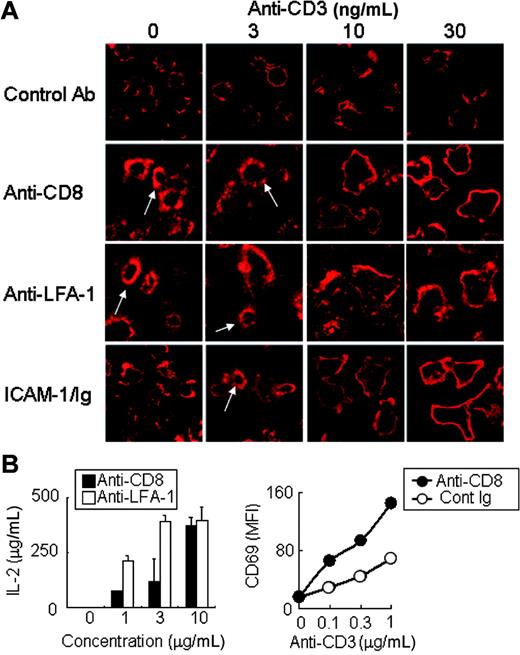
T-cell activation is accompanied by several changes in the cytoskeletal architecture, including the rearrangement of actin and microtubules, and the total inhibition of actin polymerization blocks T-cell activation.26 To clarify the role of LFA-1–mediated actin cloud formation in T-cell activation, we compared TCR-mediated actin rearrangement upon stimulation with low doses of anti-CD3 in the presence or absence of a stimulus inducing the actin cloud formation. CD8/ADAP-expressing Jurkat cells were stimulated with very low doses (3-30 ng/mL) of immobilized anti-CD3 alone or together with anti-CD8. Stimulation of Jurkat cells with such low doses of anti-CD3 alone did not induce any actin rearrangement (Figure 6A, top). By contrast, stimulation with anti-CD8 alone or anti–LFA-1 alone induced actin cloud formation (Figure 6A, first column of images in the second and third rows). Under these conditions to induce actin cloud formation with anti-CD8 or anti–LFA-1, simultaneous stimulation with low doses of anti-CD3 induced marked actin rearrangement and accumulation at the periphery of cells in a dose-dependent fashion (Figure 6A). A similar peripheral actin rearrangement was typically observed upon stimulation with 102- to 103-fold higher doses of anti-CD3 (Figure 1A).28 These results suggest that the actin cloud formation lowers the threshold for further actin rearrangement upon TCR stimulation. Whether such a costimulatory function of the actin cloud formation is observed by stimulation with natural ligand was then analyzed by T-cell stimulation with ICAM-1. Whereas stimulation with ICAM-1 alone did not induce any changes, costimulation with a very low dose of anti-CD3 induced actin cloud formation (Figure 6A, bottom row; 3 ng/mL anti-CD3). Furthermore, stimulation with higher doses (Figure 6A, bottom row; 10 and 30 ng/mL) of anti-CD3 induced peripheral actin rearrangement. Augmentation of T-cell activation in the presence of the actin cloud was also shown functionally in IL-2 production as well as the surface expression of the activation marker, CD69 (Figure 6B). Whereas stimulation with a low dose of anti-CD3 did not induce IL-2 production, additional stimulation with either anti-CD8 (for CD8/ADAP) or anti–LFA-1, both of which induced actin cloud formation, significantly augmented IL-2 production (Figure 6B, left panel). Similarly, the enhanced cell-surface expression of CD69 was observed at very low doses of anti-CD3 (0.1 μg/mL) in the presence of anti-CD8 (Figure 6B, right panel).
Actin cloud formation lowers the threshold of T-cell activation. (A) Actin cloud formation augments actin rearrangement with very low doses of anti-CD3 stimulation. Jurkat cells were stimulated with either anti-CD8 (1 μg/mL), control Ab (1 μg/mL), anti–LFA-1 (1 μg/mL) Ab, or ICAM-1/Ig (0.5 μg/mL) together with graded concentrations of anti-CD3 mAb for 10 minutes, fixed, and stained with phalloidin–Alexa 568. One hundred cells were analyzed. White arrows indicate representative actin clouds. (B) Functional costimulation by actin cloud–inducing stimulation. (Left panel) Jurkat cells expressing CD8/ADAP were stimulated with a fixed amount of anti-CD3 (10 μg/mL) together with graded amounts of anti-CD8 or anti–LFA-1, and IL-2 production was measured by ELISA. (Right panel) The CD8/ADAP-Jurkat cells were stimulated with graded amounts of anti-CD3 together with a fixed amount of anti-CD8 or control rat Ig (10 μg/mL), and the induction of the cell-surface expression of CD69 was stained with PE–anti-CD69 Ab (BD Pharmingen) and analyzed by flow cytometry. MFI indicates mean fluorescent intensity. Data represent the mean ± SD of triplicate cultures.
Actin cloud formation lowers the threshold of T-cell activation. (A) Actin cloud formation augments actin rearrangement with very low doses of anti-CD3 stimulation. Jurkat cells were stimulated with either anti-CD8 (1 μg/mL), control Ab (1 μg/mL), anti–LFA-1 (1 μg/mL) Ab, or ICAM-1/Ig (0.5 μg/mL) together with graded concentrations of anti-CD3 mAb for 10 minutes, fixed, and stained with phalloidin–Alexa 568. One hundred cells were analyzed. White arrows indicate representative actin clouds. (B) Functional costimulation by actin cloud–inducing stimulation. (Left panel) Jurkat cells expressing CD8/ADAP were stimulated with a fixed amount of anti-CD3 (10 μg/mL) together with graded amounts of anti-CD8 or anti–LFA-1, and IL-2 production was measured by ELISA. (Right panel) The CD8/ADAP-Jurkat cells were stimulated with graded amounts of anti-CD3 together with a fixed amount of anti-CD8 or control rat Ig (10 μg/mL), and the induction of the cell-surface expression of CD69 was stained with PE–anti-CD69 Ab (BD Pharmingen) and analyzed by flow cytometry. MFI indicates mean fluorescent intensity. Data represent the mean ± SD of triplicate cultures.
These data suggest that the actin cloud formation confers sensitivity to TCR stimulation.
Discussion
Dynamic changes in cell shape and cytoskeletal organization occur during T-cell activation upon Ag recognition. Actin polymerization is required for IS formation at the T-cell–APC interface as well as for T-cell activation.22,23,26,40 T cells spread and induce the accumulation of actin at the periphery upon stimulation with immobilized anti-TCR Ab.27,28 In the present study, we show a unique actin rearrangement, “actin cloud” formation, upon LFA-1stimulation.
The actin cloud is characterized by a rather small ring-shaped actin accumulation, similar to what was previously described in melanoma cells.31 It differs in size, localization, and dynamics from the circumferential actin reorganization observed in T cells stimulated by immobilized anti-TCR.28 Importantly, the actin cloud was observed at the center of the T-cell–APC interface and colocalized with the LFA-1 cluster, and tyrosine-phosphorylated proteins accumulated at its central area. As the actin cloud is formed upon stimulation with anti–LFA-1, SDF-1 (or Mn2+) plus immobilized ICAM-1, or anti-CD8 for CD8/ADAP chimera in the absence of TCR signaling, we conclude that the actin cloud formation is induced by LFA-1–mediated outside-in signals. The observation that the actin cloud formation augments T-cell activation and enhances the sensitivity for TCR stimulation suggests that the actin cloud mediates costimulatory function. Therefore, our results imply that actin clouds may, at least partly, confer LFA-1–mediated costimulation for T-cell activation.
Regarding the signaling pathways required for the actin cloud formation, TCR and ZAP-70 appear to be dispensable, indicating that the actin cloud is formed independently of TCR-mediated inside-out signals. We demonstrated that LFA-1 triggers ADAP phosphorylation through the LFA-1/ADAP assembly and induces actin cloud formation through an outside-in signal. The observation that ADAP-deficient T cells failed to induce the actin cloud provides evidence that ADAP is involved in the outside-in signal through LFA-1 as suggested,18 in addition to an inside-out signal.13,14 As ADAP has been shown to associate with and be phosphorylated by Fyn, LFA-1 stimulation may induce ADAP phosphorylation by Fyn, which provides the binding site for the SH2 domain of SLP-76 as the mechanism of TCR- and ZAP-70–independent SLP-76 phosphorylation. It has been shown that integrin aggregation is sufficient to induce the activation of several signaling pathways, including FAK, Rho, Ras, MEK, ERK, and JNK.19,20,41 LFA-1 signaling has been shown to induce actin polymerization and remodeling.42 Particularly, LFA-1–mediated JNK activation has been shown to include Rac19 and Cdc4243 as well as JAB-1.20,21 Since we found that the activation of JNK is critical for LFA-1– and ADAP-induced actin cloud formation using JNK inhibitors and dn-JNK, ADAP/SLP-76 may be also involved in this pathway for JNK activation. Although the precise molecular mechanism of JNK activation through LFA-1/ADAP/SLP-76 remains to be determined, the actin cloud formation may be mediated by LFA-1 and ADAP through the possible involvement of these molecules in the pathway for outside-in signals. It was recently reported that the ADAP–SLP-76 binding differentially regulates SMAC formation,44 which may be consistent with the involvement of ADAP in the outside-in signals observed in this study. The regulation of the actin cytoskeleton is tightly linked to T-cell activation and IS formation. Since actin clouds are formed at the T-cell–APC interface, we examined the involvement of actin cloud formation in IS development. Taking advantage of our observation that a JNK inhibitor or dn-JNK specifically blocked the actin cloud formation, IS formation on T cells pretreated with the JNK inhibitor was analyzed. The JNK inhibitor, but not the Mek1 or p38 inhibitor, blocked IS formation, as indicated by the failure of CD3 clustering (Figure S3). These data suggest that the actin cloud formation may be involved in the regulation of IS formation. While the LFA-1–induced actin cloud has been observed within several minutes (Figure S4), the actin cloud induced upon stimulation with Ag/APC appeared to be formed at the central area of the interface transiently within a minute (Figure S5). This may suggest that the actin cloud formation may be involved in the course of early T-cell activation.
The structure and function of the LFA-1–induced actin cloud differed from those of the anti-CD3–induced peripheral actin rearrangement. Together with the structural characteristics of the actin cloud, where LFA-1 and phosphorylated proteins but not TCRs were accumulated, the functional enhancement of sensitivity to T-cell activation in the presence of the actin cloud suggests that the actin cloud formation may represent an intermediate stage of T-cell activation, which may lower the activation threshold. In this regard, Ag-independent IS formation between T cells and dendritic cells (DCs) may have similar properties to the actin cloud.45,46 Recently, it was reported that human CD8 T cells induce immature IS formation in the absence of Ag.47 The similar kinetics of the formation of this immature IS to that of the actin cloud also suggest that the actin cloud formation is involved in IS formation. Consistently, we found that activated T cells that form an actin cloud contain 3 times more CD8+ T cells than CD4+ T cells (Figure 1F). Although individual phosphorylated proteins that accumulate in the actin cloud have not been characterized thus far, this structure may facilitate the recruitment of signaling molecules required for the early stages of activation prior to TCR stimulation.
The finding that the actin cloud may be a possible platform for T-cell activation and further LFA-1–mediated costimulation may have implications in T-cell reactivity and hypersensitivity in autoimmunity. Synovial endothelial cells in patients with rheumatoid arthritis (RA)48 express SDF-1. Such T cells express integrins activated by SDF-1 or other chemokines and may be susceptible to subsequent self-Ag stimulation. Indeed, joint-infiltrated T cells from patients with RA were readily activated by weak stimulation in vitro.49 Thus, it is possible that the actin cloud formation participates in the regulation of the sensitivity of T-cell response by monitoring the microenvironment through chemokine receptors and integrins.
Since T cells with the actin cloud may be “preactivated” cells with low activation thresholds, the molecular mechanism of such preactivation and the transition to IS formation and full activation should be elucidated to understand the dynamic regulation of T-cell activation.
The online version of this article contains a data supplement.
The publication costs of this article were defrayed in part by page charge The publication costs of this article were defrayed in part by page charge marked “advertisement” in accordance with 18 USC section 1734.
Conflict-of-interest disclosure: the authors declare no competing financial interests.
Contribution: J.-i. S. performed experiments; S.Y. performed experiments and discussed research; J.W. performed experiments; G.A.K. contributed vital materials; and T.S. designed the research and wrote the paper.
We thank H. Arase and M. Ohtsuka for experimental help in the early stage of the study, N. Takamatsu for information, S. Taki for discussion, Z. Ma and T. Finkel for experimental help, M. Sakuma and R. Shiina for technical help, and H. Yamaguchi for secretarial assistance.
This work was supported by grants from the Ministry of Education, Culture, Sports, Science and Technology, Japan.

![Figure 5. LFA-1– and ADAP-induced actin cloud formation requires SLP-76 and JNK activation. (A) CD8/ADAP induced actin cloud formation in Jurkat mutants lacking ZAP-70 (ZAP-70null) but not SLP-76 (SLP-76null). CD8/ADAP was transfected into Jurkat (E6.1) and Jurkat mutants lacking ZAP-70 (P116) or SLP-76 (J14). The expression levels of CD8/ADAP in these cells were equivalent (not shown). Each CD8+ transfectant was stimulated on coverslips coated with anti-CD8 for 30 minutes. (B) Actin cloud formation requires JNK activation. CD8/ADAP-expressing Jurkat cells were pretreated for 30 minutes with various inhibitors: cytochalasin B for actin rearrangement (Cyt.B), PP2 for src family kinases, wortmannin (Wort) for PI3K, FK506 (FK) for calcineurin, PD98059 (PD) for Mek1, SP600125 (SP) for JNK, and SB203580 (SB) for p38. Pretreated Jurkat cells were stimulated on coverslips coated with anti-CD8 for 30 minutes. The percentage of cells with actin cloud formation among activated (spread) cells is shown. Approximately 80% of the cells were spread. Activated cells (200) were analyzed per inhibitor, and representative results of 3 independent experiments are shown. (C) LFA-1–induced actin cloud formation requires JNK activation. Jurkat cells were pretreated with 3 MAPK inhibitors (SP600125 [JNK], PD98059 [Mek1], and SB203580 [p38]), and stimulated on coverslips coated with anti–LFA-1 for 30 minutes. (D) Quantification of panel C. Data represent the mean ± SD of 400 cells each in 3 experiments. (E) Specific inhibition of actin cloud formation by overexpression of dn-JNK. dn-JNK in a vector containing IRES–rat CD2 or vector alone was transfected into Jurkat cells and stimulated on coverslips coated with anti–LFA-1. Rat CD2 was stained green and actin was stained red (right panel). High and low expressions of dn-JNK was determined from the relative brightness of rat CD2 (left panel). Cells (200) were analyzed for panels B, D, and E. (F) Activation of JNK upon LFA-1 stimulation. Jurkat cells were stimulated in plates coated with 10 mg/mL anti–LFA-1 or anti-CD3 for 30 minutes. Total cell lysates were blotted with anti–phospho–c-Jun or anti-JNK Ab. White arrows indicate representative actin clouds.](https://ash.silverchair-cdn.com/ash/content_public/journal/blood/109/1/10.1182_blood-2005-12-020164/4/m_zh80010705680005.jpeg?Expires=1765946120&Signature=poXDPwidwE~6ai617zLypI5kG9xUf58xECQPSzR4jnt1eTKOHmztyjZlWAa1mo4YZueeCL2dyiMAhUmVf77s9SG2Xj~qIy-4XCmGq92PX~KTDeF7UQZj~K0lbo39It7PR8Lpgt2-bZUTpylHdWlyXQ3N61VRvmP2TNIafwzdvJizE~tTNLm0149hAWon6LCtk6GPr5TwaeffvsJGMdVLt23VcNdVYjKh~tkyYMvGF~pO8H-ZSF30mDmWSwq5VfiGIoRNQc2OADwQsNKEUp805eryTsHtT3uVTcJ0lVNKtrt7UVGfN1tUImwjshBojR91Q~1izALI6lUBDgy6PJh0BA__&Key-Pair-Id=APKAIE5G5CRDK6RD3PGA)

![Figure 5. LFA-1– and ADAP-induced actin cloud formation requires SLP-76 and JNK activation. (A) CD8/ADAP induced actin cloud formation in Jurkat mutants lacking ZAP-70 (ZAP-70null) but not SLP-76 (SLP-76null). CD8/ADAP was transfected into Jurkat (E6.1) and Jurkat mutants lacking ZAP-70 (P116) or SLP-76 (J14). The expression levels of CD8/ADAP in these cells were equivalent (not shown). Each CD8+ transfectant was stimulated on coverslips coated with anti-CD8 for 30 minutes. (B) Actin cloud formation requires JNK activation. CD8/ADAP-expressing Jurkat cells were pretreated for 30 minutes with various inhibitors: cytochalasin B for actin rearrangement (Cyt.B), PP2 for src family kinases, wortmannin (Wort) for PI3K, FK506 (FK) for calcineurin, PD98059 (PD) for Mek1, SP600125 (SP) for JNK, and SB203580 (SB) for p38. Pretreated Jurkat cells were stimulated on coverslips coated with anti-CD8 for 30 minutes. The percentage of cells with actin cloud formation among activated (spread) cells is shown. Approximately 80% of the cells were spread. Activated cells (200) were analyzed per inhibitor, and representative results of 3 independent experiments are shown. (C) LFA-1–induced actin cloud formation requires JNK activation. Jurkat cells were pretreated with 3 MAPK inhibitors (SP600125 [JNK], PD98059 [Mek1], and SB203580 [p38]), and stimulated on coverslips coated with anti–LFA-1 for 30 minutes. (D) Quantification of panel C. Data represent the mean ± SD of 400 cells each in 3 experiments. (E) Specific inhibition of actin cloud formation by overexpression of dn-JNK. dn-JNK in a vector containing IRES–rat CD2 or vector alone was transfected into Jurkat cells and stimulated on coverslips coated with anti–LFA-1. Rat CD2 was stained green and actin was stained red (right panel). High and low expressions of dn-JNK was determined from the relative brightness of rat CD2 (left panel). Cells (200) were analyzed for panels B, D, and E. (F) Activation of JNK upon LFA-1 stimulation. Jurkat cells were stimulated in plates coated with 10 mg/mL anti–LFA-1 or anti-CD3 for 30 minutes. Total cell lysates were blotted with anti–phospho–c-Jun or anti-JNK Ab. White arrows indicate representative actin clouds.](https://ash.silverchair-cdn.com/ash/content_public/journal/blood/109/1/10.1182_blood-2005-12-020164/4/m_zh80010705680005.jpeg?Expires=1766044419&Signature=w1-MOWTF~vtklEn0Eb9VXSqY-fdvDM5xLw~Lt2eY6FnndU6S-f1lR2nzixSBXd4ND5l97bDU~CxYraSXUqBrl6TK8VPa0SssL~bn5laxCTpOdJDSIBVOZlbgQhpGOepJW79mDaD7L8Nz7DxphpRu-rGEdjJCwgZuNeZh0ce5zHPLOO5~JsIL8rmoKfKpJZ2zsAWdsZVgA0tDt7z46tDjgKjtytoE-Xh2KyvonwZFX8~o4M7Er8U-TE~CfCC02e4U-G5qqrUvrqKEw-M2NfKV1s00BrY8QKYir34ItU-U5jm7VGImUoPuIPN1ScXWergF4UikSOp1CLzkn5MItMdkdg__&Key-Pair-Id=APKAIE5G5CRDK6RD3PGA)
