Abstract
Recent gene-expression data have suggested that host immune genetic signatures may predict outcomes in patients with follicular lymphoma. We evaluated the hypothesis that germ line common variation in candidate immune genes is associated with survival. Cox models were used to estimate hazard ratios (HR) and corresponding 95% confidence intervals for individual SNPs after accounting for age, clinical, and other demographic factors. The median age at diagnosis of the 278 patients was 57 years, and 59 (21%) of the patients died during follow-up, with a median follow-up of 59 months (range, 27-78 months) for surviving patients. SNPs in IL8 (rs4073; HRTT = 2.14, 1.26-3.63), IL2 (rs2069762; HRGT/TT = 1.80, 1.06-3.05), IL12B (rs3212227; HRAC/CC = 1.83, 1.06-3.06), and IL1RN (rs454078; HRAA = 1.93, 1.11-3.34) were the most robust predictors of survival. A summary score of the number of deleterious genotypes from these genes was strongly associated with survival (P = .001). A risk score that combined the 4 SNPs with the clinical and demographic factors was even more strongly associated with survival (P < .001); the 5-year Kaplan-Meier survival estimates were 96% (93%-100%), 72% (62%-83%), and 58% (48%-72%) for groups at low, intermediate, and high risk, respectively. Common variation in host immune genes warrants further evaluation as a promising class of prognostic factors in follicular lymphoma.
Introduction
Follicular lymphoma is one of the most commonly diagnosed subtypes of non-Hodgkin lymphoma (NHL) in North America, Europe, and Australia.1 Although the median survival is approximately 10 years, the course of the disease is highly variable, and it can progress either slowly over many years or very rapidly, particularly after transformation to aggressive lymphoma.2 Established adverse prognostic factors in follicular lymphoma include older age, higher stage, lower hemoglobin level, more nodal areas, and greater than normal serum levels of lactate dehydrogenase, and these factors have been validated as part of the Follicular Lymphoma International Prognostic Index (FLIPI).3
The most common molecular defect in follicular lymphoma is the t(14;18) translocation, which impedes apoptosis by the aberrant overexpression of bcl-2.4 The vast majority of follicular lymphomas have at least one additional karyotypic abnormality (and an average of 6), and a greater number of abnormalities correlates with adverse prognosis.5,6 However, acquired proliferative capacity alone does not sustain tumor growth in vitro, and stromal cells and stimulation of the CD40 receptor in combination with cytokine cocktails (eg, interleukin-10 [IL-10], IL-6, IL-15 or interferon-γ) are required to prolong survival of tumor cells.7 Gene expression studies further support the importance of the immunologic environment in follicular lymphoma,8–10 and a recent study reported that the strongest predictors of follicular lymphoma survival were the gene expression signatures of nonmalignant tumor-infiltrating immune cells, including T cells, macrophages, and dendritic cells.9 Thus, follicular lymphoma seems to be a disease of functional B cells in which intrinsic (specific molecular alterations) and extrinsic (immunologic regulatory network) factors interact to promote neoplastic growth.4
Cytokines are key regulators of immune function and regulation. In the tumor microenvironment, they influence survival, proliferation, differentiation, and movement of both tumor and stromal cells, regulate communication between tumor and stroma, and regulate tumor interactions with the extracellular matrix.11 Cytokine deregulation has been implicated in hematologic as well as other malignancies.11–13 It is also clear that cytokine secretion can be influenced by host genetic variation that alters the level of gene expression, either constitutively or in response to specific challenges. In fact, genetic association studies together with in vitro laboratory studies have demonstrated the importance of germ line variation to cytokine levels and to disease states, particularly in autoimmune disease, cancer, and infectious diseases.14–16 Common genetic variants in cytokine and other immune genes have been associated with the risk of developing NHL in case-control studies.17–22 In addition, some of these variants have also been associated with progression-free or overall NHL survival in prognostic cohort studies.20,21,23,24 However, studies of prognosis after diagnosis have been limited to an evaluation of a small number of genes (≤ 3) in small numbers of patients with follicular lymphoma (< 125).
To more broadly test the hypothesis that inherited variability in cytokine and related immune genes affects follicular lymphoma survival, we evaluated the association of 73 single nucleotide polymorphisms (SNPs) from 44 candidate immune genes (Table 1). SNPs are substitutions at a single base pair in the genome, and they are the most common type of genetic variation, with an estimated 10 million SNPs per genome, or an average of 1 in every 300 nucleotides.25 We chose candidate SNPs from genes involved in key immune pathways, particularly those related to cytokine regulation and function, giving priority to those SNPs with data suggesting functional significance, an association with either etiology or prognosis in NHL or other immune diseases, and a minor allele frequency of more than 5% in the white population.18 We have previously published the association of these SNPs with risk of developing NHL from our population-based case-control study.18 Here, we present the results related to survival in the follicular lymphoma cases from this study.
Materials and methods
Each of the recruitment centers obtained local IRB approval for the study, and the overall study was approved by the National Institutes of Health.
Study population
This population-based study has been described previously.26 In brief, we enrolled 1321 patients with newly diagnosed, histologically confirmed NHL, aged 20 to 74 years, in 4 Surveillance, Epidemiology, and End Results (SEER) cancer registries (Detroit metropolitan area, northwestern Washington state, the state of Iowa, and Los Angeles County) from July 1998 through June 2000. In Iowa and Seattle, all consecutive patients were eligible, whereas in Los Angeles and Detroit, all African American patients were eligible, but only a random sample of non-African American patients was selected. Patients who were positive for HIV were excluded. All participants provided written informed consent in accordance with the Declaration of Helsinki, completed an in-person interview, and 1172 (89%) provided either a venous blood sample (n = 773) or mouthwash buccal cell (n = 399) sample. To assess the potential impact of nonresponse on the external validity of our results, we compared the observed survival in our sample set to survival data from the SEER database (SEER*Stat, 2005 release).
Genotyping
Details on genotyping have been published previously.18 DNA was extracted from blood clots, buffy coats, and buccal cell samples using established methods. All genotyping was conducted at the National Cancer Institute Core Genotyping Facility using the Taqman or EPOCH platforms (http://cgf.nci.nih.gov). Sequence data and assay conditions are provided at http://snp500cancer.nci.nih.gov.27 Genotyping was conducted first on only blood-based DNA samples and was then expanded to buccal samples for 52 of the 73 candidate SNPs based on an association with NHL risk.18 Forty replicate samples from each of 2 blood donors and duplicate samples from 100 study subjects processed in an identical fashion were interspersed for all genotyping assays and blinded from the laboratory. Agreement for QC replicates and duplicates was over 99% for all assays. For each plate of 368 samples, genotype-specific QC samples were also included and comprised 4 homozygote wild-type, 4 heterozygote, 4 homozygote variant, and 4 DNA negative controls. Successful genotyping was achieved for 96% to 100% of DNA samples for all SNPs. Twenty-two patients were ultimately excluded based on the quality control program, leaving 1150 subjects.
Demographic, clinical, and outcome data
Age, sex, race, Hispanic ethnicity, and education level were derived from patient interviews as part of the case-control study. Date of diagnosis, histology, stage, presence of B-symptoms, first course of therapy, date of last follow-up, and vital status were derived from linkage to registry databases at each study site in the spring of 2005. Of the 1150 subjects with genotyping data, 1115 (97%) linked to the registry databases.
Histology was coded initially according to the International Classification of Diseases-Oncology (ICD-O), 2nd ed,28 and this was later updated to the 3rd edition by each registry;29 for this analysis, we used the following codes for follicular lymphoma: 9690-9693, 9695-9698. Of the 1115 subjects, 278 were follicular lymphoma. Data on first course of therapy included use of single or multiagent chemotherapy, radiation, other therapies exclusive of chemotherapy and/or radiation, and no therapy (observation); information on individual agents and doses was not available. The SEER registries collect date and cause of death but do not collect data on treatment response or disease recurrence or progression.
Data analysis
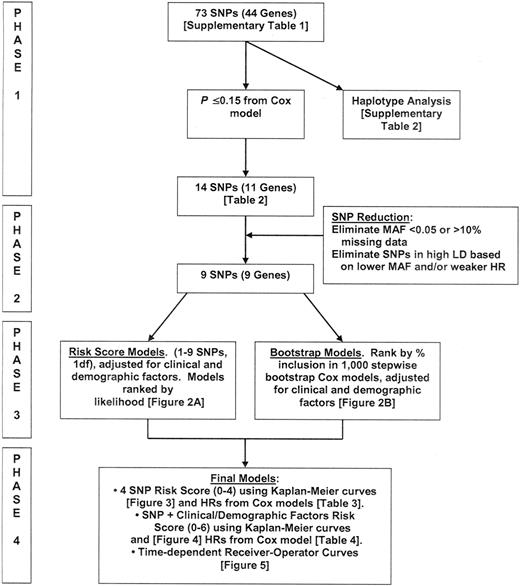
The approach to our analysis is outlined in Figure 1.
Single SNP analysis (phase 1)
We used Cox proportional hazards regression30 to estimate hazard ratios (HR) and 95% confidence intervals (95% CI) for the association of each individual genotype with overall survival, adjusting for age, clinical, and demographic factors (Table S1, available on the Blood website, see the Supplemental Materials link at the top of the online article). Age was modeled according to the standard FLIPI cutpoint (< 60 versus 60+ years).3 Clinical and demographic variables were modeled as 2 separate risk scores, analogous to a propensity score for logistic regression,31 to reduce the degrees of freedom of these parameters. Each risk score was the linear combination of the factor variables multiplied by their Cox regression coefficients (ie, xβ) from the Cox model. The clinical risk score was composed of stage (local, regional, distant, missing), presence of B-symptoms (no, yes, missing), and class of initial therapy (chemotherapy + radiation; chemotherapy + other; radiation only; no therapy), whereas the demographic risk score was composed of sex, race (white, all other), study center (Detroit, Iowa, Los Angeles, Seattle), and years of education (< 12, 12-15, 16+ years). The primary test for the association of each SNP used a codominant coding of the alleles (ie, 0, 1, 2) for each SNP (analogous to the Armitage test for trend in the logistic regression case). This statistic was chosen because it has good power to detect genotype associations under a range of genetic models.32
To address concerns about the large number of statistical tests performed, we computed the tail strength (TS) of the SNPs eligible for multigene models. This measure,33 closely related to the false discovery rate,34 assesses the relative strength of the collection of observed P values from an analysis of a large number of markers.
Haplotype analysis
We estimated haplotype frequencies for IL8 (rs4073, rs2227307, rs2227306), IL8RB (rs1126579, rs2230054, rs1126580), IL10 (rs1800871, rs1800872, rs1800896), and TNF/LTA (rs909253, rs2239704, rs1800629, rs361525, rs1799724) using an expectation-maximization algorithm.35 The posterior probabilities for each haplotype were included in a Cox model to assess their association with survival.
Multi-SNP modeling
Fourteen of the 73 SNPs met our statistical criteria of P ≤ .15 to move forward to Phase 2. We further excluded SNPs with a minor allele frequency of less than 0.05 or that were missing in more than 10% of study subjects from eligibility for multi-SNP models; this eliminated IL5 (rs2069818) and IL3 (rs40401). The remaining 12 SNPs were recoded as 0/1, 1 being the deleterious genotype(s); nondeleterious or missing genotype(s) were coded as 0, and hazard ratios (HRs) and 95% CI for the recoded SNPs are reported in Table 2. For SNPs in high linkage disequilibrium (LD; r2 > 0.8), we selected a single SNP based on a higher minor allele frequency and/or stronger HR. This eliminated a total of 3 SNPs from IL8 (rs2227306, rs2227307) and TNF (rs1799724), leaving 9 SNPs in 9 genes.
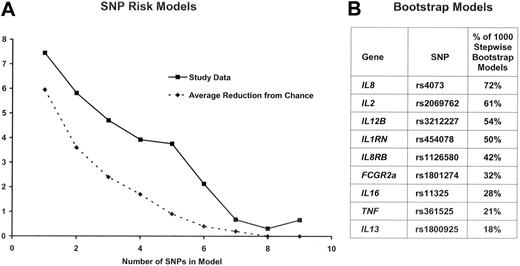
In Phase 3, for each of all 511 (ie, 29 - 1) possible combinations of these 9 SNPs, we created a SNP score variable by summing the number of deleterious genotypes for all the SNPs in each particular combination. This approach has been used recently in association studies.36,37 Each score variable was fit in a Cox model adjusting for age and the clinical and demographic risk score. The models were grouped by number of SNPs included in the SNP score variable (ie, 1 SNP, 2 SNPs, …, 9 SNPs), and they were ranked by likelihood. A comparison of the likelihood for the best 1 SNP, 2 SNP, …, 9 SNP models according to the number of SNPs included in the model is shown in Figure 2A. In parallel, we ran 1000 bootstrap stepwise selection Cox models (adjusting for age, clinical, and demographic risk scores) using these 9 SNPs.38 The percentage of models in which each SNP was included is shown in Figure 2B. Four SNPs were retained in 50% or more of the bootstrap models, IL8 (rs4073), IL2 (rs2069762), IL12B (rs3212227), and IL1RN (rs454078). The plot of the -2 log likelihood suggested a model with 5 or fewer SNPs, because the reduction in likelihood was marginal for more than 5 SNPs (Figure 2A). Furthermore, the 4 highest ranked SNPs from the bootstrap analysis were the same 4 SNPs in the best fitting 4-SNP risk score model. Based on these results, we selected a multi-SNP model with 4 SNPs.
Summary of Phase 3 results. Panel A shows the reduction in the -2 log likelihood when comparing the best 1 SNP, 2 SNP,…9 SNP model from the study data (solid line) as well as expected reduction due to chance (dashed line). Panel B ranks the percentage of 1000 stepwise bootstrap Cox models in which a SNP was included. The top 4 SNPs in the bootstrap model are the same 4 SNPs in the best 4-SNP risk model.
Summary of Phase 3 results. Panel A shows the reduction in the -2 log likelihood when comparing the best 1 SNP, 2 SNP,…9 SNP model from the study data (solid line) as well as expected reduction due to chance (dashed line). Panel B ranks the percentage of 1000 stepwise bootstrap Cox models in which a SNP was included. The top 4 SNPs in the bootstrap model are the same 4 SNPs in the best 4-SNP risk model.
In Phase 4, we assessed the 4 SNP model using Kaplan-Meier curves, Cox proportional hazards models, and time-dependent receiver-operator characteristics (ROC) curves for censored data.39 We also developed a single score that incorporated the 4 SNPs plus the clinical and demographic factors. To achieve this, we first developed a risk score by entering age and the clinical and demographic variables into a single Cox model and summed the linear combination of the factor variables multiplied by their Cox regression coefficients. These values were then divided into tertiles (0 = lower tertile/low risk, 1 = middle tertile/intermediate risk, 2 = upper tertile/high risk) to create a clinical and demographic tertile risk score. This score (0-2) was then added to the number of deleterious SNPs (0-4) from the 4 SNPs identified in phase 3 to create a single SNP and clinical risk score (0-6).
To compare the significance of the SNP and clinical risk score observed in our data to what we would expect from chance, we performed a permutation analysis. For each of 200 iterations, the patient ID for the genotype results was randomly permuted and merged with the clinical and outcome data. We chose 200 iterations because this yields adequate precision of the permutation P value while still being manageable computationally. The complete analysis (phases 1-4) was performed for each iteration, with each final model consisting of SNPs retained in more than 50% of stepwise Cox models on 1000 bootstrap samples. The sum of deleterious genotypes from these SNPs was added to the clinical and demographic tertile risk score to create a SNP and clinical risk score for each iteration. The likelihood ratio test statistics from the univariate Cox models for the SNP and clinical risk score was recorded for each iteration. The test statistic observed in our study data were then compared with the distribution of test statistics from the 200 permutation iterations. In addition, for each iteration, we determined the best 1,2,.,9 SNP model, as determined by likelihood, from all possible combinations of models (see phase 3 above). The mean reduction in likelihood from all 200 iterations for each number of SNPs 1,2,…,9 was plotted with the reduction in likelihood observed from our best multi-SNP models (Figure 2A).
Results
Descriptive results
The median age at diagnosis of the 278 cases was 57 years (range, 25-74); 42% were age 60 or older, 51% were male, and 90% were white. A majority of patients (55%) had advanced stage disease, and 13% had B symptoms. The most common initial therapy was a chemotherapy-based regimen (63%), followed by observation (25%) and radiation only (12%). During follow-up, 59 (21%) of the patients died (for 86% of these deaths, the underlying cause of death on the death certificate was coded as lymphoma), and the median follow-up of living patients was 59 months (range, 27-78 months). Age over 60 (HR = 1.52; 95% CI, 0.90-2.56) and the clinical (combination of stage, B symptoms, and type of treatment; HR = 2.64; 95% CI, 1.54-4.53) and demographic (combination of sex, race, center, and education; HR = 2.27; 95% CI, 1.03-5.01) risk scores were associated with overall survival when included in the same Cox model. The observed survival for the patients in our study was similar to that observed in the SEER program (Figure S1).
Single SNP and haplotype results
From phase 1 analysis, we identified 14 SNPs in 11 genes of potential interest based on our statistical criteria (see Methods), and the HRs for the rescored risk genotype(s) are reported in Table 2. Most of the HRs were modest, ranging from 1.4 to 2.0. The smallest observed P value (≤ .001) was for an IL12B polymorphism (rs3212227, exon8 + 159 A>C SNP; HRAC/CC = 1.83; 95%; CI, 1.06-3.06). The next smallest observed P value (P = .005) was for an IL5 polymorphism (rs2069818, C-745T; HRAC/AA = 5.58; 95% CI, 1.66-18.6), but this finding was based on only 3 cases with a variant genotype. The only other observed P value ≤ .01 was for a polymorphism in IL2 (rs2069762, exon2 T>G; P = .01; HRGT/TT = 1.80; 95% CI, 1.06-3.05). The tail strength of our set of SNPs was 0.25 (90% CI, 0.02-0.48). A positive tail strength indicates that the observed P values are more significant than what would be expected as a result of chance; the tail strength of 0.25 in our study suggests that this set of SNPs displays approximately 25% more signal than expected if there was no association between any SNPs and survival.
We found no strong associations for haplotypes of TNF/LTA (P = .2), IL10 (P = .3), IL8 (P = .2), or IL8RB (P = .06) with overall survival (Table S2).
Multi-SNP models
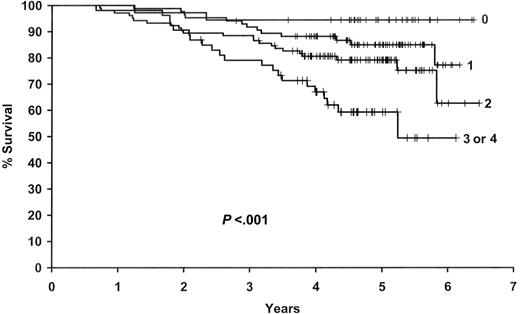
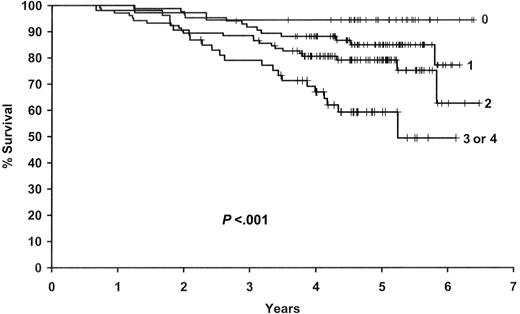
Based on the results from phases 2 and 3 of the analysis, we selected a 4 SNP model that included SNPs in IL8 (rs4073), IL2 (rs2069762), IL12B (rs3212227), and IL1RN (rs454078). The sum of deleterious genotypes from these 4 SNPs (0-4) was strongly associated with survival in both univariate (P≤ .001) and multivariable (P ≤ .001) analyses (Figure 3 and Table 3). Patients with 3 or 4 deleterious genotypes were over 12 times more likely to die compared with patients with zero deleterious genotypes (95% CI, 2.92-54.4), and there was a gradient in risk with the number of deleterious genotypes.
Results for the 4 SNP risk score. Kaplan-Meier curves by the number of deleterious genotypes from the 4 SNP Risk Score based on IL8 (rs4073), IL2 (rs2069762), IL12B (rs3212227), and IL1RN (rs454078).
Results for the 4 SNP risk score. Kaplan-Meier curves by the number of deleterious genotypes from the 4 SNP Risk Score based on IL8 (rs4073), IL2 (rs2069762), IL12B (rs3212227), and IL1RN (rs454078).
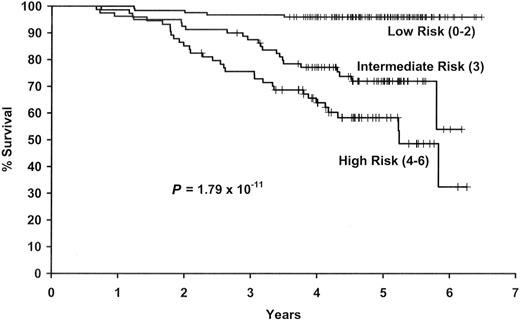
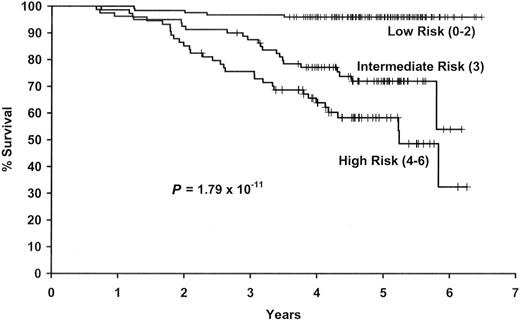
We next combined the number of deleterious genotypes (0-4) with the clinical and demographic risk score (0-2) into a single summary SNP and clinical risk score (0-6). This combined score was strongly associated with survival (P ≤ .001) (Figure 4). The 5-year Kaplan-Meier survival estimates (95% CI) were 96% (93%-100%), 72% (62%-83%), and 58% (48%-72%) for groups at low, intermediate, and high risk, respectively. As shown in Table 4, patients with a score of 4 to 6 were more than 14 times more likely to die compared with those with a score of 0 to 2 (95% CI, 5.70-37.7). Results were similar when we stratified the results on no vs any initial therapy (data not shown).
Results for the summary SNP and clinical and demographic risk score. Kaplan-Meier curves by level of the combined SNP and clinical and demographic risk score.
Results for the summary SNP and clinical and demographic risk score. Kaplan-Meier curves by level of the combined SNP and clinical and demographic risk score.
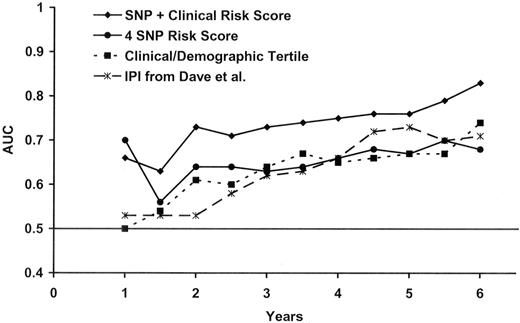
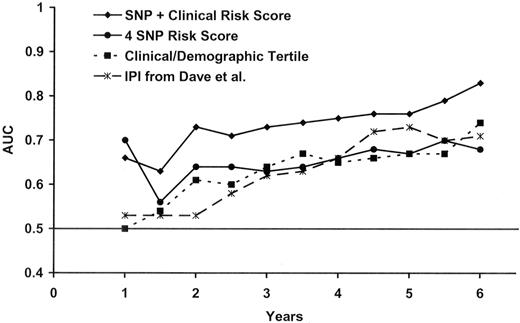
To further evaluate the predictive ability of our model, we conducted a time-dependent ROC analysis for censored data.39 This analysis uses sensitivity and specificity, both of which are time-dependent, to measure the prognostic capacity of a survival model as measured by the area under the curve (AUC). Based on time-dependent AUCs (Figure 5), the 4 SNP risk score performed similarly to the clinical and demographic risk score, but the combined SNP and clinical and demographic risk score performed better than either alone. After 2 years of follow-up, the AUC for the combined risk score was above 0.70; for example, the AUC at year 5 was 0.76 (95% CI, 0.70-0.82). The differences at 2, 3, 4, and 5 years between the AUC for the clinic and demographic risk score and the AUC for the combined SNP and clinical and demographic risk score (Figure 5) were statistically significant at the α = 0.05 level.
Time-dependent ROC analysis. Figure shows the time-dependent receiver-operator (ROC) analysis for the clinical and demographic risk score, the 4 SNP risk score, the combined SNP and clinical and demographic risk score, and the IPI from a previously published study by Dave et al.9
Time-dependent ROC analysis. Figure shows the time-dependent receiver-operator (ROC) analysis for the clinical and demographic risk score, the 4 SNP risk score, the combined SNP and clinical and demographic risk score, and the IPI from a previously published study by Dave et al.9
To compare the diagnostic performance of our clinical and demographic risk score to a more standard measure, we also included the time-dependent ROC results for the IPI from a large, previously published survival study of follicular lymphoma.9 This shows that our clinical and demographic risk score has a prognostic ability similar to the IPI.
To assess the significance of our multiSNP models, our entire model-building approach was applied to each of the 200 permuted datasets and the significance of the best model for each dataset was recorded. Our 4-SNP model from the true data outperformed the best model generated from 85% of the 200 permuted datasets, suggesting that our multi-SNP model has a level of significance even in light of the intense model building approach performed. In addition, the likelihood plots of the best 1,2,…,9 SNP models (Figure 2A) suggest that as many as 5 SNPs may add information for predicting survival beyond what would be expected due to chance, although we opted for 4 SNPs based on the combined results that included the bootstrap modeling.
Discussion
Using a population-based sample of follicular lymphoma cases diagnosed from 1998 to 2000 and followed through early 2005, we identified 14 SNPs from 11 cytokine and related immune regulation genes that were associated with overall survival from follicular lymphoma independent of clinical and demographic factors. Of these 14 SNPs, our modeling approach identified a SNP marker from each of 4 genes—IL8, IL2, IL12B, and IL1RN—that were the most robust predictors of survival individually, particularly when they were combined into a common carrier model that summed the number of deleterious genotypes. Combining the SNPs with clinical and demographic factors significantly increased the predictive ability of the model over a model with just clinical and demographic factors, with AUCs greater than 0.70 after 2 years of follow-up in the time-dependent ROC analysis. Although we took steps to guard against overfitting the data, including a permutation analysis of our entire model building strategy to assess the significance of our results compared with chance, these results require replication in independent populations.
Very few studies have linked inherited variation in immune genes with follicular lymphoma prognosis. Warzocha and colleagues24 found in an extended haplotype analysis that TNF (-308) and LTA (+252) high-producer alleles were associated with shorter progression-free (HR = 2.33; 95% CI, 1.17-4.64) and overall (HR = 1.92; 95% CI, 0.63-5.80) survival after adjustment for the IPI among 126 patients with diffuse large B-cell lymphoma (DLBCL), but there was no association among 96 follicular lymphoma patients. Fitzgibbon and colleagues20 also reported no association of these 2 SNPs with response rate or overall survival among 121 patients with follicular lymphoma. Our results are consistent with these findings for TNF and LTA.
We have previously published the association of most of these SNPs with risk of developing NHL from our population-based case-control study.18 In that analysis, SNPs in IL8, IL2, IL12B, and IL1RN were not associated with risk of all NHL or follicular lymphoma. In a pooled InterLymph study,19 IL2 rs2069762 was not associated with risk of all NHL (P = .31) or follicular lymphoma (P = .68), whereas there was a weak and not statistically significant positive association of the IL1RN SNP rs454078 with risk of all NHL (P = .062) and follicular lymphoma (P = .11). In contrast, the -308 TNF polymorphism (rs1800629) was associated with an increased risk of developing DLBCL but not follicular lymphoma.19 In another population-based case-control study, IL2 rs2069762 (P = .14) and IL12B rs3212227 (P = .39) were not associated with risk of follicular lymphoma.17 These findings suggest that although genetic variability in immune genes seems to be associated with lymphomagenesis in general, the specific SNPs and genes involved in NHL etiology may differ from genes involved in prognosis, although more data will be needed to fully evaluate this hypothesis.
In our analysis, it is notable that the most robust findings were observed in key cytokines from distinct, but overlapping networks. We observed common genetic variation in genes that (1) regulate the balance between Th1 and Th2 phenotype for T lymphocytes (eg, IL2 and IL12B); (2) serve as potent chemoattractants for neutrophils and monocytes (IL8); and (3) regulate the inflammatory pathway via interleukin 1 (eg, IL1RN). The IL2 SNP rs2069762 is in the promoter, and the G allele has been associated with higher production of IL12.40,41 IL12B encodes a subunit of IL12, a dimer cytokine secreted by monocytes that targets T cells and natural killer cells. IL12 also has antitumor activity in animal models.42 The IL12B SNP rs3212227 is in the 3′UTR, and the C allele has been associated with greater IL12 excretion in several studies.43–45 IL1 receptor antagonist (encoded by IL1RN) inhibits the binding of IL1α and IL1β to the IL1 receptor and thus opposes the inflammatory effects of IL1. Although there is a relatively extensive literature on the functional consequences and disease associations of an 86-base pair VNTR in intron 2 of this gene,46 the function of the rs454 078 SNP is not known. The A allele of the IL8-251A>T promoter polymorphism (rs4073) has been associated with higher production of IL-8, and IL-8 production has been linked with tumor vascularization, metastatic phenotype, and poor prognosis,47–49 including progression in patients with early-stage chronic lymphocytic leukemia.50 Thus, our finding that follicular lymphoma patients with the TT genotype (and therefore presumed lower IL8 production) had a poorer survival was unexpected and, if replicated, suggests that higher IL-8 levels (and concomitant greater inflammation) may play a protective role in follicular lymphoma. Together these observations underscore the complexity of disrupted pathways in NHL and in particular, the follicular subtype.
An important strength of this study was the population-based ascertainment of newly diagnosed cases. This suggests that the observations, if validated, could be considered for general application to community-based strategies for clinical care. Although our study had a slightly lower mean age and a slightly lower percentage of advanced stage disease than those reported in many series, this is consist with our population-based case ascertainment and truncation of recruitment into the study at age 74 years. This study is the largest and most comprehensive study of immune candidate SNPs in relation to survival conducted to date, and we used extensive quality controls to ensure high-quality genotypes. The value of the study also lies in the fact that the choice of SNPs was based on either functional data or prior associations with cancer or other immune-related diseases. Our statistical analyses were comprehensive, and we have been cautious to evaluate the robustness of our results to both false positives and false negatives. Finally, this analysis must be acknowledged as a first step, as other SNPs or haplotypes for these genes, or immune genes we did not assess, may be of greater prognostic relevance.
One of the most important potential limitations of this study is the lack of detailed data on prognostic factors or treatment. However, we did have several factors used in the FLIPI, including age, stage, and B-symptoms, and our clinical and demographic risk scores predicted survival with an AUC similar to the IPI in a large study of follicular lymphoma.9 Pathology classification was based on the cancer registry report without central review, but for follicular lymphoma this is reasonable.51 Although uniformity of treatment and outcome assessment afforded by a clinical trial offers many advantages over an observational study, enrollment patterns are not necessarily representative of what is observed in the community. A notable limitation is that all patients were initially treated before the widespread use of rituximab in the initial treatment of follicular lymphoma. We have not reached median survival for the cohort, and further follow-up could lead to other SNP associations. Finally, there could be confounding by comorbid conditions that are associated with these cytokine genotypes and that impact follicular lymphoma survival.
Our results support the hypothesis that inherited genetic variation in cytokine and related regulatory immune genes could influence survival in follicular lymphoma and provide further evidence for the contribution of host factors, including the tumor microenvironment, to the prognosis of follicular lymphoma.4,52 Our findings are also consistent with the emerging significance of the complex host genetic background in progression of cancer in general.53 In the future, the clinical evaluation of host genetics in cancer patients could become a useful tool in tailoring individual patient management and therapy, and complement gene expression profiling as a prognostic tool.53 Ultimately, the simultaneous evaluation of host and tumor factors would be expected to increase prognostic ability.
In summary, host genetic variability in immune genes, particularly IL8, IL2, IL12B, and IL1RN, individually and in particularly in combination, appear to be associated with overall survival in follicular lymphoma after accounting for clinical and demographic factors. In this regard, host immunogenetics represents a promising class of prognostic factors that warrant further evaluation.
The online version of this article contains a data supplement.
The publication costs of this article were defrayed in part by page charge payment. Therefore, and solely to indicate this fact, this article is hereby marked “advertisement” in accordance with 18 USC section 1734.
Acknowledgments
This work was supported by National Cancer Institute grants R01-CA96704 and P50-CA97274; the NCI Intramural Program; SEER contracts N01-PC-67010, N01-PC-67008, N01-PC-67009, N01-PC-65064, and N02-PC-71105.
We thank Peter Hui and Cristine Allmer for data management and Laura Huennekens for secretarial support.
National Institutes of Health
Authorship
Contribution: J.R.C. and P.H. designed the study; J.R.C., P.H., N.R., and S.J.C. obtained funding; J.R.C., W.C., S.D., R.K.S., C.F.L., and P.H. obtained clinical data; S.J.C., S.W., and N.R. obtained genetic data; M.J.M. and S.M.G. performed statistical analysis with input from S.W., J.R.C., and P.H; J.R.C. drafted the manuscript; and all authors reviewed and approved the final manuscript.
Conflict-of-interest disclosure: The authors declare no competing financial interests.
Correspondence: James R. Cerhan, Department of Health Sciences Research, Mayo Clinic College of Medicine, 200 1st ST SW, Rochester, MN 55905; e-mail: cerhan.james@mayo.edu.

