Abstract
Cooperative activation of Meis1 and Hoxa9 perturbs myeloid differentiation and eventually leads myeloid progenitors to leukemia, yet it remains to be clarified what kinds of subsequent molecular processes are required for development of overt leukemia. To understand the molecular pathway in Hoxa9/Meis1-induced leukemogenesis, retroviral insertional mutagenesis was applied using retrovirus-mediated gene transfer. The mice that received Hoxa9/Meis1-transduced bone marrow cells developed acute myeloid leukemia (AML), and Trib1, Evi1, Ahi1, Rarα, Pitpnb, and AK039950 were identified as candidate cooperative genes located near common retroviral integration sites. Trib1 and Evi1 were up-regulated due to retroviral insertions, and coexpression of these genes significantly accelerated the onset of Hoxa9/Meis1-induced AML, suggesting that Trib1 and Evi1 are the key collaborators. Furthermore, Trib1 by itself is a novel myeloid oncogene, enhancing phosphorylation of ERK, resulting in inhibition of apoptosis. These results demonstrate the importance of specific oncogene interaction in myeloid leukemogenesis.
Introduction
Carcinogenesis is a consecutive process of multiple genetic and epigenetic alterations that affect the target cell to acquire growth advantages and dysregulated growth from tissue environment.1 Plenty of genetic mutations have been discovered in both human and animal cancers. It should be noted that the mutations are cell-type specific and that there is specific genetic cooperation in the multi-step evolution of premalignant cells. The combination of genetic mutations alters cell fate, and specific genetic cooperation is therefore important for tumor phenotypes and biologic behaviors of cancer cells
Proper expression of AbdB-like Hox genes is a key molecular process in hematopoiesis and their deregulation perturbs myeloid differentiation, eventually resulting in leukemia with several cooperative genetic events.2 One of the important Hox genes in myeloid leukemogenesis is Hoxa9, which has been identified as a target for ecotropic retroviral integration in BXH2 murine AML3 as well as a fusion partner of NUP98 in human AML with t(7;11)(p15;p15) translocation.4,5 Importantly, cooperative activation of the Hox cofactor Meis1 is important for both Hoxa9- and NUP98-HOXA9–induced transformation of murine bone marrow cells.6,7 Recent studies have suggested that Meis1 might activate Flt3 receptor tyrosine kinase, which plays an important role in myeloid leukemogenesis.8–10 However, it remains to be clarified what kinds of subsequent molecular processes are required for complete leukemogenesis, and it is important to understand subsequent molecular steps that are cooperative for Hoxa9 and Meis1 activation.
We have addressed this issue by using retroviral insertional mutagenesis that has been applied for identification of oncogenes and tumor suppressor genes.11 Plenty of important disease genes have been isolated by this technique and many of the genes are in fact involved in human cancers. Retroviral integration in the bone marrow cells is randomly distributed over the whole genome, and the cells with integrations that contribute growth advantages are subsequently selected and clonally expanded. Cooperative genetic effects in leukemogenesis can be achieved by multi-copy integration of retroviruses. The multiple integrations do not occur simultaneously, but it is likely that the process is consecutive, since such cooperative integrations are extremely rare without any predisposition. When there is a primary genetic alteration in the target cell, genetic cooperation for the first hit can be investigated by this technique.12
Retrovirus-mediated gene transfer and bone marrow transfer of Hoxa9 and Meis1 induce AML at 100% penetrance.6,13 In this study we have found that there is clonal selection of the transduced bone marrow cells at the transformation step, and we have systematically cloned retroviral integration sites in Hoxa9/Meis1-induced AML. Inverse polymerase chain reaction (PCR) experiments identified 6 common integration sites (CISs), and candidate cooperative genes for Hoxa9/Meis1 coactivation were isolated at each CIS. Three of 6 CISs, Trib1, Evi1, and Ahi1, are up-regulated by retroviral integrations, and cooperativities between Trib1 or Evi1 and Hoxa9/Meis1 are exhibited both in vivo and in vitro. Moreover, we have revealed that there is a strong genetic interaction between Trib1 and Hoxa9/Meis1. This study underscores the power of the mouse mutagenesis system to clarify both genetic and functional interaction of leukemia disease genes.
Materials and methods
Retrovirus generation
Murine Hoxa9 and Meis1a cDNAs14 were myc or HA tagged, respectively, and subcloned into the pMYs retroviral vector. Similarly, murine Trib1 (purchased from Dnaform, Tokyo, Japan) and Evi1 (a gift from Kazuhiro Morishita) were FLAG tagged and subcloned into pMYs-IRES-GFP. The retrovirus vectors were transfected using Lipofectamine 2000 (Invitrogen, Carlsbad, CA) to Plat-E packaging cells15 (a gift from Toshio Kitamura). Viral titer was determined by measuring GFP-positive cells using FACS-calibur flow cytometer (Becton Dickinson, Franklin Lakes, NJ).
Animals, retroviral infection, and bone marrow transfer
Bone marrow cells were prepared from 8-week-old female C57Bl/6J mice purchased from CLEA Japan (Tokyo, Japan) 5 days after injection of 150 mg/kg body weight of 5-fluorouracil (Kyowa Hakko Kogyo, Tokyo, Japan). Bone marrow cells were cultured 24 hours in Iscove Modified Dulbecco Medium (Invitrogen) supplemented with 10% fetal bovine serum, 10 ng/mL IL-6, 10 ng/mL IL-3, and 100 ng/mL SCF. Retroviral stock was added into the medium containing bone marrow cells with 6 μg/mL of Polybrene (Sigma, St Louis, MO) and then spun at 1400 g for 2 hours. The spin infection was repeated after 24 hours and transferred to recipients. Recipients were X-ray irradiated (8.5 Gy; MBR-1520A; Hitachi Medico, Tokyo, Japan) and received 1 × 10⁶ freshly isolated bone marrow cells. Animals were housed, observed daily, and handled in accordance with the guidelines of the animal care committee at the Japanese Foundation for Cancer Research. Mice were monitored daily for evidence of disease, and smear samples of peripheral blood were examined every week. The onset of AML was determined by detecting myeloblasts in peripheral blood. All of the diseased mice were subjected to autopsy and analyzed morphologically and by flow cytometry. More than 20% of myeloid blasts in the bone marrow of all of the mice were diagnosed as AML, as indicated in Bethesda proposal.16 The survival rate of each group was evaluated using the Kaplan-Meier test. Images of leukemia cells were obtained using an Olympus BX40 microscope equipped with a 100×/1.30 NA oil objective (Olympus, Tokyo, Japan). Images were acquired with a C-4040 digital camera (Olympus) and were processed using Adobe Photoshop CS2 version 9.0 (Adobe Systems, San Jose, CA).
Southern- and Northern-blot analysis
Southern blotting was carried out using standard procedures.17 Genomic DNA samples were digested with NheI, HindIII, or EcoRV and probed with Hoxa9, Meis1, or GFP coding regions. Two micrograms of poly(A)+ RNA was extracted from leukemia samples and subjected to Northern analysis and probed with Hoxa9, Meis1, Trib1, Evi1, or Ahi1 coding regions. The β-actin probe was used as a control.
IPCR
Genomic DNA samples were digested with BamHI, EcoRI, NcoI, SacII, or EagI, self-ligated, and subjected to nested inverse PCR (IPCR). The PCR primers for each restriction digestion are available on request. PCR products were analyzed by agarose gel electrophoresis, subcloned into plasmids, and subjected to sequence analysis.
Replating assay
Retroviral transduced bone marrow cells were plated onto Petri dishes in Methocult M3534 methylcellulose medium (Stem Cell Technologies, Vancouver, BC, Canada) supplemented with IL-3, IL-6, and SCF at 1 × 10⁴ cells per plate. Colonies were counted and analyzed morphologically after 10 days and then harvested, and the same number of cells were replated in the same way.
Western-blot analysis
Western-blot analysis was performed using total cell lysates as described.17 Primary antibodies used were anti-myc (Roche, Basel, Switzerland), anti-HA (Roche), anti-FLAG (Sigma), anti–β-tubulin (Sigma), anti-p44/42 MAP kinase (Cell Signaling Technologies, Beverly, MA), and anti–phospho-p44/42 MAP kinase (Cell Signaling Technologies). Secondary anti–rat and anti–mouse horseradish peroxidase–conjugated antibodies were from Amersham (Little Chalfont, United Kingdom).
Fluorescence-activated cell sorter (FACS)
Single-cell suspensions of 1 × 10⁶ cells were incubated with fluorescein isothiocyanate–conjugated antibodies Gr-1, Mac-1, B220, or CD3 (Pharmingen, San Diego, CA) for 30 minutes, washed 3 times in PBS, and applied to a FACS-calibur flow cytometer.
Cell culture, stimulation experiment, and apoptosis assay
HeLa cells were maintained in Dulbecco modified Eagle medium supplemented with 10% fetal calf serum (FCS). PMA (50 ng/mL; Sigma) was added and cells were harvested at the time indicated in Figure 6A. Leukemia cells and primary bone marrow cells were cultured in RPMI1640 medium supplemented with 10% FCS and IL-3 (10 ng/mL). Cytokine starvation was performed in RPMI medium containing 0.5% FCS, and IL-3 (20 ng/mL) was added for stimulation. Apoptosis assays were performed using annexin V–PE apoptosis detection kit I (Pharmingen) according to the manufacturer's protocol.
Total RNA extraction, reverse transcription, and real-time reverse transcriptase–PCR (RT-PCR)
Total RNA was extracted from the frozen tissue using a standard method. One milligram of total RNA was used to generate cDNA using ImProm-II Reverse Transcription System (Promega, Madison, WI). Real-time PCR was performed using 25 μL Power SYBR Green PCR Master Mix (Applied Biosystems, Foster City, CA), 1 μL 10-μM specific primers, 1 μL cDNA, and water to a final volume of 50 μL. The specific forward and reverse primers to produce approximately 100– to 200–base pair amplicons for optimal amplification in real-time PCR were designed as follows: Hoxa9, 5′-CCGGGTTATTGGGATCGAT-3′ and 5′-GCGCCTTCTCCGAAAACA-3′; Hoxa7, 5′-GCCTCCTACGACCAAAACATC-3′ and 5′-TTCCTTCTCCAGTTCCAGCG-3′; Meis1, 5′-CAGGACTTACCATCCTTCAAGTG-3′ and 5′-GCGCTCTGATGCCCATGTGC-3′; Gapdh, 5′-TGTCGTGGAGTCTACTGGTGTCTTC-3′ and 5′-GGAGATGATGACCCTTTTGGCTC-3′. PCR was performed using 7500Fast Real-Time PCR System (Applied Biosystems) using the following protocol: 35 cycles of 3-step PCR (95°C for 15 seconds, 55°C for 30 seconds, 72°C for 30 seconds).
Statistical analysis
Growth curves of cumulative numbers of bone marrow cells between Trib1/Hoxa9/Meis1 and Hoxa9/Meis1 and Evi1/Hoxa9/Meis1 and Hoxa9/Meis1 were compared by a multivariate analysis of variance (MANOVA)–based approach.18 The differences among the above groups were tested using statistical software R (version 2.4.0) with the agce package (version 1.2; http://www.r-project.org).
Results
Identification of common retroviral integration sites in Hoxa9/Meis1-induced AML
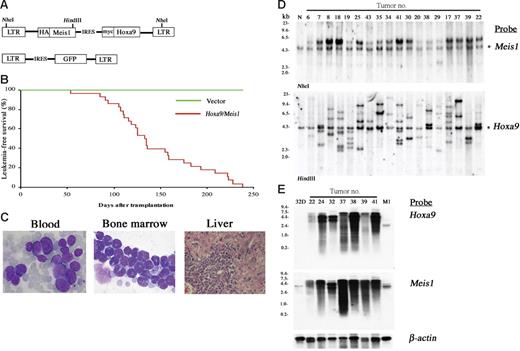
The pMYs retroviral vector was engineered to bear a Meis1-IRES-Hoxa9 sequence (Figure 1A). C57Bl/6J mouse bone marrow cells were transduced with the retrovirus and the cells were transferred to sublethally irradiated syngenic mice. As shown in Figure 1B-C, 100% of recipient mice died of AML by 238 days, with a mean survival of 133 days after bone marrow transfer (BMT). Southern-blot analysis showed that each leukemia has an average of 3.5 copies of the retrovirus with an expected molecular size (Figure 1D). The relative intensity of the integrations within each line indicated that they were derived from 1 or at most 2 infected cells, as was often the case in insertional mutagenesis using replication-deficient retroviruses.19 Both Hoxa9 and Meis1 probes detect specific transcripts of equal molecular sizes (Figure 1E), indicating that Hoxa9-IRES-Meis1 chimeric transcripts are overexpressed in all of the tumors. The findings suggest that overexpression of Hoxa9 and Meis1 may be sufficient to induce a particular step of leukemogenesis but may still require subsequent clonal selection for development of overt AML.
Cotransduction of Hoxa9 and Meis1 induces clonal AML. (A) The structure of the Hoxa9/Meis1 (top) and control (bottom) retroviral vectors. (B) AML developed by BMT with Hoxa9/Meis1-transduced cells. The leukemia-free survival rates of Hoxa9/Meis1 (n = 28, red line) versus GFP (n = 10, green line) mice are shown. (C) The peripheral blood (left) and bone marrow (center) smears stained with Wright-Giemsa show increase of myeloblasts. Diffuse infiltration of leukemic blasts are also observed in liver (right, hematoxylin and eosin staining). Original magnification, 1000× (blood and bone marrow) and 200× (liver). (D) Southern-blot analysis of AML. DNA samples were digested with NheI (top) or HindIII (bottom), which cut the retrovirus at both long terminal repeats (LTRs) or only once within the insert, respectively. Probes used were DNA fragments of Meis1 (top) and Hoxa9 (bottom) coding sequences. Integrations of normal-sized retroviruses were confirmed (top) and monoclonal or oligoclonal integrations were indicated (bottom). Asterisks denote endogenous Meis1 (top) and Hoxa9 (bottom) bands. Normal liver DNA of the C57Bl/6J mouse was used as control (N). (E) Northern-blot analysis of AML. Identical size of transcripts is detected by both Hoxa9 (top) and Meis1 (bottom) probes. RNA samples of 32Dcl3 and M1 myeloid cells were used as controls. The β-actin probe was used as a loading control.
Cotransduction of Hoxa9 and Meis1 induces clonal AML. (A) The structure of the Hoxa9/Meis1 (top) and control (bottom) retroviral vectors. (B) AML developed by BMT with Hoxa9/Meis1-transduced cells. The leukemia-free survival rates of Hoxa9/Meis1 (n = 28, red line) versus GFP (n = 10, green line) mice are shown. (C) The peripheral blood (left) and bone marrow (center) smears stained with Wright-Giemsa show increase of myeloblasts. Diffuse infiltration of leukemic blasts are also observed in liver (right, hematoxylin and eosin staining). Original magnification, 1000× (blood and bone marrow) and 200× (liver). (D) Southern-blot analysis of AML. DNA samples were digested with NheI (top) or HindIII (bottom), which cut the retrovirus at both long terminal repeats (LTRs) or only once within the insert, respectively. Probes used were DNA fragments of Meis1 (top) and Hoxa9 (bottom) coding sequences. Integrations of normal-sized retroviruses were confirmed (top) and monoclonal or oligoclonal integrations were indicated (bottom). Asterisks denote endogenous Meis1 (top) and Hoxa9 (bottom) bands. Normal liver DNA of the C57Bl/6J mouse was used as control (N). (E) Northern-blot analysis of AML. Identical size of transcripts is detected by both Hoxa9 (top) and Meis1 (bottom) probes. RNA samples of 32Dcl3 and M1 myeloid cells were used as controls. The β-actin probe was used as a loading control.
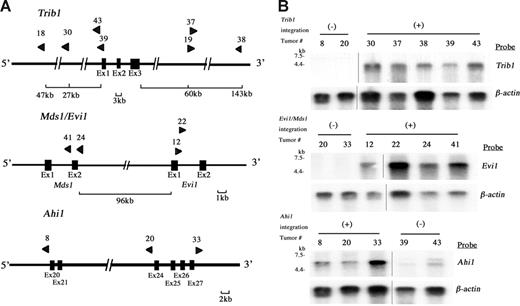
Ninety-seven retroviral integration sites in 28 leukemias were identified by using inverse PCR (Table S1, available on the Blood website; click on the Supplemental Materials link at the top of the online article). In these integration sites, 6 were common integration sites (CISs: the integration sites shown in more than 2 independent tumors/animals). A BLAT search using a public database21 revealed candidate target genes in each CIS and the results were compared with reported integration sites in Retroviral Tagged Cancer Gene Database (RTCGD).20 The incidence of integrations was the highest at the Trib1 locus (25.0%) followed by Mds1/Evi1 (14.3%), Ahi1 (10.7%), and 3 others (7.1%; Table 1). The physical maps of Trib1, Mds1/Evi1, and Ahi1 are shown in Figure 2A, and clonal integrations of each tumor were confirmed by Southern blotting using site-specific probes (data not shown). Expression of Trib1, Evi1, and Ahi1 was examined by Northern blotting (Figure 2B), and these 3 genes were up-regulated in the leukemias with retroviral integrations, whereas the leukemias without integrations showed no or only minimal expression. It should be noted that up-regulated expression of Trib1 is obvious even when viral integrations are seen at 145 kb downstream or 27 kb upstream of the gene, whereas Trib1 expression in the tumors without viral integrations is very low (Figure 2A-2B). In the Mds1/Evi1 locus, integrations were also seen at 96 kb upstream of Evi1 exon 1, and overexpression of normal-sized Evi1 transcripts was observed in the tumors with these integration sites (Figure 2A-B). The similar finding of remote integration at the Mds1/Evi1 locus was reported previously.22 Integration at the Ahi1 locus was also comparable with the reported result.23 These findings strongly suggest that Trib1, Evi1, and Ahi1 are targets for retroviral integrations and that they may act as cooperative genes for Hoxa9/Meis1 coactivation in myeloid leukemogenesis.
Retroviral integrations at Trib1, Mds1/Evi1, and Ahi1 loci. (A) Physical maps of Trib1 (top), Mds1/Evi1 (middle), and Ahi1 (bottom) loci. Arrowheads indicate location and orientation of each retroviral integration. (B) Northern-blot analysis of Trib1 (top), Evi1 (middle), and Ahi1 (bottom) expression. Overexpression of each gene in leukemias with retroviral integrations (+) is exhibited, whereas only a little or no expression is seen in leukemias without integration at these loci (-). The β-actin probe was used as a loading control. Two groups of lanes in the same filters were cut and pasted together and the borders were indicated by vertical lines.
Retroviral integrations at Trib1, Mds1/Evi1, and Ahi1 loci. (A) Physical maps of Trib1 (top), Mds1/Evi1 (middle), and Ahi1 (bottom) loci. Arrowheads indicate location and orientation of each retroviral integration. (B) Northern-blot analysis of Trib1 (top), Evi1 (middle), and Ahi1 (bottom) expression. Overexpression of each gene in leukemias with retroviral integrations (+) is exhibited, whereas only a little or no expression is seen in leukemias without integration at these loci (-). The β-actin probe was used as a loading control. Two groups of lanes in the same filters were cut and pasted together and the borders were indicated by vertical lines.
Trib1 and Evi1 cooperate with Hoxa9/Meis1 on myeloid proliferation and accelerate AML
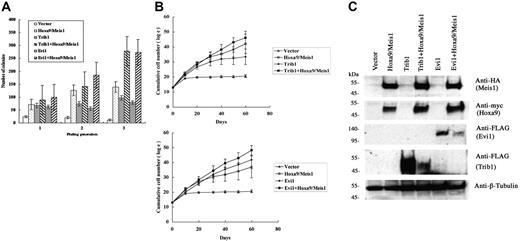
We have further analyzed the cooperative activities of Trib1 and Evi1 for Hoxa9 and Meis1 overexpression. Mouse bone marrow cells were transduced with either Trib1 or Evi1 retroviruses in the presence or absence of pMYs-Meis1-IRES-Hoxa9. Replating assays of bone marrow cells transduced with the Hoxa9/Meis1 retrovirus showed enhanced replating activity. Expression of Trib1 or Evi1 also resulted in increased colony formation. More importantly, coexpression of Trib1 or Evi1 and Hoxa9/Meis1 showed 2- or 1.9-fold more colonies at the third replating than those with Hoxa9/Meis1 only, respectively (Figure 3A). Enhanced proliferative activities of Hoxa9/Meis1-expressing bone marrow cells were also exhibited in liquid culture of bone marrow cells by cotransduction with Trib1 or Evi1 (Figure 3B). Thus, both self-renewal and proliferative activities of Hoxa9/Meis1-expressing myeloid progenitors are enhanced by Trib1 and Evi1. In addition, both Trib1 and Evi1 by themselves promote growth potency of myeloid progenitors.
Cooperative enhancement of Trib1 and Evi1 for Hoxa9/Meis1-induced self-renewal and proliferation of myeloid progenitors. (A) Replating assays were performed using primary bone marrow cells infected with indicated retroviruses. The colony numbers in methylcellulose culture during 3 replatings were measured, and significant increase of colonies at the third replating is shown in Trib1/Hoxa9/Meis1 or Evi1/Hoxa9/Meis1 versus Hoxa9/Meis1. The means ± standard deviations from 3 independent experiments are shown. (B) Trib1 and Evi1 cooperatively promote myeloid-cell proliferation with Hoxa9 and Meis1. As in panel A, cumulative numbers of bone marrow cells in liquid culture medium were counted in the indicated duration. The means of the natural logarithm of cell numbers from 3 independent experiments are shown. Statistical analyses indicated that the difference of growth curves was significant between Trib1/Hoxa9/Meis1 and Hoxa9/Meis1 (P = .002) and between Evi1/Hoxa9/Meis1 and Hoxa9/Meis1 (P < .001). (C) Expression of epitope-tagged Meis1 (HA), Hoxa9 (myc), Evi1 (FLAG), and Trib1 (FLAG) in bone marrow cells was confirmed by Western blotting. β-tubulin was used as a loading control.
Cooperative enhancement of Trib1 and Evi1 for Hoxa9/Meis1-induced self-renewal and proliferation of myeloid progenitors. (A) Replating assays were performed using primary bone marrow cells infected with indicated retroviruses. The colony numbers in methylcellulose culture during 3 replatings were measured, and significant increase of colonies at the third replating is shown in Trib1/Hoxa9/Meis1 or Evi1/Hoxa9/Meis1 versus Hoxa9/Meis1. The means ± standard deviations from 3 independent experiments are shown. (B) Trib1 and Evi1 cooperatively promote myeloid-cell proliferation with Hoxa9 and Meis1. As in panel A, cumulative numbers of bone marrow cells in liquid culture medium were counted in the indicated duration. The means of the natural logarithm of cell numbers from 3 independent experiments are shown. Statistical analyses indicated that the difference of growth curves was significant between Trib1/Hoxa9/Meis1 and Hoxa9/Meis1 (P = .002) and between Evi1/Hoxa9/Meis1 and Hoxa9/Meis1 (P < .001). (C) Expression of epitope-tagged Meis1 (HA), Hoxa9 (myc), Evi1 (FLAG), and Trib1 (FLAG) in bone marrow cells was confirmed by Western blotting. β-tubulin was used as a loading control.
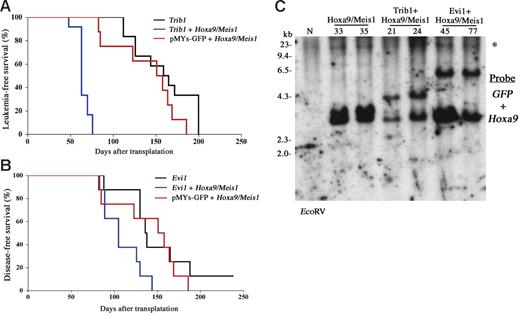
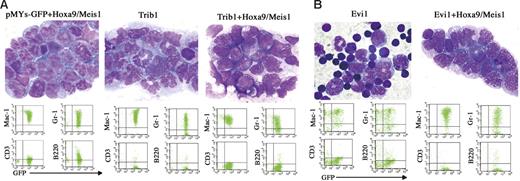
Cooperative leukemogenic activities of Trib1 or Evi1 and Hoxa9/Meis1 were more evident in vivo. The bone marrow cells cotransduced with Trib1 or Evi1 and Hoxa9/Meis1 retroviruses were subjected to transfer experiments. As shown in Figure 4A, coexpression of Trib1 significantly accelerated disease onset of Hoxa9/Meis1-induced AML, with mean survival time of 63 days. Moreover, Trib1 by itself showed a strong transforming activity against primary bone marrow cells. Cooperation between Trib1 and Hox/Meis coactivation was further proven by the fact that the Trib1 retroviruses were frequently found inserted at Hox or Meis1 (3 in Hoxa9, 2 in Hoxa7, and 1 in Meis1 out of 12 AMLs; Table S1 and Figure S1). As expected, Trib1-induced AMLs with Hoxa7 or Hoxa9 integrations exclusively showed significant overexpression of these genes (Figure S1). On the other hand, Meis1 expression was up-regulated regardless of the integration, suggesting that there may be additional mechanisms for Meis1 up-regulation. All of the leukemic cells expressed myeloid surface markers Mac1 and Gr1, and there was no significant phenotypic difference among Hoxa9/Meis1-, Trib1-, and Trib1/Hoxa9/Meis1-induced AMLs (Figure 5A).
Trib1 and Evi1 accelerate the onset of Hoxa9/Meis1-AML. (A-B) Leukemia- and disease-free survival of animals was compared. Kaplan-Meier survival curves are shown for Trib1 (n = 12), Trib1/Hoxa9/Meis1 (n = 12), and Hoxa9/Meis1 + pMYs-GFP (n = 8) (A). The same analysis was performed for Evi1 (n = 8), Evi1/Hoxa9/Meis1 (n = 8), and Hoxa9/Meis1 + pMYs-GFP (n = 8) (B), although single infection of the Evi1 retrovirus did not induce AML but did induce death due to severe anemia as a result of MDS. (C) Integrations of each retrovirus were confirmed by Southern blotting. Leukemia DNAs were digested with EcoRV and hybridized with GFP (for Trib1 and Evi1 retroviruses) and Hoxa9 probes. N indicates the liver DNA of the normal C57Bl/6J mouse; and *, the endogenous Hoxa9 signal.
Trib1 and Evi1 accelerate the onset of Hoxa9/Meis1-AML. (A-B) Leukemia- and disease-free survival of animals was compared. Kaplan-Meier survival curves are shown for Trib1 (n = 12), Trib1/Hoxa9/Meis1 (n = 12), and Hoxa9/Meis1 + pMYs-GFP (n = 8) (A). The same analysis was performed for Evi1 (n = 8), Evi1/Hoxa9/Meis1 (n = 8), and Hoxa9/Meis1 + pMYs-GFP (n = 8) (B), although single infection of the Evi1 retrovirus did not induce AML but did induce death due to severe anemia as a result of MDS. (C) Integrations of each retrovirus were confirmed by Southern blotting. Leukemia DNAs were digested with EcoRV and hybridized with GFP (for Trib1 and Evi1 retroviruses) and Hoxa9 probes. N indicates the liver DNA of the normal C57Bl/6J mouse; and *, the endogenous Hoxa9 signal.
Phenotype of Trib1- and Evi1-related AMLs. (A, Top) Proliferation of myeloblasts in bone marrow of Hoxa9/Meis1 + pMYs-GFP, Trib1, and Trib1/Hoxa9/Meis1 AMLs (Wright-Giemsa staining). (Bottom) FACS analysis of the same AMLs, showing positivities for myeloid markers Mac-1 and Gr-1. (B, Top) Bone marrow samples of Evi1 MDS mouse and Evi1/Hoxa9/Meis1 AML (Wright-Giemsa staining). Original magnification, 1000×. (Bottom) FACS analysis of the same samples.
Phenotype of Trib1- and Evi1-related AMLs. (A, Top) Proliferation of myeloblasts in bone marrow of Hoxa9/Meis1 + pMYs-GFP, Trib1, and Trib1/Hoxa9/Meis1 AMLs (Wright-Giemsa staining). (Bottom) FACS analysis of the same AMLs, showing positivities for myeloid markers Mac-1 and Gr-1. (B, Top) Bone marrow samples of Evi1 MDS mouse and Evi1/Hoxa9/Meis1 AML (Wright-Giemsa staining). Original magnification, 1000×. (Bottom) FACS analysis of the same samples.
Coexpression of Evi1 also accelerated leukemia onset though the effect was not as strong as that of Trib1 (Figure 4A). In addition, expression of Evi1 alone could not induce AML efficiently but BMT expression of Evi1-transduced cells resulted in myelodysplastic syndrome (MDS) and most of the mice died of severe anemia, as was similar to findings reported previously,24 whereas Evi1/Hoxa9/Meis1-induced leukemias were typical AMLs like other groups (Figure 5B). These results indicate that Trib1 and Evi1 are cooperative oncogenes for Hoxa9/Meis1-induced AML.
Trib1 enhances the MAPK signaling pathway
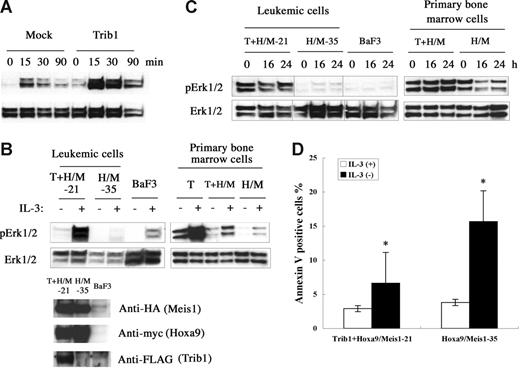
Trib1 belongs to a gene family homologous to drosophila tribbles.25–27 Murine Trib1 encodes 372 amino acids containing a central serine/threonine kinase–like domain. Both Trib1 and Trib3 interact with MAPKKs and their interaction enhances MAPK phosphorylation.27 Trib1 is expressed in human bone marrow27 and human AML cell lines,28 suggesting that Trib1 may play some role in both hematopoiesis and leukemogenesis. To understand the functional role of Trib1 up-regulation, the MAPK signaling was examined. When murine Trib1 was overexpressed in HeLa cells, phosphorylation of ERK was significantly enhanced upon PMA stimulation (Figure 6A). Trib1 and Hoxa9/Meis1-induced or Hoxa9/Meis1-induced leukemic cells were then compared for ERK phosphorylation, and leukemic cells with Trib1 overexpression showed significant enhancement of ERK phosphorylation on IL-3 stimulation (Figure 6B). The same result was exhibited when Trib1 was introduced into primary bone marrow cells with Hoxa9/Meis1 (Figure 6B right). Moreover, high-level ERK phosphorylation was well preserved in the leukemic cells and primary bone marrow cells with Trib1 overexpression, even after IL-3 was removed from the growth medium for 24 hours, whereas ERK is not highly phosphorylated in the leukemic cells or primary bone marrow cells without Trib1 expression (Figure 6C). These data indicate that Trib1 enhances MAPK signaling upon cytokine stimulation both in hematopoietic and nonhematopoietic cells and that its overexpression causes prolonged ERK signaling after cytokine removal. Finally, an antiapoptotic effect of the Trib1 overexpression was evaluated by the annexin V assay. Trib1-positive leukemic cells were more resistant against apoptosis by IL-3 starvation than Trib1-negative cells (Figure 6D). These results suggest that Trib1 cooperates with Hoxa9 and Meis1 by interacting with the MAPK pathway of which upstream Flt3 is already activated by Meis1, resulting in protection against apoptotic signals.
Trib1 enhances phosphorylation of MAPK. (A) Phosphorylation of ERK1/2 on stimulation of HeLa cells by PMA. Overexpression of Trib1 enhances PMA-induced ERK1/2 phosphorylation. (B) Trib1 induces extensive phosphorylation by IL-3 stimulation. IL-3 was added after 16 hours starvation and phosphorylated ERK was examined in Trib1-positive (21) and -negative (35) Hoxa9/Meis1-AMLs (left) and primary bone marrow cells transduced with Trib1 (T), Tirb1/Hoxa9-Meis1 (T + H/M) retroviruses, or only Hoxa9-Meis1 (H/M) retroviruses. ERK phosphorylation in BaF3 cells with same treatment is shown as control. Expression of Hoxa9, Meis1, and Trib1 proteins in leukemia cells are shown by Western blotting. Each box represents a separate experiment. (C) ERK is constitutively phosphorylated in IL-3 depletion. Phosphorylation of ERK was examined after IL-3 removal from growth medium for the same AMLs and primary bone marrow cells used in panel B. Durations of IL-3 starvation are indicated. Each box represents a separate experiment. Three groups of lanes in the same filter were cut and pasted together, and the borders were indicated by vertical lines. (D) Trib1 expression suppressed apoptosis during IL-3 starvation. Frequencies of annexin V–positive cells were compared between Trib1-positive (21) and -negative (35) AMLs 16 hours after IL-3 removal. The means ± standard deviations from 3 independent experiments are shown. *P < .05.
Trib1 enhances phosphorylation of MAPK. (A) Phosphorylation of ERK1/2 on stimulation of HeLa cells by PMA. Overexpression of Trib1 enhances PMA-induced ERK1/2 phosphorylation. (B) Trib1 induces extensive phosphorylation by IL-3 stimulation. IL-3 was added after 16 hours starvation and phosphorylated ERK was examined in Trib1-positive (21) and -negative (35) Hoxa9/Meis1-AMLs (left) and primary bone marrow cells transduced with Trib1 (T), Tirb1/Hoxa9-Meis1 (T + H/M) retroviruses, or only Hoxa9-Meis1 (H/M) retroviruses. ERK phosphorylation in BaF3 cells with same treatment is shown as control. Expression of Hoxa9, Meis1, and Trib1 proteins in leukemia cells are shown by Western blotting. Each box represents a separate experiment. (C) ERK is constitutively phosphorylated in IL-3 depletion. Phosphorylation of ERK was examined after IL-3 removal from growth medium for the same AMLs and primary bone marrow cells used in panel B. Durations of IL-3 starvation are indicated. Each box represents a separate experiment. Three groups of lanes in the same filter were cut and pasted together, and the borders were indicated by vertical lines. (D) Trib1 expression suppressed apoptosis during IL-3 starvation. Frequencies of annexin V–positive cells were compared between Trib1-positive (21) and -negative (35) AMLs 16 hours after IL-3 removal. The means ± standard deviations from 3 independent experiments are shown. *P < .05.
Discussion
Here we show novel genetic cooperation in myeloid leukemogenesis using retroviral insertional mutagenesis. Using similar techniques, several studies have successfully identified specific interactions of disease genes in carcinogenesis (for reviews, see Mikkers and Berns,11 and Nakamura12 ). Multiple lines of evidence have emphasized that Meis1 is an important cofactor for Hoxa9 and its chimeric form NUP98-HOXA9 in leukemogenesis.6,7,17,29 In addition, insertional mutagenesis applied to the NUP98-HOXA9 transgenic mouse by mating with the BXH2 mouse, which expresses high copy numbers of the ecotropic retrovirus, identified several other cooperative genes.17 However, the replication-competent retroviruses can repeatedly infect host cells12 and it is thus unclear whether these genes are cooperative for NUP98-HOXA9 itself or NUP98-HOXA9 and Meis1 coactivation. Alternatively, leukemia disease genes that function in the later stage of leukemogenesis could be isolated in the system. Our present study uses replication-deficient viruses that infect host cells only once, therefore it is useful to detect direct cooperation of the gene of interest.
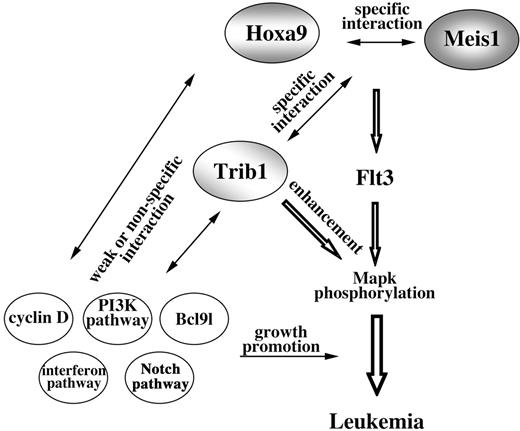
Our study revealed strong genetic interaction between Trib1 and Hoxa9/Meis1 coactivation. The Hoxa locus is a frequent target for integration of retrovirus in Trib1-induced AML. Interestingly, selectivity of retroviral insertions was greatly reduced in Trib1/Hoxa9/Meis1-induced AML. Southern-blot analysis showed that most of these leukemias were polyclonal (Figure S2) and the integration sites were much more diverse than in Hoxa9/Meis1- and Trib1-induced AML, with only 3 CISs (Lcp2, Gpr56, and Bcl9l) at low incidences (Table S2). In addition, cyclin-related genes (cyclin D1 and D3 and cyclin-dependent kinase–like gene) and interferon-related genes (IFN-γ, IFN-α receptor, and 2 interferon-induced genes) were involved. These data clearly indicate that accumulation of gene mutations is important and that there is specific genetic cooperation in the early steps of carcinogenesis, whereas this specificity is no longer required in the later stage (Figure 7). In the later stage, a broad spectrum of oncogenic stimuli may be able to promote aggressive growth and/or blastic infiltration of leukemic cells.
Model of Hoxa9/Meis1/Trib1 interaction in leukemogenesis. Cooperation of Hoxa9 and Meis1 up-regulates Flt3, and as a result the hematopoietic cells are sensitive for cytokine signals. Trib1 enhances the downstream response and thus Mapk phosphorylation is promoted. While cooperations between Hoxa9 and Meis1 and between Trib1 and Hoxa9/Meis1 are specific, subsequent genetic events are less specific for Hoxa9/Meis1/Trib1 pathways.
Model of Hoxa9/Meis1/Trib1 interaction in leukemogenesis. Cooperation of Hoxa9 and Meis1 up-regulates Flt3, and as a result the hematopoietic cells are sensitive for cytokine signals. Trib1 enhances the downstream response and thus Mapk phosphorylation is promoted. While cooperations between Hoxa9 and Meis1 and between Trib1 and Hoxa9/Meis1 are specific, subsequent genetic events are less specific for Hoxa9/Meis1/Trib1 pathways.
The FLT3/MAPK pathway is an important signaling in hematopoietic cells and leukemias.30,31 In human AML, activation mutations of FLT3 such as an internal tandem duplication of the juxtamembrane domain or a missense mutation of the kinase domain have frequently been observed.32 Overexpression of wild-type Flt3 also induces AML in mice in collaboration with NUP98-HOXD13 or NUP98-HOXA10.9 A recent study indicates that Meis1 directly up-regulates Flt3,10 explaining in part the role of Meis1 overexpression in leukemogenesis and indicating an important cooperation between Hox and MAPK signaling pathways. Our present study and the previous report indicate that activation of Trib1 by retroviral integration interacts with the receptor tyrosine kinase/MAPK pathway and enhances MAPK signals.27
Evi1 is first identified as a CIS in AKXD-23 murine AML,33 and the human homolog is involved in MDS with t(3;3)(q21;q26) translocation and inv(3)(q21q26) inversion.34,35 Evi1 encodes a zinc finger transcription factor with a SET/PR domain and plays an important role in self-renewal and repopulation of hematopoietic stem cells (HSCs).36 It is found that Evi1 is a frequent target for retroviral insertion without any oncogenic stimuli.19,37,38 These findings suggest that overexpression of Evi1 in HSCs may extend their lifespan and may eventually immortalize HSCs.19 Single Evi1 overexpression results in the MDS-like phenotype, as was shown in the previous study,24 in which differentiation block is a key phenotypic feature, and HSCs in aged Evi1-expressing mice are reduced in number. Nevertheless, expression of Evi1 accelerated Hoxa9/Meis1 oncogenicity, suggesting that the cooperativity between Evi1 and Hoxa9/Meis1 may modify HSC function. Alternatively, constitutive expression of Evi1 or Hoxa9 may alter cellular context that accepts an oncogenic signal of its specific collaborator.
The Ahi1 locus is first identified as an Abelson helper provirus integration site in pre-B-cell lymphomas,39 and deregulated expression of Ahi1 was reported in human BCR-ABL–positive myeloid leukemias,40 suggesting its important role in leukemogenesis. However, we have observed neither significant cooperativity between Ahi1 and Hoxa9/Meis1 nor the transforming activity of Ahi1 by itself (data not shown). Ahi1 is located in mouse chromosome 10 at 45 kb downstream of c-Myb. All of the integration sites in this study as well as reported cases are located in the 3′ region of Ahi1, also suggesting possible involvement of c-Myb. However, it has been reported that c-Myb is up-regulated directly by Hoxa9 and Meis1,41 and this was also confirmed in our Hoxa9/Meis1-induced AML (data not shown), indicating that c-Myb is not the target for retroviral insertions in our case. Multiple alternative transcripts of Ahi1 have been detected both in murine and human leukemias,23,40 and the role of such isoforms that lack C-terminal region and/or the SH3 domain in leukemogenesis have been proposed. However, none of these isoforms showed leukemogenic and cooperative activities with Hoxa9/Meis1 (data not shown), suggesting that some additional factors might be required for the Ahi1 function.
Our understanding of a multi-step process in carcinogenesis/leukemogenesis is still limited, however, retroviral tagging using replication-deficient retroviruses and appropriate oncogenic signals will clarify an important genetic event as well as the pathway required for a particular stage of the step. The method has benefits to identify the key factor and to exclude irrelevant bystander mutations that happen due to genomic instability in the later steps of carcinogenesis.
Authorship
Contribution: G.J. designed research, performed research, and wrote the manuscript. Y.Y., M.T., T.T., and K.K. performed research and analyzed data. T.K. and S.M. analyzed data and wrote the manuscript. T.N. designed research and wrote the manuscript.
Conflict-of-interest disclosure: The authors declare no competing financial interests.
Correspondence: Takuro Nakamura, Department of Carcinogenesis, The Cancer Institute, Japanese Foundation for Cancer Research, 3-10-6 Ariake, Koto-ku, Tokyo 135-8550, Japan; e-mail: takuro-ind@umin.net.
The online version of this article contains a data supplement.
An Inside Blood analysis of this article appears at the front of this issue.
The publication costs of this article were defrayed in part by page charge payment. Therefore, and solely to indicate this fact, this article is hereby marked “advertisement” in accordance with 18 USC section 1734.
This work was supported by KAKENHI (Grant-in-Aid for Scientific Research) on Priority Areas “Integrative Research Toward the Conquest of Cancer” from the Ministry of Education, Culture, Sports, Science and Technology of Japan.
We would like to thank Shigeo Sato and Yoshikazu Sugimoto for technical help. We are grateful to Tetsuo Noda for critical comments.

