Abstract
We have identified FOXC1 gene as being over-expressed in more than 50% of AML patients (pts) with normal karyotype when compared to normal hematopoietic cells in microarray analysis. Using RQ-PCR, we validated this finding and assessed the prognostic value, at diagnosis, of FOXC1 expression in a series of 142 adult AML pts (AML0 to AML6) followed at our institution. At diagnosis, pts median age was 62 years. Cytogenetics were available for 136 pts (MRC low-risk n=25 [AML3 n=12, CBF-AML n=13], intermediate-risk n=79, high-risk n=32). NPM1/Flt3ITD status was available for 129 pts (NPM1+/Flt3ITD– n=26, Flt3ITD+ n=18, NPM1–/Flt3ITD– n=85), and WT1 expression for all pts. Ninety-three pts received induction chemotherapy. Allogeneic SCT was performed in 21 pts. PCR results were compared to FOXC1 expression in K562 (100%).
Results: FOXC1 expression level was higher in AML pts (median signal 152%; 25–75th percentiles 32–1036%; range 3–25280%) than in normal blood mononuclear cells (n=10; median signal 16%; 25–75th percentiles 14–26%), marrow cells (n=21; median signal 24%; 25–75th percentiles 16–42%)(p<.001), as well as in cord blood BFU-E, CFU-E, CFU-G /-GM, and mononuclear cells (Signals<25%; p<.001). FOXC1 expression level was lower in AML3 than in other AML (p<.001). Patients with low-risk cytogenetics had a similar profile (p<.001), none belonging to the higher quartile Q4 (p=.001). Conversely, pts with high-risk cytogenetics more frequently belonged to Q4 (p=.025), especially those with monosomy 7 (p=.018). FOXC1 expression level was higher in NPM1+/Flt3ITD– pts than in those with other genotypes (p<.001), and less frequently belonged to Q1 (p=.039). In pts with intermediate-risk cytogenetics (n=78), FOXC1 remained expressed at a higher level in NPM1+/Flt3ITD– pts than in other pts (median signals 440% vs 80%; p<.003).
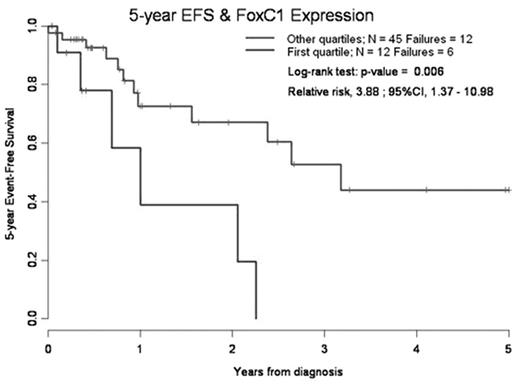
In pts with intermediate-risk cytogenetics receiving induction chemotherapy (n=57), those within Q1 had a worse 5-year survival (0% vs 58%; p=.038 - RR, 3.05; 95%CI, 1.03–9.04) and EFS (0% vs 44%, see Figure), with a higher relapse incidence (66% vs 32%, p<.02) and a lower DFS (34% vs 67%, p<.02) at 5 years from CR1. Induction failures were also more frequent in Q1 (3/12 vs 1/42, p<.03). No usual prognostic factors, such as NPM1/Flt3ITD status, were able to predict the outcome of our pts. Finally, a sequential MRD study showed that FOXC1 expression level correlated to disease evolution after induction or SCT (persisting CR, relapses).
Conclusion: FOXC1 expression level appears to be a useful new prognostic marker in adult AML pts with intermediate-risk cytogenetics.
Main covariates associated with FOXC1expression
| Covariates . | % of patients in Q1 (S<32%) . | Median Signal (% / K562) . | % of patients in Q4 (S>1036%) . |
|---|---|---|---|
| AML3 | 75% | 16% | 0% |
| Other FAB AML | 20% | 205% | 26% |
| Low R KaryoT | 44% | 48% | 0% |
| Interm R KaryoT | 19% | 183% | 25% |
| High R KaryoT | 22% | 295% | 37% |
| Monosomy 7 | 18% | 1258% | 55% |
| Normal KaryoT | 10% | 225% | 31% |
| NPM1+/Flt3ITD– | 8% | 917% | 44% |
| Other genotypes | 28% | 97% | 19% |
Author notes
Disclosure: No relevant conflicts of interest to declare.


