Erythropoietin (EPO's) actions on erythroblasts are ascribed largely to survival effects. Certain studies, however, point to EPO-regulated proliferation. To investigate this problem in a primary system, KitposCD71high erythroblasts were prepared from murine bone marrow, and were first used in the array-based discovery of EPO-modulated cell-cycle regulators. Five cell-cycle progression factors were rapidly up-modulated: nuclear protein 1 (Nupr1), G1 to S phase transition 1 (Gspt1), early growth response 1 (Egr1), Ngfi-A binding protein 2 (Nab2), and cyclin D2. In contrast, inhibitory cyclin G2, p27/Cdkn1b, and B-cell leukemia/lymphoma 6 (Bcl6) were sharply down-modulated. For CYCLIN G2, ectopic expression also proved to selectively attenuate EPO-dependent UT7epo cell-cycle progression at S-phase. As analyzed in primary erythroblasts expressing minimal EPO receptor alleles, EPO repression of cyclin G2 and Bcl6, and induction of cyclin D2, were determined to depend on PY343 (and Stat5) signals. Furthermore, erythroblasts expressing a on PY-null EPOR-HM allele were abnormally distributed in G0/G1. During differentiation divisions, EPOR-HM Ter119pos erythroblasts conversely accumulated in S-phase and faltered in an apparent EPO-directed transition to G0/G1. EPO/EPOR signals therefore control the expression of select cell-cycle regulatory genes that are proposed to modulate stage-specific decisions for erythroblast cell-cycle progression.
Introduction
Through gene disruption experiments,1 erythropoietin (EPO) and its dimeric single transmembrane receptor (EPOR) are known to be essential for erythroblast formation beyond a colony-forming unit–erythroid stage. In these erythroid progenitor cells, the EPOR plays a key survival role2,3 and couples EPO to several antiapoptotic pathways. These include EPOR PY479 coupling to p85alpha PI3-kinase, thymoma viral proto-oncogene 1 (AKT), mammalian target of rapamycin (mTOR), and forkhead box O3a (FOXO3A) signal transduction factors.4,–6 A constitutively active AKT mutant also can rescue Janus kinase 2 (JAK2)–deficient fetal liver erythroblast development,7 and ectopically expressed Bcl-2–like-1 (BCL-XL) can support erythroblast formation in the absence of Stat5 and/or EPO signaling.8 In addition, an EPOR PY343 Stat5 binding site may promote Bcl-xl gene expression,9,10 and recently this cytoplasmic phosphotyrosine site (and associated transduction pathways) have been shown to support stress erythropoiesis.11
Erythroid progenitor cells are also sharply regulated within the contexts of both renewal and differentiation divisions.12 Differentiation divisions occur during late-stage development, and exhibit a shortened G1-phase.13 In such differentiating erythroblasts, E2F transcription factor 4 (E2F4) interestingly has been shown to selectively promote proliferation, and to possibly regulate several cell-cycle–associated genes (eg, Cyclin A2 [Ccna2], minichromosome maintenance deficient 2 mitotin (Mcm2) and proviral insertion Emi 1 [Emi1];).14,15 E2F4-deficient peripheral erythrocytes also are macrocytic, implicating E2F4 effects on size control. Renewal erythroid divisions, in contrast, exhibit more standard cell-cycle properties, and are stimulated during hypoxic stress and anemia.12 The nature of factors that exert primary control over erythroid progenitor renewal divisions, however, is less clear.
Several previous studies (predominantly in cell line models) have suggested that EPO also may modulate erythroid progenitor proliferation, and certain cell-cycle regulators. This includes apparent EPO modulation of cyclin-dependent kinase inhibitor 1B (p27/Cdkn1b), cyclin-dependent kinase inhibitor 1A (p21/Cdkn1a), and/or cyclin-dependent kinase inhibitor 2B (p15/Cdkn2b), cyclin-dependent kinase inhibitor (CDKIs),16,,,–20 as well as cyclin-dependent kinase 2 (Cdk2) and/or cyclin-dependent kinase 4 (Cdk4) plus one (or another) D-type cyclin.16,21,–23 In erythroleukemic J2E and HB60–5 cells, for example, EPO exposure leads to decreased CDK-4 and -6 activity (and increased p27 and/or p15 expression).18,19 In other models, however, EPO appears to inhibit p27 levels and increase one, or another, G1-phase cyclin.16,23 In 32D cells, PI3K inhibitors also have been observed to decrease EPO-dependent S-phase entry and CDK2 activity (but without affecting p27).24 Similar studies performed in UT7, Ba/F3, and 32D cell lines, in contrast, implicate EPO- and PI3K-dependent inhibition of p27 (possibly via EPO regulation of a p27-directed S-phase kinase-associated protein 2 [SKP2] E3 ligase).16 Depending on the model system used, EPO also has been reported to up-modulate myelocytomatosis oncogene (Myc), FBJ osteosarcoma oncogene (Fos), and/or early growth response 1 (Erg1).25,–27 Therefore, several cases exist for possible EPO modulation of cell-cycle regulatory factors, but findings are varied (and/or disparate), and studies in primary cell systems are limited to date.
To provide new insight into roles of EPO as a candidate modulator of the erythroblast cell cycle, array-based profiling of EPO-regulated genes presently has been performed using highly responsive and developmentally staged murine bone marrow–derived KitposCD71high erythroblasts. This work, together with analyses in primary erythroblasts expressing minimal knocked-in EPO-R alleles, reveal rapid and selective EPO modulation of cyclin D2 (Ccnd2); multifold induction of the cell-cycle progression factors G1 to S phase transition 1 (Gspt1),28 nuclear protein 1 (Nupr1),29 Egr1,30 Ngfi-A binding protein 2 (Nab2)31 and Myc; and inhibition of B-cell leukemia/lymphoma 6 (Bcl6), p27, and inhibitory cyclin G2 (Ccng2).32,33 For cyclin D2, cyclin G2, p27, and Bcl6, their regulation further is revealed to depend upon signals relayed via an EPOR PY343 Stat5 binding site. Erythroblasts expressing a PY-null EPOR-HM-F343 allele also are shown to be dysregulated in cell-cycle progression. During renewal divisions, this is realized as an attenuated Epo dose-dependent G1- to S-phase transition. At subsequent Ter119pos stages, EPOR-HM erythroblasts accumulate in S-phase, and falter in an apparent arrest at G0/G1 (in their late differentiation program). EPO's discovered capacity to modulate a discrete set of cell-cycle regulators within defined erythroblast cohorts also is considered within the context of stress erythropoiesis.
Materials and methods
Mice and primary cell culture
Mice expressing knocked-in EPOR-HM and EPOR-H alleles (and congenic controls) were as described11,34 and were analyzed at 8 to 12 weeks. Marrow was flushed (with 21-gauge needles) from bone cavities into Iscoves-modified Dulbecco medium (IMDM) (no. 12440-053; Invitrogen, Carlsbad, CA) plus 2% bovine serum. Cells then were passed through a 40-micrometer cell strainer, exposed to ammonium chloride (no. 07850; Stem Cell Technologies, Vancouver, BC), recovered through 50% bovine serum in phosphate-buffered saline (PBS) (no. 14190; Invitrogen), washed, and cultured (1.5 × 10⁶ cells/mL) in StemPro-34 medium (no. 10640; Invitrogen) containing 2.5 U/mL EPO (Procrit epoetin alfa, no. 59676-302-02; Amgen, Thousand Oaks, CA), 100 ng/mL mouse stem-cell factor (mSCF, no. 250-03; Peprotech Rocky, Hill, NJ), 1 μM dexamethasone, 1 μM beta-estradiol, 75 μg/mL h-transferrin (no. T0665; Sigma, St Louis, MO), 0.5% bovine serum albumin (BSA, no. 09300; Stem Cell Technologies), 0.1 mM 2-mercaptoethanol (β-ME), and 1.5 mM l-glutamine (ie, “SP34-EX” media). At 24 hours of culture, 0.6 volumes of medium were added. At 48 hours, cells were replated in 80% fresh medium plus 20% of residual conditioned medium (1 × 10⁶ cells/mL).
Erythroblast isolation, flow cytometry, and microscopy
Magnetic-activated cell sorting (MACS) involved linpos cell depletion (no. 19756A; Stem Cell Technologies) and Kitpos selection (no. 130-091-224; Miltenyi Biotec, Auburn, CA). In flow cytometry (BD FacsCalibur), washed cells (1 × 10⁶ per 0.2 mL PBS, 0.1% BSA) were incubated for 15 minutes with rat IgG (1 μg), and for 45 minutes with 1 μg allophycocyanin (APC)–CD117, phycoerythrin (PE)–Ter119, and/or fluorescein (FITC)–CD71 (BD Biosciences, San Jose, CA). For cytospin preparations (1 × 10⁵ cells), slide centrifugation was at 100g for 15 minutes (Hettich AG, Bach, Germany), and staining was with Stat Stain (no. VSS-016; Volu-sol, Salt Lake City, UT).
Proliferation and cell-cycle assays
In bromodeoxyuridine (BrdU) incorporation assays, erythroid progenitor cells were incubated with BrdU (10 μM, no. 51-2354AK; BD Biosciences) and EPO at the concentrations and intervals indicated. Incorporation was analyzed by flow cytometry. Cell-cycle analysis also used Draq5 viable staining (5 μM, BOS-889-002; Biostatus, Shepshed, United Kingdom), PE-Ter119, and/or FITC-CD117 (BD Biosciences). Distributions were analyzed with Modfit (Verity Software, Topsham, ME). In 3H-deoxythymidine (3HdT) incorporation assays, expanded erythroblasts were plated in SCF-deficient SP34-EX medium (1 × 10⁵ cells/mL) with EPO as indicated. At 20 hours, 1 μCi (0.037 MBq) 3HdT was added, and at 25 hours, incorporation rates were determined.
Gene profiling and RT-PCR
Isolated KitposCD71high erythroblasts were cultured at 8 × 10⁵ cells/mL for 6 hours in IMDM, 0.5% BSA, 25 ng/mL insulin, 50 μg/mL transferrin, 0.1 mM β-ME. Cells then were exposed to EPO (± 5 U/mL) for 90 minutes. RNA was isolated using Trizol (Invitrogen) reagent and an Autogen (Holliston, MA) Prep-245 system. For single-step biotin-cRNA syntheses, 4 μg RNA was used. Hybridizations were to Affymetrix 430 2.0 arrays (Santa Clara, CA). Primary data were collected using a GeneChip Scanner 3000 and GCOS software (Affymetrix). GeneTraffic (Iobion, La Jolla, CA), exploratory visual analysis (EVA), ChipInspector (Genomatix, München, Germany), and BiblioSphere Pathway-Edition software (Genomatix) were used for data mining. In reverse transcription (RT), RNA was treated with TURBO deoxyribonuclease (DNase) (no. 1907; Ambion, Austin, TX), and was reverse transcribed using Superscript III (no. 18080-051; Invitrogen). Polymerase chain reaction (PCR) primer pairs were from SuperArray Bioscience (Frederick, MD), as follows: Cyclin D1, NM_007631; Cyclin D2, NM_009829; Cyclin G2, NM_007635; Gspt1, NM_007393; Nab2, NM_008668; Egr1, NM_007913; Nupr1, NM_019738; Myc, BC006728; p27, NM_009875; Bcl6, NM_009744; beta-actin, NM_007393. Quantitative PCR used iQ SYBR Green and an i-Cycler (BIO-RAD, Hercules, CA).
Cell lines, retrovirus constructs, and Western blotting
UT7epo and G1E/JC4 cell lines were maintained as previously described.35,36 For CYCLIN G2 expression, pBabepuro and MIEG3 vectors were used with a Cyclin G2 cDNA37 cloned at SalI and EcoRI sites, respectively. Transductions used polybrene (8 μg/mL)– and retronectin-coated plates (no. T110A; TaKaRa, Kyoto, Japan). Transduced populations were isolated by puromycin selection (2 μg/mL) or fluorescence-activated cell sorting (FACS) (GFP-positive JC4 cells). JC4 cell differentiation was induced using beta-estradiol. Enhanced chemiluminescence (ECL)–based Western blotting was as described previously.38 In analyses of apoptosis and viability, annexin-V, propidium iodide, and/or trypan blue assays (ViCell system; Coulter, Hialeah, FL) were used.
Results
Primary marrow erythroblast preparations, EPO proliferative responsiveness, and array-based discovery of EPO-modulated cell-cycle regulatory genes
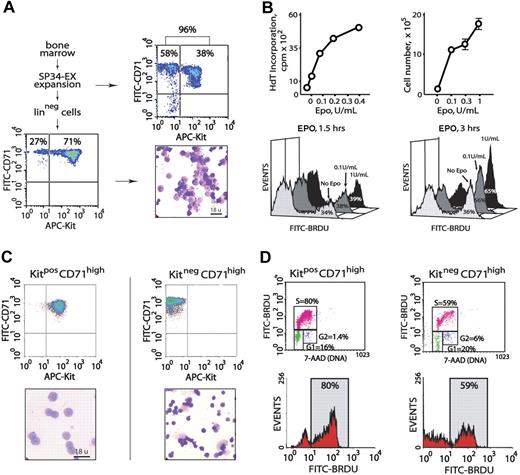
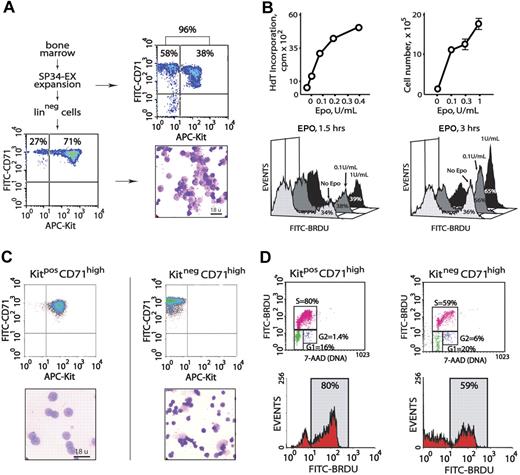
Initial experiments served to characterize primary erythroblast populations as propagated from murine bone marrow, as well as their proliferative responsiveness to EPO. In serum-free SP34-EX medium in the presence of EPO and SCF (and under optimized conditions), the short-term culture of marrow cell preparations generated 90% or more CD71high erythroid progenitor cells (Figure 1A top panels). Approximately 40% of these progenitors were early-stage KitposCD71high erythroblasts. Linpos cell depletion of nonerythroid cells (∼ 10% of total) and Ter119pos erythroblasts (which displayed comparably limited EPO responsiveness, data not shown) routinely yielded 70% or more KitposCD71high erythroblasts with the balance as derived KitnegCD71high cells (Figure 1A bottom panels). In 3HdT-incorporation assays, and in direct cell-count experiments, this erythroblast population proliferated efficiently in response to EPO at low doses (0.1 U/mL, and maximally so at 1.0 U/mL). In BrdU incorporation experiments, similar outcomes were observed (Figure 1B).
Isolation of primary bone marrow–derived erythroblasts and EPO dose-dependent proliferation. (A) Erythroid progenitor cells from wild-type marrow were cultured in serum-free SP34-EX medium in the presence of EPO and SCF. At day 3.5, 90% or more of total cells were represented by CD71high erythroid progenitors (top panels). Linpos depletion increased this representation to 98%, including 71% early-stage KitposCD71high cells (bottom panels). (B) For the Linpos-depleted erythroblasts represented in panel A, the capacities of low-dose EPO to promote 3HdT incorporation and increases in cell numbers were defined. EPO dose-dependent formation of BrdU-positive cells also was assessed in short-term labeling experiments (ie, 1.5 and 3 hours). (C) Bone marrow progenitor cells were expanded for 3.5 days in SP34-EX medium. KitposCD71high and KitnegCD71high cells were then isolated by MACS and analyzed in cytospin preparations. (D) These 2 discrete erythroblast populations were incubated for 5 hours in the absence of hematopoietic cytokines prior to culture in the presence of BrdU and EPO at 0.1 or 1.0 U/mL. At 2 hours, BrdU incorporation levels were assayed. Cells also were costained with 7-AAD to facilitate estimations of cell-cycle phase distributions. Note the increased representation of KitposCD71high cells in S-phase (80%).
Isolation of primary bone marrow–derived erythroblasts and EPO dose-dependent proliferation. (A) Erythroid progenitor cells from wild-type marrow were cultured in serum-free SP34-EX medium in the presence of EPO and SCF. At day 3.5, 90% or more of total cells were represented by CD71high erythroid progenitors (top panels). Linpos depletion increased this representation to 98%, including 71% early-stage KitposCD71high cells (bottom panels). (B) For the Linpos-depleted erythroblasts represented in panel A, the capacities of low-dose EPO to promote 3HdT incorporation and increases in cell numbers were defined. EPO dose-dependent formation of BrdU-positive cells also was assessed in short-term labeling experiments (ie, 1.5 and 3 hours). (C) Bone marrow progenitor cells were expanded for 3.5 days in SP34-EX medium. KitposCD71high and KitnegCD71high cells were then isolated by MACS and analyzed in cytospin preparations. (D) These 2 discrete erythroblast populations were incubated for 5 hours in the absence of hematopoietic cytokines prior to culture in the presence of BrdU and EPO at 0.1 or 1.0 U/mL. At 2 hours, BrdU incorporation levels were assayed. Cells also were costained with 7-AAD to facilitate estimations of cell-cycle phase distributions. Note the increased representation of KitposCD71high cells in S-phase (80%).
To define and generate a uniform, maximally EPO-responsive erythroblast cohort (in part, toward gene-profiling experiments), KitposCD71highTer119neg and KitnegCD71highTer119neg subpopulations next were isolated, analyzed morphologically, and compared directly in EPO dose-dependent BrdU incorporation assays. Each subpopulation was isolated (by MACS) at 99% or higher purity (Figure 1C top panels). As examined in cytospin preparations (Figure 1C bottom panels), KitposCD71high cells were proerythroblastic with approximately 14-μm diameters, while KitnegCD71high cells were primarily basophilic or polychromatophilic erythroblasts with approximately 10-μm diameters. In EPO dosing and BrdU incorporation experiments, KitposCD71high cells proved to be significantly more responsive than KitnegCD71high erythroblasts, and EPO exposure advanced KitposCD71high erythroblasts into S-phase at increased frequencies (Figure 1D). Subsequent analyses of EPO responses (including gene profiling and analyses) therefore used primarily this proerythroblast population.
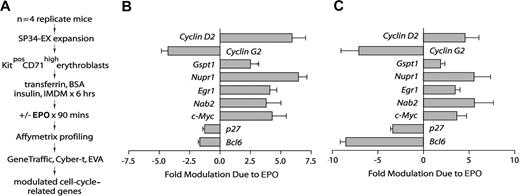
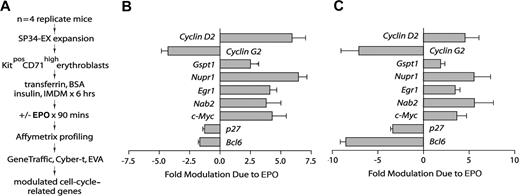
To investigate EPO-regulated genes in the marrow-derived erythroblasts (Figure 1), especially within a functional category of cell-cycle regulatory genes, transcriptomes were profiled next. Specifically, KitposCD71high erythroblasts from n = 4 independent mouse bone marrow preparations were expanded and purified. Each population was then subdivided, cultured for 5.5 hours in the absence of hematopoietic cytokines, and exposed to EPO (± 5 U/mL). A 90-minute exposure time was used based on outcome of RT-PCR time-course analyses for select known EPO target genes (see Menon et al,11 and Figure S1C, available on the Blood website; see the Supplemental Materials link at the top of the online article). RNA was isolated directly, biotin-cRNA was prepared, and Affymetrix 430–2.0 array hybridizations were performed (in quadruplicate) for EPO-exposed and control cells (Figure 2A). Significance testing (eg, Student t test) indicated the occurrence of more than 200 EPO-modulated genes. Nine such EPO-regulated genes proved to be cell-cycle–associated factors that were multifold regulated by EPO (Figure 2B): cyclin D2, cyclin G2, Gspt1, Nupr1, Egr1, Nab2, Myc, p27, and Bcl6. In independent analyses, quantitative RT-PCR was applied to confirm outcomes for each factor (Figure 2C). In addition, for the majority of this functional subset of EPO-response genes, independent time-course experiments were performed, which in addition used comparably low-dose EPO (1 U/mL) (Figure S1).
Affymetrix array–based discovery of cell-cycle–associated EPO response genes in bone marrow–derived KitposCD71high erythroblasts. (A) Basic steps involved in the discovery of EPO-modulated cell-cycle regulatory genes. Erythroblasts were expanded from the bone marrow of n = 4 replicate mice. For each preparation, purified KitposCD71high cells were subdivided and cultured for 6 hours in the absence of hematopoietic cytokines. Erythroblasts were then exposed to EPO (± 5 U/mL) for 90 minutes and RNA was isolated directly. Biotin-cRNA next was prepared and was used in Affymetrix 430–2.0 array profiling. Transcripts for cell-cycle–associated genes that were modulated approximately 2-fold or more by EPO (with high statistical significance) were then considered. (B) For replicate Affymetrix array data sets, and as analyzed quantitatively (mean modulation due to EPO ± SD), EPO proved to significantly modulate 9 cell-cycle–related genes: Cyclin-D2/Ccnd2, Cyclin-G2/Ccng2, Gspt1, Nupr1, Egr1, Nab2, Myc, p27/Cdkn1b, and Bcl6. (C) In quantitative RT-PCR analyses, EPO regulation of each of the EPO-modulated cell-cycle regulatory genes was confirmed. Values are means and SD for samples (and erythroblasts) from n = 3 mice.
Affymetrix array–based discovery of cell-cycle–associated EPO response genes in bone marrow–derived KitposCD71high erythroblasts. (A) Basic steps involved in the discovery of EPO-modulated cell-cycle regulatory genes. Erythroblasts were expanded from the bone marrow of n = 4 replicate mice. For each preparation, purified KitposCD71high cells were subdivided and cultured for 6 hours in the absence of hematopoietic cytokines. Erythroblasts were then exposed to EPO (± 5 U/mL) for 90 minutes and RNA was isolated directly. Biotin-cRNA next was prepared and was used in Affymetrix 430–2.0 array profiling. Transcripts for cell-cycle–associated genes that were modulated approximately 2-fold or more by EPO (with high statistical significance) were then considered. (B) For replicate Affymetrix array data sets, and as analyzed quantitatively (mean modulation due to EPO ± SD), EPO proved to significantly modulate 9 cell-cycle–related genes: Cyclin-D2/Ccnd2, Cyclin-G2/Ccng2, Gspt1, Nupr1, Egr1, Nab2, Myc, p27/Cdkn1b, and Bcl6. (C) In quantitative RT-PCR analyses, EPO regulation of each of the EPO-modulated cell-cycle regulatory genes was confirmed. Values are means and SD for samples (and erythroblasts) from n = 3 mice.
For Egr1, Nab2, Gspt1, and Nupr1, each has been implicated in other tissues and systems to regulate G1- to S-phase progression.27,–29,39,,–42 However, only Egr1 has previously been associated with EPO action.27,40 As a zinc finger transcription factor that is subject to extracellular regulated kinase 1/2 (ERK1/2) activation, EGR1 can itself enhance both D2 cyclin43 and Nab2 expression.41,44 NAB2 interestingly can then act as an EGR1 repressor, and can affect not only cell growth, but also terminal differentiation (eg, of Schwann cells).31 NUPR1 is a high-mobility group (HMG) transcription factor that can modulate Cdk2 and Cdk4, and decrease p27 expression.29 Its comparably strong induction by EPO (≥ 5-fold) similarly suggests reinforcement of a program of cell-cycle entry. Myc induction by EPO, by comparison, has been consistently observed in several cell line models,25,45 and was an expected outcome. EPO also down-modulated 2 additional inhibitory cell-cycle factors several-fold, p27 and Bcl6. P27 is a CKI that competes with D-type CYCLINS for CDK-4 and -6 binding.46 BCL6, by comparison, is a transcriptional repressor that can inhibit cyclin D2 and Myc33 —its down-modulation by EPO therefore may reinforce Cyclin D2 and Myc production.
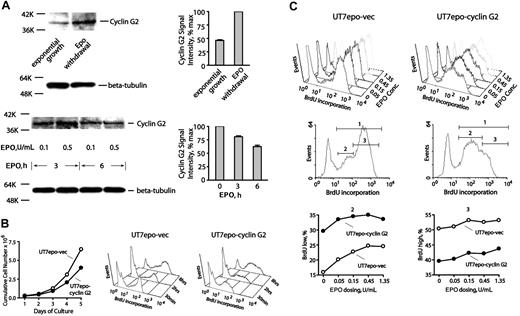
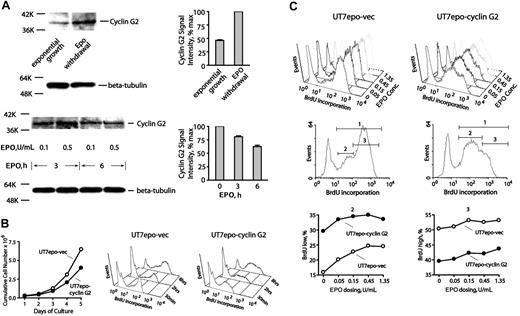
For cyclins, profiling indicated low and moderate expression levels for D1 and D3 cyclins, respectively, but neither was EPO modulated (data not shown). In contrast, cyclin D2 was selectively up-modulated approximately 5-fold, while cyclin G2 (an inhibitory cyclin)47,48 was down-modulated 5-fold or more. Cyclin G2 has not previously been described as an EPO-regulated factor (or in an erythroid context), but its expression has been associated with neuronal differentiation.47 CYCLIN G2 therefore was chosen for follow-up experiments at the protein and functional levels. In primary KitposCD71high erythroblasts, CYCLIN G2 expression was first observed to increase upon EPO withdrawal, and to be inhibited upon EPO re-exposure (Figure 3A). Second, ectopic expression of CYCLIN G2 in Epo-dependent UT7epo cells was observed to restrict proliferative potential (Figure 3B). Quantitative BrdU experiments further revealed that in UT7epo-Cyclin G2 cells, S-phase progression is attenuated (compared directly to UT7epo cells transduced with a control empty vector) (also see Figure S2A). This indicates specific S-phase inhibition by CYCLIN G2. These outcomes support the notion that Epo inhibition of CYCLIN G2 may enhance DNA replication and sustain erythroblast proliferation. Third, possible effects of CYCLIN G2 expression on late-stage differentiation also were assessed using G1E/JC4 cells (which differentiate upon activation of a GATA1/estrogen receptor [ER] fusion construct).36 In this context, CYCLIN G2 was observed to enhance GATA1-dependent formation of Ter119pos erythroblasts (Figure S3). Outcomes therefore are consistent with a newly defined role as an S-phase–specific cell-cycle inhibitory factor. In UT7epo and JC4 cells, no significant effects of CYCLIN G2 on cell survival were detected in repeated quantitative apoptosis assays (Figure S2B).
CYCLIN G2 protein levels are down-modulated by EPO, and ectopically expressed CYCLIN G2 attenuates UT7epo cell growth and S-phase transition. (A) EPO down-modulation of CYCLIN G2 protein expression. In primary wt-EPOR erythroblasts, EPO's effects on CYCLIN G2 expression levels were assayed by Western blotting, and first were observed to increase 2-fold or more within 6 hours of EPO withdrawal (top subpanels). In addition, EPO expression (in time-course and EPO concentration experiments) was observed to decrease CYCLIN G2 levels (bottom subpanels). Error bars represent standard deviations from the mean for duplicate scans of two ECL exposures (and are normalized for beta-tubulin). (B) Ectopic expression of CYCLIN G2 attenuates proliferation and G1- to S-phase transition in EPO-dependent UT7epo cells. UT7epo cells were transduced with a pBABEpuro-CYCLIN G2 retrovirus (or empty control vector) and were selected in puromycin. Derived lines (UT7epo CYCLIN G2 and UT7epo-vec) then were analyzed for EPO-dependent proliferative capacities and BrdU incorporation profiles. Ectopic expression of CYCLIN G2 first was observed to attenuate EPO-dependent UT7epo cell growth. Here, the cell lines were plated in the presence of EPO at 1 U/mL. Through time, viable cell numbers were monitored. Data shown are representative of 2 independent experiments. Subsequently, time-course analyses of EPO-dependent BrdU incorporation in UT7epo CYCLIN G2 and UT7epo-vec cells were performed. EPO was withdrawn from cultures for a 16-hour period prior to restimulation with EPO (1 U/mL) in the presence of BrdU. At the indicated time points, levels of BrdU incorporation were determined (top right subpanels). (C) Finally, EPO dose–dependent profiles of BrdU incorporation in UT7epo CYCLIN G2 and UT7epo-vec cells were investigated. Here, BrdU experiments were performed but with varying concentrations of EPO exposure. Panels first show raw data for incorporation levels. Bottom panels set gates for low versus high BrdU incorporation populations (gates 2 and 3, respectively), and further illustrate differences in BrdU incorporation profiles for gate 2 and 3 subpopulations for UT7epo CYCLIN G2 and UT7epo-vec cells.
CYCLIN G2 protein levels are down-modulated by EPO, and ectopically expressed CYCLIN G2 attenuates UT7epo cell growth and S-phase transition. (A) EPO down-modulation of CYCLIN G2 protein expression. In primary wt-EPOR erythroblasts, EPO's effects on CYCLIN G2 expression levels were assayed by Western blotting, and first were observed to increase 2-fold or more within 6 hours of EPO withdrawal (top subpanels). In addition, EPO expression (in time-course and EPO concentration experiments) was observed to decrease CYCLIN G2 levels (bottom subpanels). Error bars represent standard deviations from the mean for duplicate scans of two ECL exposures (and are normalized for beta-tubulin). (B) Ectopic expression of CYCLIN G2 attenuates proliferation and G1- to S-phase transition in EPO-dependent UT7epo cells. UT7epo cells were transduced with a pBABEpuro-CYCLIN G2 retrovirus (or empty control vector) and were selected in puromycin. Derived lines (UT7epo CYCLIN G2 and UT7epo-vec) then were analyzed for EPO-dependent proliferative capacities and BrdU incorporation profiles. Ectopic expression of CYCLIN G2 first was observed to attenuate EPO-dependent UT7epo cell growth. Here, the cell lines were plated in the presence of EPO at 1 U/mL. Through time, viable cell numbers were monitored. Data shown are representative of 2 independent experiments. Subsequently, time-course analyses of EPO-dependent BrdU incorporation in UT7epo CYCLIN G2 and UT7epo-vec cells were performed. EPO was withdrawn from cultures for a 16-hour period prior to restimulation with EPO (1 U/mL) in the presence of BrdU. At the indicated time points, levels of BrdU incorporation were determined (top right subpanels). (C) Finally, EPO dose–dependent profiles of BrdU incorporation in UT7epo CYCLIN G2 and UT7epo-vec cells were investigated. Here, BrdU experiments were performed but with varying concentrations of EPO exposure. Panels first show raw data for incorporation levels. Bottom panels set gates for low versus high BrdU incorporation populations (gates 2 and 3, respectively), and further illustrate differences in BrdU incorporation profiles for gate 2 and 3 subpopulations for UT7epo CYCLIN G2 and UT7epo-vec cells.
EPOR subdomains that mediate EPO modulation of cell-cycle regulatory genes
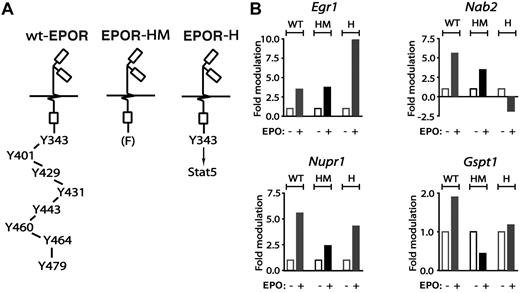
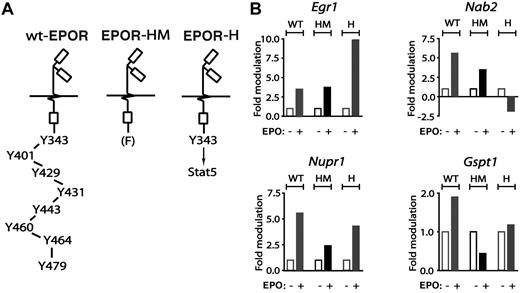
Primary erythroblasts from mice expressing knocked-in minimal EPOR alleles next were used to dissect EPOR subdomain–dependent pathways to cell-cycle regulatory genes. This included a truncated PY-null EPOR-HM allele that supports steady-state but not stress erythropoiesis,11 and a related EPOR-H allele in which a PY343 Stat5 binding site is selectively restored (Figure 4A). For Egr1 and Nab2, regulation by EPOR-HM (FY343) and EPOR-H (PY343) receptor alleles first were analyzed (Figure 4B top subpanels). For Nab2, and in KitposCD71high erythroblasts, EPO induction was diminished for EPOR-HM but interestingly was inhibited via EPOR-H. Egr1 induction, in contrast, was retained via EPOR-HM but substantially elevated for EPOR-H. These outcomes therefore might involve a loss of EPOR C-terminal inhibitory domains in the case of Egr1, and possible PY343 (and Stat5)–dependent inhibitory effects for Nab2. For Nupr1 and Gspt1, deletion of 7 of 8 cytoplasmic PY sites in EPOR-H blunted induction as mediated by the wt-EPOR (Figure 4B bottom subpanels). EPO-dependent induction of each of these factors (and especially Nupr1) was further diminished via EPOR-HM, indicating positive roles for PY343 as well as distal EPOR domains.
EPO regulation of Egr1, Nab2, Nupr1, and Gspt1 via EPOR-H and EPOR-HM alleles. From wt-EPOR, EPOR-HM, and EPOR-H SP34-EX expanded marrow cell preparations, KitposCD71high erythroblasts were isolated, washed, and plated in IMDM, 0.25% BSA, 25 ng/mL insulin, and 100 μg/mL transferrin. At 5.5 hours, cells were exposed to EPO (± 5 U/mL). At 90 minutes, RNA was isolated and was reverse transcribed. (A) Schematics of knocked-in minimal EPO receptor EPOR-HM and EPOR-H alleles. EPOR-HM is a PY-null allele, while EPOR-H selectively retains a PY343 Stat5 binding site. (B) For each erythroblast preparation, and EPOR allele, levels of EPO-modulated Erg1, Nab2, Nupr1, and Gspt1 transcripts were determined by quantitative PCR.
EPO regulation of Egr1, Nab2, Nupr1, and Gspt1 via EPOR-H and EPOR-HM alleles. From wt-EPOR, EPOR-HM, and EPOR-H SP34-EX expanded marrow cell preparations, KitposCD71high erythroblasts were isolated, washed, and plated in IMDM, 0.25% BSA, 25 ng/mL insulin, and 100 μg/mL transferrin. At 5.5 hours, cells were exposed to EPO (± 5 U/mL). At 90 minutes, RNA was isolated and was reverse transcribed. (A) Schematics of knocked-in minimal EPO receptor EPOR-HM and EPOR-H alleles. EPOR-HM is a PY-null allele, while EPOR-H selectively retains a PY343 Stat5 binding site. (B) For each erythroblast preparation, and EPOR allele, levels of EPO-modulated Erg1, Nab2, Nupr1, and Gspt1 transcripts were determined by quantitative PCR.
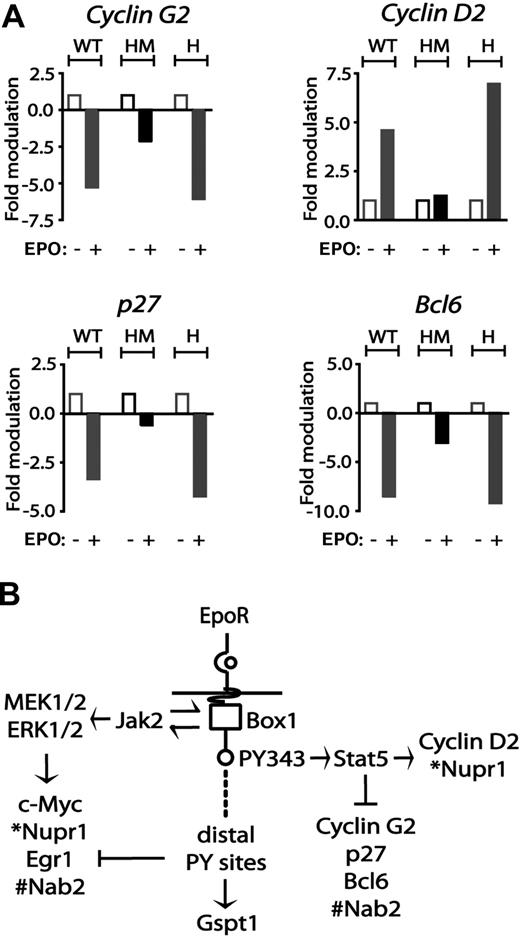
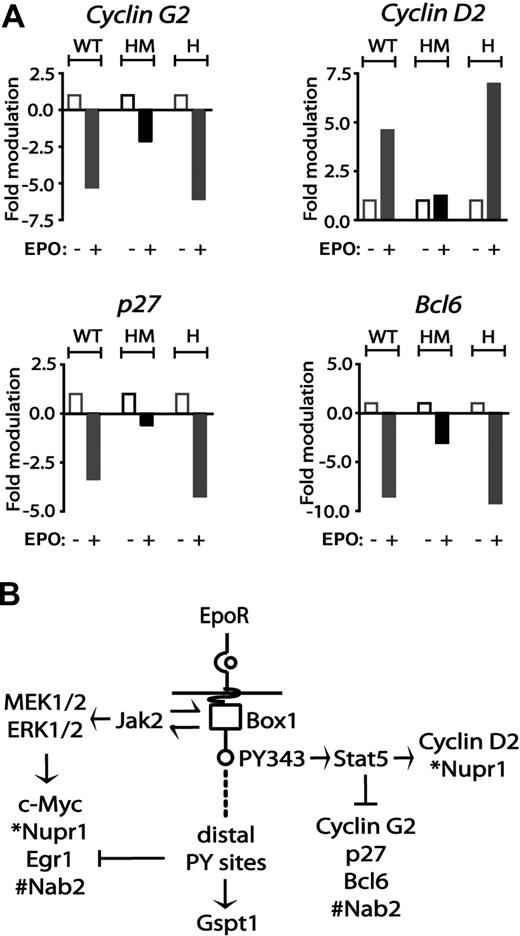
With regard to cyclins, EPO induction of cyclin D2 proved to be enhanced in EPOR-H erythroblasts but was essentially blocked for the F343 point-mutated allele EPOR-HM (Figure 5A). EPO-mediated repression of cyclin G2 expression was likewise largely lost for EPOR-HM, but was restored for EPOR-H, a result that indicates roles for PY343 (and Stat5) in cyclin G2 repression. Interestingly, EPO's marked inhibitory effects on p27 and Bcl6 expression likewise proved to depend on EPOR PY343 signals (Figure 5A). Specifically, EPO modulation of p27 and Bcl6 was decreased to low-level inhibition in EPOR-HM, while restoration of PY343 in EPOR-H efficiently restored inhibition by EPO.
EPO regulation of cyclin G2, cyclin D2, p27, and Bcl6 via minimal EPOR-H and EPOR-HM alleles. (A) EPO up-modulation of cyclin D2 and down-modulation of cyclin G2 depend on EPOR PY343 signals. KitposCD71high cells were prepared from wt-EPOR, EPOR-HM, and EPOR-H erythroblasts. Hematopoietic cytokines were withdrawn for 5.5 hours. Cells then were exposed to EPO (5 U/mL). At 90 minutes, RNA was isolated, and reverse transcribed. Cyclin D2, Cyclin G2, Cdkn1b, and Bcl6 transcript levels then were determined by quantitative PCR. Values are the means (± SD) of n = 3 independent samples. (B) Observed EPO modulation of cell-cycle regulatory genes via wt-EPOR, EPOR-HM, and EPOR-H alleles provided for a mapping of transcriptional circuits to key EPOR subdomains including an EPOR box1-plus-JAK2 pathway to Myc, Nupr1, Egr1, and Nab2; an EPOR/PY343/STAT5 pathway to Cyclin D2 and Nupr1 expression, and Cyclin G2, Cdkn1b, and Bcl6 and Nab2 repression; and EPOR distal domain effects on Gspt1 induction.
EPO regulation of cyclin G2, cyclin D2, p27, and Bcl6 via minimal EPOR-H and EPOR-HM alleles. (A) EPO up-modulation of cyclin D2 and down-modulation of cyclin G2 depend on EPOR PY343 signals. KitposCD71high cells were prepared from wt-EPOR, EPOR-HM, and EPOR-H erythroblasts. Hematopoietic cytokines were withdrawn for 5.5 hours. Cells then were exposed to EPO (5 U/mL). At 90 minutes, RNA was isolated, and reverse transcribed. Cyclin D2, Cyclin G2, Cdkn1b, and Bcl6 transcript levels then were determined by quantitative PCR. Values are the means (± SD) of n = 3 independent samples. (B) Observed EPO modulation of cell-cycle regulatory genes via wt-EPOR, EPOR-HM, and EPOR-H alleles provided for a mapping of transcriptional circuits to key EPOR subdomains including an EPOR box1-plus-JAK2 pathway to Myc, Nupr1, Egr1, and Nab2; an EPOR/PY343/STAT5 pathway to Cyclin D2 and Nupr1 expression, and Cyclin G2, Cdkn1b, and Bcl6 and Nab2 repression; and EPOR distal domain effects on Gspt1 induction.
Based on the above analyses of EPO-modulated cell-cycle regulatory factors, and of cell-cycle parameters for erythroblasts with knocked-in EPOR alleles, an overall model for EPOR-mediated pathways was developed (Figure 5B). This depicts (1) EPOR plus “JAK2-only” pathways to Egr1, Nab2, and Myc induction; (2) EPOR-PY343 (and Stat5)–dependent cyclin D2 induction, and cyclin G2, Bcl6, and p27 repression; and (3) stimulatory and inhibitory effects on Gspt1 and Egr1, respectively, as exerted by EPOR distal domains.
Cell-cycle phase dysregulation in primary EPOR-HM erythroblasts
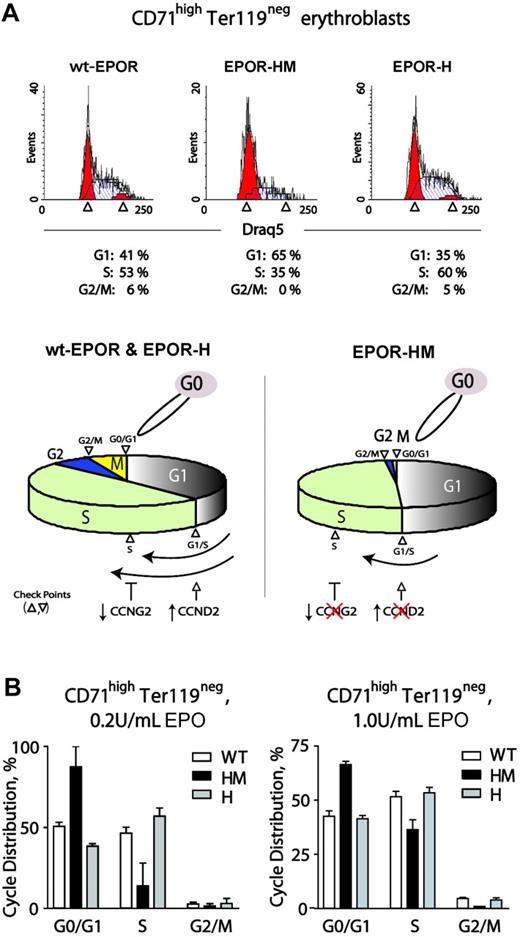
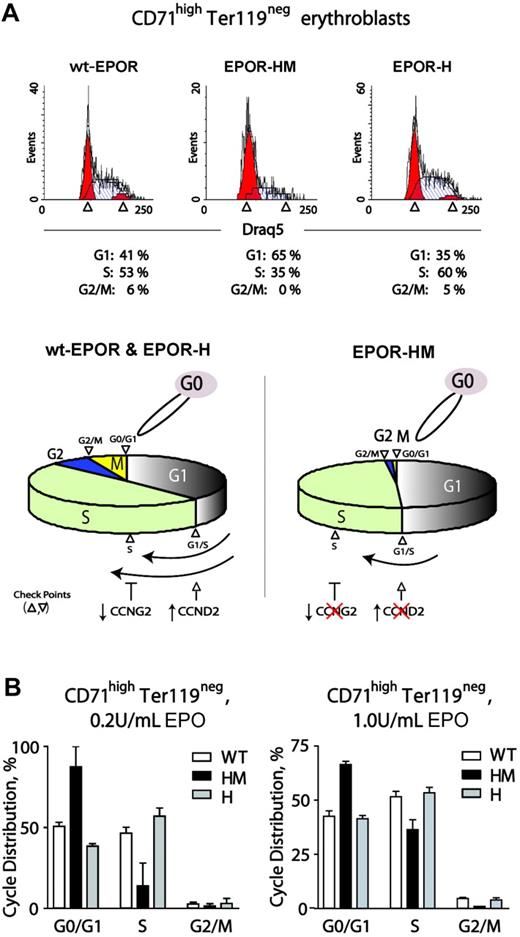
Observed alterations in cell-cycle factor modulation via an EPOR-HM allele prompted analyses of cell-cycle phase distributions first during renewal divisions in expanded wt-EPOR, EPOR-H, and EPOR-HM CD71highTer119neg erythroblasts. Erythroid progenitor cells were expanded from wt-EPOR, EPOR-HM, and EPOR-H bone marrow preparations in SP34-EX medium. At day 2.5, cells were washed and returned to culture in the presence of EPO (2.5 U/mL). At 24 hours, cell-cycle phase distributions were determined (Figure 6A). Interestingly, EPOR-HM CD71highTer119neg erythroblasts exhibited marked defects in cell-cycle progression. In particular, this involved inhibition of G1- to S-phase transition, decreased S-phase progression, and limited S-phase to G2/M transition (and EPOR-HM erythroblasts tended to accumulate in G0/G1). These defects, however, were reversed upon PY343 site restoration in EPOR-H cells. Using the above approach, effects of varied EPO dosing on this EPOR-HM–specific cell-cycle defect also were studied. At 0.2 U/mL EPO, S-phase representation remained low, and G0/G1 was overrepresented for EPOR-HM erythroblasts (Figure 6B left panel). At comparably high Epo dosage (1 U/mL), the S-phase defect was lessened, but G0/G1-phase cells remained overrepresented compared with wild-type and EPOR-H erythroblasts (Figure 6B right panels). As outlined (bottom panel), this outcome is consistent with roles for EPOR PY343–dependent Cyclin D2 induction and Cyclin G2 repression. It also is noted that defects in EPOR-HM erythroblast survival are exhibited only at low EPO concentrations and ameliorated by EPO dosing in this system at 0.2 to 0.4 U/mL.11,49
EPO dose-dependent delays in EPOR-HM erythroblast cell-cycle progression. (A) Defective EPO-dependent cell-cycle progression among EPOR-HM erythroblasts. Erythroid progenitor cells from wt-EPOR, EPOR-HM, and EPOR-H marrow preparations were expanded in SP34-EX. At day 2, erythroblasts were washed and returned to culture in the absence of SCF and presence of EPO at 0.2 U/mL or 1.0 U/mL. At 24 hours, cell-cycle distributions for CD71highTer119neg erythroblasts were determined. Values are means (± SD) for n = 3 independent cultures (from n = 3 mice for EPOR alleles). In lower subpanels, cell-cycle distributions are summarized for wt-EPOR versus EPOR-HM versus EPOR-H. (B) Representative primary data for cycle distributions also are shown for wt-EPOR, EPOR-HM, and EPOR-H erythroblasts.
EPO dose-dependent delays in EPOR-HM erythroblast cell-cycle progression. (A) Defective EPO-dependent cell-cycle progression among EPOR-HM erythroblasts. Erythroid progenitor cells from wt-EPOR, EPOR-HM, and EPOR-H marrow preparations were expanded in SP34-EX. At day 2, erythroblasts were washed and returned to culture in the absence of SCF and presence of EPO at 0.2 U/mL or 1.0 U/mL. At 24 hours, cell-cycle distributions for CD71highTer119neg erythroblasts were determined. Values are means (± SD) for n = 3 independent cultures (from n = 3 mice for EPOR alleles). In lower subpanels, cell-cycle distributions are summarized for wt-EPOR versus EPOR-HM versus EPOR-H. (B) Representative primary data for cycle distributions also are shown for wt-EPOR, EPOR-HM, and EPOR-H erythroblasts.
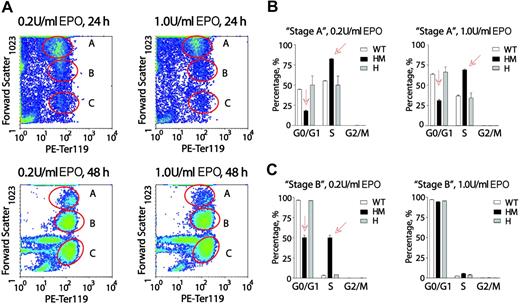
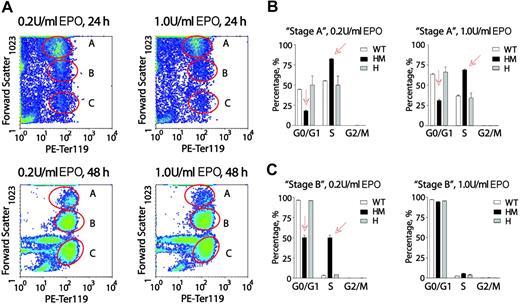
Next, EPO dose-dependent cell-cycle distributions of wt-EPOR, EPOR-HM, and EPOR-H erythroblasts were analyzed at later Ter119pos stages of development. Conditions of culture were as above in that erythroid progenitors from SP34-EX cultures were washed and returned to culture in the absence of SCF and presence of EPO at 0.2 or 1.0 U/mL. Among Ter119pos cells, and at 24 and 48 hours, 3 distinct subpopulations were defined based on forward-angle light scatter (FALS) (Figure 7A). These are designated as A, B, and C. Subpopulation C was negative for Draq5, corresponded to early-stage reticulocytes by morphologic inspection, and was not studied further. In stage-A Ter119pos wt-EPOR erythroblasts, increased EPO dosing interestingly proved to somewhat decrease frequencies of S-phase cells, and increase G0/G1-phase erythroblasts (Figure 7B). In particular, dosing at 1.0 U/mL (vs 0.2 U/mL) decreased S-phase representation from 55.3% to 44.7% and increased G0/G1 representation from 36.6% to 63.4%. This somewhat unexpected Epo effect was also clearly observed for stage-A EPOR-H Ter119pos erythroblasts. EPOR-HM erythroblasts, however, were overrepresented in S-phase, and underrepresented in G0/G1. Increased EPO dosing lessened, but did not reverse, this defect.
At a late Ter119pos stage, EPOR-HM erythroblasts falter in an apparent EPO dose-dependent G0/G1-phase accumulation. (A) Erythroblasts from marrow preparations were expanded in SP34-EX for 2.5 days, washed, and returned to culture in the absence of SCF and presence of EPO at 0.2 U/mL or 1.0 U/mL. At 24 and 48 hours, erythroblasts were analyzed for Ter119 expression and forward-angle light scatter (data shown are for wt-EPOR erythroblasts). Based on FALS, 3 subpopulations were resolved and are designated A, B, and C. (B,C) For preparations from wt-EPOR, EPOR-HM, and EPOR-H marrow, cell-cycle distributions were determined for Ter119pos stage-A erythroblasts (panel B) and Ter119pos stage-B erythroblasts (panel C). Values are means (± SD) for n = 3 independent cultures (from n = 3 mice for EPOR alleles).
At a late Ter119pos stage, EPOR-HM erythroblasts falter in an apparent EPO dose-dependent G0/G1-phase accumulation. (A) Erythroblasts from marrow preparations were expanded in SP34-EX for 2.5 days, washed, and returned to culture in the absence of SCF and presence of EPO at 0.2 U/mL or 1.0 U/mL. At 24 and 48 hours, erythroblasts were analyzed for Ter119 expression and forward-angle light scatter (data shown are for wt-EPOR erythroblasts). Based on FALS, 3 subpopulations were resolved and are designated A, B, and C. (B,C) For preparations from wt-EPOR, EPOR-HM, and EPOR-H marrow, cell-cycle distributions were determined for Ter119pos stage-A erythroblasts (panel B) and Ter119pos stage-B erythroblasts (panel C). Values are means (± SD) for n = 3 independent cultures (from n = 3 mice for EPOR alleles).
Among stage-B Ter119pos erythroblasts, 90% of wt-EPOR and EPOR-H cells were distributed in G0/G1, and this was largely independent of EPO dosing (Figure 7C). Among EPOR-HM erythroblasts, however, approximately 50% remained in S-phase. This apparently delayed entry to G0/G1 furthermore was reversed by increasing EPO from 0.2 U/mL to 1.0 U/mL. Interestingly, these data are at least consistent with the notion that EPO may act upon late-stage Ter119pos erythroblasts to possibly promote cell-cycle exit and subsequent terminal differentiation. This concept is diagrammed in Figure S4, together with representative primary data for Ter119pos erythroblast cell-cycle distributions.
Discussion
As introduced above, EPO's prime actions have been characterized as antiapoptotic. In part, this is based on early seminal work in Friend virus–infected splenocytes,50 together with more recent studies in cell line and select primary cell systems.1,50,,–53 This concept has been further reinforced by EPO's apparent cytoprotective actions on injured cardiac, neuronal, renal, and endothelial tissues.54 Less attention has been paid to EPO's possible proliferative action modes (and in Friend virus–transduced erythroblasts, such actions may have been masked by env protein-gp55 interactions with the EPOR,55 STK receptor tyrosine kinase, and GAB256 ). In cell line models50,57,,,–61 and in human BFUe-like progenitors,62 EPO's effects on DNA synthesis (and cell numbers) also at least suggest cell-cycle modulation. The present study applies global gene profiling, together with analyses of primary marrow erythroblasts expressing knocked-in minimal EPOR alleles, to describe specific novel circuits between EPOR subdomains and a unique set of EPO-modulated cell-cycle regulatory genes. Analyses of cell-cycle characteristics for these primary erythroblasts further suggest EPO modulation of not only progenitor renewal divisions, but possibly differentiation divisions among late-stage erythroblasts.
Among immediate early-response genes, EPO was observed to rapidly induce the expression of Egr1 (a C2H2-type zinc finger transcription factor)30 together with Nab2, a transcriptional repressor (recently shown to interact with EGR1). EPO also induced Nupr1 (or p8), a high-mobility group–related transcriptional cofactor that affects mouse embryonic fibroblast growth (as well as pituitary tumorigenesis),29,63 and Gspt1, a GTP binding protein that modulates protein translational factors (eg, eRF3)28 and/or mRNA stability64 (and S cerevisiae, an S-phase transition factor).65 For Egr1, this factor originally was discovered as a G0/G1 progression factor66 and is induced by a broad group of cytokines.30 EGR1 itself can also regulate cyclin D2, Nab2, Pten, and p53,43,44,67 and in UT7epo and ELM-I-1 cell lines, EPO modulation of Egr1 previously has been observed.27,40 In these systems, MEK1,2 and ERK1,2 pathways were implicated in Egr1 induction.40 As presently observed, sustained Egr1 induction via a minimal EPOR-HM allele is consistent with this route based on its recently described capacity to reinforce MEK1,2 and ERK1,2 signaling.38 Observed hyperactivation of Egr1 via EPOR-H (and PY343), however, was unexpected. Specific mechanisms underlying this effect might reflect a loss of Egr1 repression as normally exerted by distal C-terminal EPOR domains. Whether this relates to dysregulated erythropoiesis in human individuals with truncated EPOR alleles68 may therefore merit consideration.
Via the wt-EPOR, EPO also efficiently induced Nab2. In certain systems, Nab2 is induced coordinately with Egr1,69 and can also be stimulated by EGR1 per se.41,44 In one action mode, NAB2 can bind EGR1 and functions as a transcriptional repressor.44 For minimal EPOR alleles, an apparent deficiency in Nab2 induction for EPOR-H, but not EPOR-HM, was of interest. In particular, this suggests complex control for Nab2 in which C-terminal EPOR domains may promote Nab2 expression, while PY343/Stat5 may exert repression. Interestingly, roles for NAB2 in neuron terminal differentiation also have recently been described. Whether NAB2, as induced in primary erythroblasts by EPO, might similarly support late differentiation therefore is of interest to consider.
With regard next to cyclins (and for KitposCD71high wt-EPOR erythroblasts), EPO was observed to selectively modulate only one D-type cyclin, D2, and one inhibitory cyclin, G2. In various cell line models, EPO has been reported to increase and/or decrease D1, D2, and/or D3 cyclins.21,–23 Certain of these studies analyzed relatively late-stage erythroblasts. This includes FVA splenic erythroblasts in which EPO appeared to down-modulate cyclin D3,17 and relatively late-stage cord blood erythroblasts in which EPO transiently increased, but then decreased cyclins D1 and D3.22 In CD34pos cell–derived erythroblasts, however, EPO has been reported to induce D1 and D3 cyclins, and this was argued to depend upon PI3- and Akt-kinase pathways.21 In several Stat5-coupled type 1 cytokine receptor systems (IL2, IL7, prolactin, growth hormone), D2 is the major induced D-type cyclin.23,70,–72 In addition, Stat5 may directly promote cyclin D2 expression.72 These later studies are consistent with not only the presently observed selective EPO induction of D2 cyclin in murine marrow erythroblasts, but also the requirement of an intact EPOR PY343 Stat5 binding site for this response. PI3 kinase signals, however, can enhance this Stat5 effect.71 Recently, our laboratory has discovered an ability of Stat5 (as activated via wt-EPOR and EPOR-H alleles) to couple directly to GAB2, and consequently to PI3-kinase (P.S., et al, manuscript in preparation). EPO's selective activation of D2 cyclin therefore may depend upon several convergent EPO-regulated pathways (which, in contrast, may not affect D1 or D3 cyclins).
For Cyclin G2, its EPO-inhibited expression was unexpected, and (to our knowledge) this has not previously been reported for EPO or any related cytokine. In quiescent and postmitotic cells,73 CYCLIN G2 expression is high, and its down-regulation may be required for cell-cycle entry.74 CYCLIN G2's action mechanisms are less clear, but may involve associations with phosphatase 2A, cytoskeletal, and/or spindle components.75 Its expression also may be modulated by calcium flux–,74 PKC-,74 FOXO3A-, or estrogen receptor–dependent mechanisms.73 EPO, however, may comprise the first example of hematopoietic cytokine-modulated cyclin G2 expression, especially as coordinated with cyclin D2 regulation. In UT7epo cells, ectopic expression of CYCLIN G2 further resulted in attenuated growth as observed first in direct cell count assays. In time-course analyses of EPO-dependent BrdU incorporation, levels in UT7epo-Cyclin G2 cells likewise were decreased. Cell-cycle analyses further revealed decreased S-phase advancement. These results (together with an observed CYCLIN G2–dependent enhancement of JC4 cell differentiation) indicate functional significance for EPO's relatively strong inhibition of Cyclin G2 expression. Efficient EPO repression of G2 cyclin via EPOR-H (but not EPOR-HM) further suggests possible roles for Stat5 mechanisms (and this aspect of EPO-regulated Cyclin G2 expression merits further future investigation).
Unexpectedly, Epo also markedly down-regulated Bcl6 expression. BCL6 is a POZ/zinc finger transcriptional repressor,32,33 which plays key roles in B-cell development and lymphomagenesis.32 In cytokine-mediated proliferative contexts, BCL6 recently has been shown to be induced during IL21-dependent B-cell differentiation76 and to counterproliferative effects of IL6 on macrophages, possibly by repressing cyclin D2 and up-modulating p27.77 As studied in a BCR-ABL–expressing BV173 cell model, BCL6 further has been argued to be regulated by FOXO3A, and to act in a repressive fashion at a consensus STAT5/BCL6 element in the human cyclin D2 promoter.78 As presently studied in KitposCD71high marrow erythroblasts, EPO inhibition of Bcl6 therefore might reverse this effect and enhance EPOR-H/PY343/Stat5–dependent cyclin D2 transcription. It also is notable that in Bcl6−/− mice, levels of late-stage Ter119pos splenic erythroblasts are decreased.79 This effect was not attributable to apoptosis, and therefore may reflect enhanced self-renewal capacity.
As reviewed by Albagli-Curiel,80 BCL6 also can exert diverse effects on proliferation, survival, differentiation, and transformation in context-specific fashions. To illustrate, Bcl6 deletion appears to differentially compromise cardiomyocyte survival; to be without effect on CD8pos T cells; and to enhance the survival of primary Bcl6−/− macrophages. The above examples are cited to emphasize that at least certain of the EPO-regulated factors presently described in cell-cycle and proliferation contexts also may affect survival. For EGR1 and NUPR1, select examples exist.81,82 For CYCLIN D2, CYCLIN G2, and P27, however, prior studies point more directly to regulation of progenitor proliferation.74,83,84
The present analyses of EPO response genes as modulated via minimal EPOR alleles also provide new information concerning circuits to cell-cycle regulatory genes. Despite the capacity of a minimal PY site–null EPOR-HM allele to support steady-state erythropoiesis,34 dysregulation especially of cyclin D2, cyclin G2, and Bcl6 circuits via EPOR-HM further predicted the existence of cell-cycle perturbations. In early-stage CD71highTer119neg erythroblasts, this was discovered as attenuated progression at G0/G1- to S-phase and S- to G2-phases for EPOR-HM (with EPO dose dependency). At least in part, this is proposed to be causally related to low-level D2 cyclin, and abnormally sustained cyclin G2 and Bcl6 expression. The significance of these findings is underlined by ineffective erythropoiesis during anemia as supported by EPOR-HM and by EPOR-H's rescue of efficient stress erythropoiesis.11
Finally, in later-stage Ter119pos erythroblasts, the extent to which EPO might affect growth, survival, or development is less clear. Effects of EPO (and EPOR alleles) on cell-cycle distributions as observed among these maturing erythroblasts therefore were also of significant interest. In particular, EPO dose-dependent effects on apparent G0/G1-phase accumulation suggest a reprogramming toward differentiation that can be influenced by EPO. Delays exhibited by Ter119pos EPOR-HM erythroblasts at this stage are consistent with this notion (and likewise exhibited EPO dose dependency). For EPOR-HM cells at low EPO doses, this could involve compromised survival potentials (but studies in FVA cells suggest that apoptosis due to limited EPO signaling is not associated with one vs another cell-cycle phase85 ). The case that unique mechanisms regulate erythroblast differentiation divisions recently has been reinforced by Kinross et al14 in which E2F4 deficiency selectively attenuated growth (but not the differentiation) of differentiating fetal liver erythroblasts. Specific ways that EPO might affect such differentiation divisions (vs renewal divisions) are under active investigation.
The online version of this article contains a data supplement.
The publication costs of this article were defrayed in part by page charge payment. Therefore, and solely to indicate this fact, this article is hereby marked “advertisement” in accordance with 18 USC section 1734.
Acknowledgments
This work was supported by National Institutes of Health (NIH) grants R01-HL44491, and core facilities were sponsored via NIH P20-RR018789 and NIH P20 RR 015555.
The authors thank Dr James Ihle (St Jude Children's Research Hospital) for the provision of EPOR-H and EPOR-HM mice; Jane Mitchell (MMCRI) for expert assistance with flow cytometry; and Alison Fiser (MMCRI) for expert administrative assistance.
National Institutes of Health
Authorship
Contribution: J.F., M.M., and D.M.W. contributed to essentially all experiments; Olga Bogacheva, Oleg Bogacheva, and W.K. assisted with profiling experiments; W.K. and S.B. assumed lead roles in RT-PCR analyses; E.H. and P.S. contributed major efforts with ex vivo expansions and associated analyses; and all authors assisted with data analyses and illustrations and with the construction of this paper. J.F. and M.M. contributed equally to this work.
Conflict-of-interest disclosure: The authors declare no competing financial interests.
Correspondence: D. M. Wojchowski, Director, Stem and Progenitor Cell Biology Program, Maine Medical Center Research Institute, 81 Research Dr, Scarborough, ME 04074; e-mail:wojchd@mmc.org.

