Abstract
Segmental distribution of T2* values can be assessed in heart iron overloaded patients by multislice, multiecho cardiovascular MRI. A significant heterogeneity in T2* segmental distribution was demonstrated in previous studies in thalassemia major (TM) patients [1] and may represent true heterogeneous iron density or could be generated by geometric and susceptibility artefacts. In this study we investigate the relationship between T2* heterogeneity and iron overload progression in a large patient population in order to understand if susceptibility artefact may account for inhomogeneous T2* values segmental distribution.
230 TM patients consecutively affered to our laboratory were studied. Informed consent was obtained for all of them. MRI was performed using a 1.5 T MR scanner (GE Signa, CV/i). For the measurements of myocardial T2*, a fast gradient echo-multiecho sequence (FA=25°, matrix=256×192, FOV=35×35 cm, thickness=8.0 mm, NEX=0.75) was used with ECG triggering. Each slice was acquired at nine echo times (2.2–20.3 ms, with echo spacing of 2.26 ms) in a single end-expiratory breath-hold. Three short axis views (basal, medium, and apical) of the left ventricle were obtained and analyzed using a custom-written, previous validated software (HIPPO MIOT®) The myocardium was automatically segmented into a 16-segments standardized heart model and the T2* value on each segment was calculated as well as the global T2* value. The level of heterogeneity of the T2* segmental distribution on each patient was evaluated by computing the coefficient of variation (CoV) as the standard deviation of the absolute value of differences between the segmental T2* values and the global T2* value divided by their means, and expressed as the percentage. A surrogate data sets was obtained stating that the inhomogeneous segmental distribution of T2* would be generated only by susceptibility artefacts that are additive in the R2* (1/T2*) domain. These artefacts were characterized in a previous study by the analysis of the segmental T2* distribution in normal subject [2].
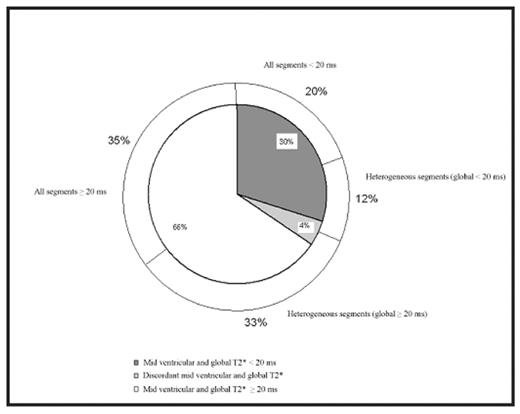
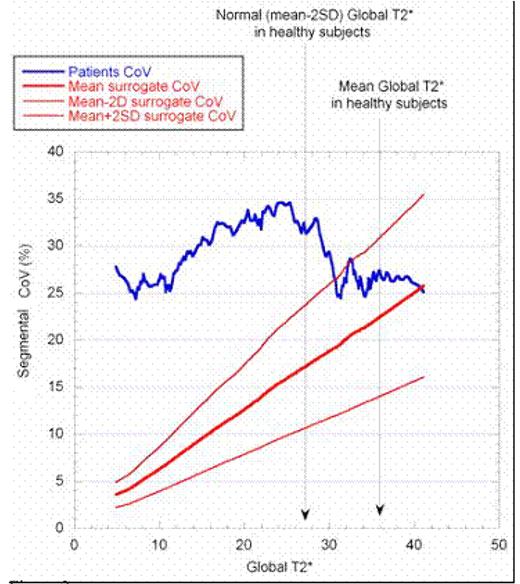
In 45 (20%) TM patients, segmental T2* values were all below the lower limit of normal (20 ms). In 104 (45%) patients, T2* values were heterogeneous with respect to the normal threshold. Of these patients, 74% showed a normal T2* global value. Eighty-one (35%) patients had all normal segments. Figure 1 shows the distribution of heterogeneous T2* among the patients population. Figure 2 shows the CoV in myocardial T2* distribution vs. the global T2* values in patients and surrogate data. Patients were sorted using the global T2* values and averaged on a 20-point window to smooth the resulting graph. Mean and normal global T2* value for healthy subjects were assessed in a previous study. Montecarlo simulation was performed on 10,000 surrogate data sets. For surrogate data, the mean CoV values together with the mean⊠2SD limits are shown. T2* heterogeneity for patients without iron overload was compatible with the hypothesis that the heterogeneity was generated by additive susceptibility artefacts. Below the normal limit of global T2* the heterogeneity abruptly increased of about 10%. Starting from this level, the heterogeneity decreased linearly returning to 25% in patients with high iron overload levels. Figure 2 shows
In conclusion, a large percentage of thalassemia major patients shows a significant heterogeneity of segmental distribution of T2* values in myocardium, measured by multislice multiecho T2* cardiac magnetic resonance. T2* segmental heterogeneity in TM patients cannot be explained by the effect of susceptibility artefacts, that are additive and should vanish at high iron overload levels. A possible interpretation is that a true heterogeneity in iron overload distribution is present in TM patients. This heterogeneity seems more important in the early development of iron overload and reduces when the iron overload level increases.
Disclosures: No relevant conflicts of interest to declare.
Author notes
Corresponding author


