Abstract
Changes in circulating levels of biomarkers of cell death (such as nucleosomal DNA, nDNA) within days of starting chemotherapy are highly predictive of end of treatment response rates and progression-free survival in acute myeloid leukaemia, lung and bowel cancers1–3. In aggressive lymphoma, depth of response as measured by computed tomography (CT) at the end of treatment is a useful predictor of long-term survival4. If early blood-borne biomarker data were predictive of end of treatment response in lymphoma, this may provide an opportunity to make timely changes to treatment. Thus the aims of this study were
to measure circulating nDNA before and during chemotherapy for lymphoma,
to correlate biomarker changes in blood levels with those in one and two dimensional (1, 2D) tumor measurements by CT and
to evaluate the sensitivity of blood-borne nDNA and imaging biomarkers for predicting treatment response.
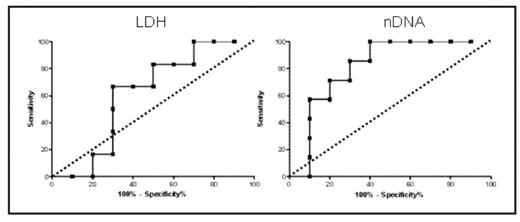
Serum samples from 17 patients with lymphoma (8 Hodgkin (HL) and 9 Non Hodgkin (NHL) cases) treated with standard chemotherapy were analysed for nDNA using the cell death detection kit™ (Roche) according to manufacturers’ instructions. Serial samples were taken pre-treatment (day 1 baseline) and on days 3, 8 and 15 of the first chemotherapy cycle. Control samples were taken from a healthy volunteer panel. Baseline and end of therapy CT images were obtained using a LightSpeed Plus CT scanner with typical helical acquisition parameters. Data were acquired following intravenous contrast and images were reformatted to contiguous non-overlapping 5mm slices to allow future calculation of tumor volume. One and 2D measurements of tumor size were determined by a radiologist blinded to nDNA data. Levels of nDNA were significantly higher in all lymphoma subtypes compared with 61 healthy controls (median 1.4 vs 0.3, p<0.005), but showed no relationship with absolute pre- or post-treatment tumor dimensions. Neither LDH nor prognostic score (international prognostic indices for NHL and Hasenclever score for HL) predicted end of treatment tumor dimensions or treatment induced change in tumor dimensions. In contrast, dramatic falls in nDNA levels were observed within the first week after chemotherapy (p=0.02) and both baseline and day 8 nDNA levels correlated well with proportional end of treatment tumor shrinkage assessed by 2D measurements (R=0.6, p=0.01 and R=0.64, p=0.005, respectively). Corresponding area under the ROC curve values for 80% reduction at end of therapy (shown below) were 0.81 and 0.8 (P=0.04) each for baseline and day 8 nDNA levels, equating to a specificity of 80% and sensitivity of 71.5%. These data identify baseline and day 8 post-treatment nDNA as sensitive predictive biomarkers of end of treatment response in lymphoma, which warrants further investigation. Early phase clinical trials incorporating circulating nDNA are underway to begin to qualify circulating nDNA as a predictor of progression free and overall survival, and to compare nDNA with 1, 2 and 3D CT measurements as a potentially powerful multimodality biomarker approach.
Figure illustrating that Receiver Operating Characteristics for nDNA are significantly superior to baseline LDH in terms of predicting tumor shrinkage of 80% or more at end of therapy (dashed line where test is equivalent to chance)
Disclosures: No relevant conflicts of interest to declare.
Reference List
Author notes
Corresponding author


