Abstract
The majority of patients with chronic myeloid leukemia in chronic phase gain substantial benefit from imatinib but some fail to respond or lose their initial response. In 2006, the European LeukemiaNet published recommendations designed to help identify patients responding poorly to imatinib. Patients were evaluated at 3, 6, 12, and 18 months and some were classified as “failure” or “suboptimal responders.” We analyzed outcomes for 224 patients with chronic myeloid leukemia in chronic phase treated in a single institution to validate these recommendations. Patients were followed for a median of 46.1 months. At each time point, patients classified as “failure” showed significantly worse survival, progression-free survival, and cytogenetic response than other patients; for example, based on the assessment at 12 months, the 5-year survival was 87.1% versus 95.1% (P = .02), progression-free survival 76.% versus 90% (P = .002), and complete cytogenetic response rate 26.7% versus 94.1% (P < .001). Similarly, the criteria for “suboptimal response” at 6 and 12 months identified patients destined to fare badly, although criteria at 18 months were less useful. The predictive value of some other individual criteria varied. In general, the LeukemiaNet criteria have useful predictive value, but a case could now be made for combining the categories “failure” and “suboptimal response.”
Introduction
For most of the 20th century, little important progress was made in the management of patients with Philadelphia (Ph)-positive (or BCR-ABL–positive) chronic myeloid leukemia (CML). The minority of patients who were treated by allogeneic stem cell transplantation could expect to be cured if they survived the procedure, but for the majority, interferon-alpha alone or in combination with cytarabine offered the prospect of prolonging survival by 1 to 2 years compared with earlier use of conventional cytotoxic drugs.1,2 The introduction into clinical practice of imatinib mesylate in 1998 proved to be a remarkable contribution to the management of patients with CML in chronic phase (CP), and this drug at 400 mg daily has now become the recommended initial treatment for all adult patients throughout the world. The majority of patients can now expect to survive 10, 20, or more years.3,4 It is even possible that some patients treated for a number of years can stop the imatinib and be regarded as cured of their leukemia.5 With this background, it is important to recognize that, although the majority of patients fare extremely well when treated with imatinib as a single agent, a significant minority do not.4 Given the current availability of both allogeneic stem cell transplantation and second-generation tyrosine kinase inhibitors, it is essential to identify at the earliest opportunity these patients so that alternative treatment strategies can be introduced.
In 2006, Baccarani et al,2 on behalf of the European LeukemiaNet, published a series of empirical recommendations designed to help clinicians identify CML-CP patients responding poorly to imatinib at standard dosage (Table 1). The recommendations were based on assessing response to treatment at various time points using specific hematologic, cytogenetic, and molecular criteria. Based on these criteria, patients could be classified as “failure” or “suboptimal response.” Additional features defined at diagnosis or during the course of the disease indicated the need for closer follow-up of individual patients and were classified as “warnings.” Although not based on detailed evaluation of large numbers of patients followed for many years, these recommendations did indeed prove very valuable in helping clinicians plan therapy for individual patients and have gained wide acceptance on both sides of the Atlantic and elsewhere. Here we show that the clinical outcome for 224 newly diagnosed CML-CP patients treated in a single institution do indeed conform very well with results that could be anticipated from application of the recommendations, but we note certain discordances that may prove useful when the recommendations are revised.
Methods
Patient characteristics and treatment
Between June 2000 and May 2007, 224 consecutive adult patients with BCR-ABL–positive CML in CP received imatinib as first-line therapy. Imatinib was started within 6 months of diagnosis, but no patient had received any previous antileukemia treatment other than hydroxyurea. Seventeen of these patients were included in the International Randomized Study of Interferon and STI571 (IRIS) study. The Hammersmith Hospital study protocol was reviewed by the research ethics committee, and patients gave written informed consent in accordance with the Declaration of Helsinki to participate. The definitions of CP and complete hematologic responses (CHR) were those used for the European LeukemiaNet recommendations.2 Patients received 400 mg imatinib daily by mouth as previously described.4
Bone marrow morphology and cytogenetics were assessed at diagnosis and then every 3 months until patients achieved complete cytogenetic response (CCyR). Thereafter, patients were monitored by real-time quantitative polymerase chain reaction (RQ-PCR) and annual bone marrow examinations. CCyR was defined by the failure to detect any Ph chromosome-positive metaphases in 2 consecutive bone marrow examinations with a minimum of 30 metaphases examined and major cytogenetic response (MCyR) was defined by combining the number of complete and partial cytogenetic responses (≤ 35% Ph+ metaphases). Cytogenetic relapse (loss of CCyR) was defined by the detection of one or more Ph+ marrow metaphases, also confirmed by a subsequent study, in a patient who had previously achieved CCyR. Bone marrow examination was triggered by a rise in BCR-ABL transcript numbers to a level consistent with cytogenetic relapse.6 Disease progression was defined when the leukemia satisfied criteria for advanced phase (accelerated or blastic phases).7
The median age was 46.1 years (range, 18-79 years); 94 (42%) patients were female; 62 (27.7%), 94 (41.9%), and 68 (30.4%) patients belonged to the low, intermediate, and high Sokal risk groups, respectively. The median interval from diagnosis to beginning imatinib was 1.7 months (range, 0-6 months). The median follow-up from starting imatinib was 46 months (range, 13-93 months). During the follow-up, 190, 173, and 97 patients achieved MCyR, CCyR, and major molecular response (MMR), respectively. Kinase domain (KD) mutations were detected in 17 patients; 11 were in CHR (of whom 7 were still in CCyR) and 6 had lost their CHR or progressed to advanced phase. A total of 29 patients discontinued the imatinib therapy, although still in CP, 8 resulting from toxicity and 21 resulting from unsatisfactory response. Additional cytogenetic abnormalities in Ph+ cells (ACAs) emerged during therapy in 22 patients, of whom 2 were in raised count CP, 14 were in CHR, and in the remaining 6 the ACAs were detected only after progression to advanced phase. Other new cytogenetic abnormalities in Ph− cells were detected in 8 patients. Thirty-four patients lost their CHR, 25 progressed to accelerated or blastic phase, and 13 died. The dose of imatinib was increased more than 400 mg per day in 94 (42%) patients; 21 patients (9.4%) had the imatinib increased during the first year of therapy.
Molecular studies
BCR-ABL transcripts were measured in the blood at 6- to 12-week intervals using RQ-PCR as described previously.6,8-10 Results were expressed as percent ratios relative to an ABL internal control and as log10 reductions compared with the standardized median value for the 30 untreated patients who we used in the IRIS study.8,11 MMR was defined as a 3 log reduction in transcript levels11 based on 2 consecutive molecular studies and complete molecular response (CMR) was defined as 2 consecutive samples with no detectable transcripts provided that control gene copy numbers were adequate. Samples obtained for RQ-PCR were also analyzed at regular intervals for KD mutations as described elsewhere.4
Statistical methods
Probabilities of overall survival (OS) and progression-free survival (PFS) were calculated using the Kaplan-Meier method. PFS was defined as survival without evidence of accelerated or blastic phase disease.7 The probabilities of cytogenetic response and cytogenetic relapse were calculated using the cumulative incidence procedure, where cytogenetic response or relapse were the events of interest and imatinib discontinuation, death, and disease progression were the competitors. For OS and PFS analysis, patients were censored at the time of stem cell transplant. Univariate analyses to identify prognostic factors for OS, PFS, cytogenetic response, and cytogenetic relapse were carried out using the log-rank test. Variables found to be significant when P was less than .25 were entered into a proportional hazards regression analysis using a forward stepping procedure, with standard boundaries of entry (.05) and removal (.10) of variables, to find the best model (SPSS, version 11.0.1). The proportional hazards assumption was confirmed by adding a time-dependent covariate for each covariate. The influence of the emergence of KD mutations, emergence of ACAs, loss of a previously achieved CHR, loss of a previously achieved CCyR, and loss of a previously achieved MMR on the different outcomes at any time during the follow-up was studied in a time-dependent Cox model. P values were 2-sided and 95% confidence intervals (CI) computed.
Results
The LeukemiaNet criteria for classifying patients as “failure” were durable
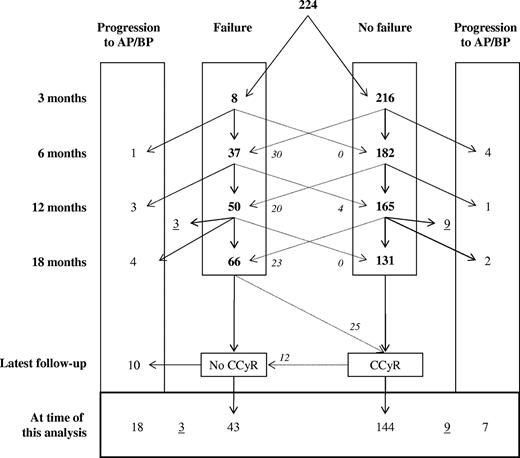
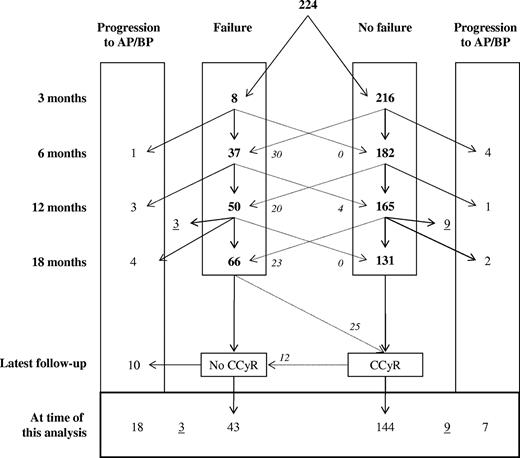
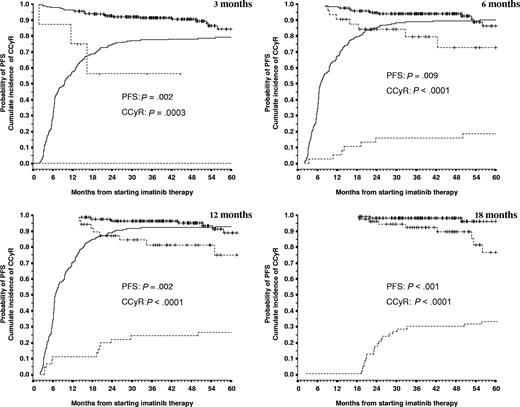
A total of 8, 37, and 45 patients were classified as failure at 3, 6, and 12 months, respectively (Figure 1). None of the patients classified as failure at 3 or 12 months later reversed their “failure” status (ie, at 12 or 18 months), whereas 4 of the 37 patients classified as failure at 6 months subsequently satisfied criteria for response. However, of these 4 patients, one was reclassified as failure at 18 months and a further 2 lost the previously achieved CCyR. Thus, the classification criteria were robust as almost all patients classified as failure at a given time point continued to meet the failure criteria at subsequent time points (P always < .001).
Classification of 224 patients according to criteria for failure at 3, 6, 12, and 18 months and their final outcome. Numbers underlined (3 and 9) reflect patients with a follow-up of less than 18 months. Numbers in italics represent patients who changed categories.
Classification of 224 patients according to criteria for failure at 3, 6, 12, and 18 months and their final outcome. Numbers underlined (3 and 9) reflect patients with a follow-up of less than 18 months. Numbers in italics represent patients who changed categories.
Prognostic significance of LeukemiaNet criteria for failure at 3, 6, 12, and 18 months
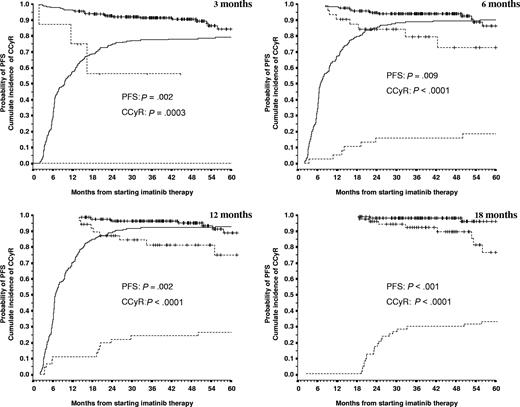
At each of the time points, patients classified as failure had a significantly lower OS, PFS, and probability of achieving CCyR than the patients classified as responders (Table 2; Figure 2). For example, the patients classified as failure by the 12-month criteria had a significantly lower 5-year OS than responders (87.1% vs 95.1%, P = .02), lower PFS (76% vs 90%, P < .002), and lower probability of CCyR (26.7% vs 94.1%, P < .001). Patients classified as failure at any time point who did eventually achieve CCyR (after 18 months) had a significantly higher probability of losing their CCyR. For example, at 12 months, the cumulative incidence of loss of CCyR for these patients was significantly higher than that of responders (51% vs 10.3%, P < .001).
Probabilities of PFS and CCyR according to the criteria for failure at 3, 6, 12, and 18 months. Failure patients are represented by the dashed line and nonfailure patients by the continuous line. PFS curves start from 100%, and CCyR curves start from 0%. The number of patients in each category, the precise numerical values for the probabilities of PFS and CCyR, and the P values are shown in Table 2. Vertical lines represent censored patients (but the corresponding lines are not shown in the CCyR curves). At 18 months, 100% of the patients in the nonfailure group were in CCyR (by definition); thus, the curve is not shown.
Probabilities of PFS and CCyR according to the criteria for failure at 3, 6, 12, and 18 months. Failure patients are represented by the dashed line and nonfailure patients by the continuous line. PFS curves start from 100%, and CCyR curves start from 0%. The number of patients in each category, the precise numerical values for the probabilities of PFS and CCyR, and the P values are shown in Table 2. Vertical lines represent censored patients (but the corresponding lines are not shown in the CCyR curves). At 18 months, 100% of the patients in the nonfailure group were in CCyR (by definition); thus, the curve is not shown.
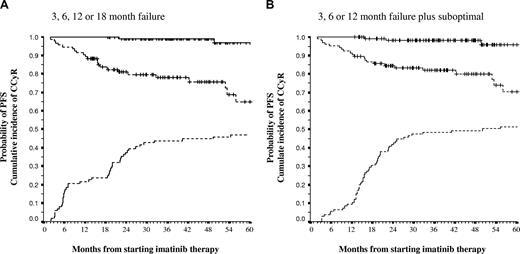
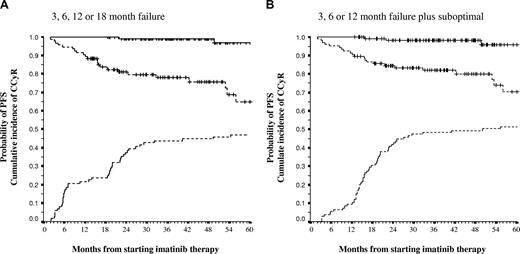
If we defined as failure patients who met the failure criteria at 12 months or at any earlier time point and compared their outcome with that of patients who had never “failed,” OS and PFS at 5 years were 80.6% versus 96.1% (P = .005) and 63.8% versus 90.8% (P < .001), respectively. Analogous differences were obtained when patients who had failed at 18 months (Figure 3) or at any previous point were compared with “nonfailures,” namely, OS, 82.8% versus 98.5% (P = .006) and PFS, 64.9% versus 97.7% (P < .0001).
PFS and probability of CCyR for patients who met criteria of failure at 3, 6, 12, or 18 months and for patients who met criteria of failure and suboptimal response at 3, 6, or 12 months. (A) The PFS and probability of CCyR for patients who met the criteria of failure at 3, 6, 12, or 18 months (dashed line) compared with those patients who never met criteria for failure (continuous line); the 5-year PFS was 63.8% versus 90.8% (P < .001), and the 5-year probability of CCyR was 46.3% versus 100% (P < .001). (B) The PFS and probability of CCyR for patients who met either criteria of failure or suboptimal response at 3, 6, or 12 months (dashed line) compared with those patients who did not meet criteria for failure or suboptimal response at 3, 6, and 12 months; the 5-year PFS was 70.4% versus 95.9% (P < .001), and the probability of CCyR was 51.4% versus 100% (P < .001). Vertical lines represent censored patients (but the corresponding lines are not shown in the CCyR curves). In the 18- and 12-month values, 100% of the patients in the responding groups were in CCyR (by definition).
PFS and probability of CCyR for patients who met criteria of failure at 3, 6, 12, or 18 months and for patients who met criteria of failure and suboptimal response at 3, 6, or 12 months. (A) The PFS and probability of CCyR for patients who met the criteria of failure at 3, 6, 12, or 18 months (dashed line) compared with those patients who never met criteria for failure (continuous line); the 5-year PFS was 63.8% versus 90.8% (P < .001), and the 5-year probability of CCyR was 46.3% versus 100% (P < .001). (B) The PFS and probability of CCyR for patients who met either criteria of failure or suboptimal response at 3, 6, or 12 months (dashed line) compared with those patients who did not meet criteria for failure or suboptimal response at 3, 6, and 12 months; the 5-year PFS was 70.4% versus 95.9% (P < .001), and the probability of CCyR was 51.4% versus 100% (P < .001). Vertical lines represent censored patients (but the corresponding lines are not shown in the CCyR curves). In the 18- and 12-month values, 100% of the patients in the responding groups were in CCyR (by definition).
Prognostic significance of meeting LeukemiaNet criteria for suboptimal response at 3, 6, 12, and 18 months
We found a de facto overlap between the definitions of suboptimal response and failure at 3 months because, although 8 patients were classified as failure, none of the remaining 216 patients was classified as suboptimal response.
Table 2 shows the probabilities of OS, PFS, CCyR, and loss of CCyR for the patients according to whether or not they met the definition for suboptimal response once the failure patients had been excluded. Suboptimal responders defined at 6 and 12 months had a significantly poorer PFS and lower probability of CCyR. Suboptimal responders by the 12-month criteria also had significantly worse survival. The 18-month criteria failed to identify patients with worse OS or PFS.
We combined the definitions of failure with suboptimal response at 6, 12, and 18 months, comparing at each time point outcomes for patients who met the criteria for failure or suboptimal response with that of “responders” (nonfailure and nonsuboptimal). At 6 months, “nonresponders” had a significantly worse 5-year OS (86.6% vs 97.9%, P = .04), PFS (70.0% vs 92%, P = .001), and probability of CCyR (38.5% vs 96%, P < .0001) than the “responding” patients. Similar results were obtained at 12 months: OS, 86.7% versus 98.5 (P = .01); PFS, 75.3% versus 96.7 (P < .001); and CI, of CCyR 52.2% versus 100% (P < .001). However, patients classified as “nonresponders” at 18 months had OS and PFS similar to those of patients classified as “responders,” namely, 94.5% versus 97.4% (P = .9) and 88.0% versus 95.4% (P = .4).
We then considered as “nonresponder” patients who had met either the criteria for failure or suboptimal response at 3, 6, or 12 months and compared their OS, PFS, and probability of CCyR with those patients who never met any of the criteria for failure or suboptimal response at 3, 6, or 12 months. Nonresponders had a significantly worse OS (85% vs 98.4%, P = .003), PFS (70.4% vs 95.9, P < .001), and probability of CCyR (51.4% vs 100%, P < .001) (Figure 3).
Warnings
We did not routinely study patients for the presence of a 9q+ deletion, so we could not explore its prognostic meaning. Patients in the Sokal high-risk group and patients with ACAs at diagnosis fared worse (Table 3). However, the failure to achieve MMR at 12 months or the presence of chromosomal abnormalities in Ph− cells did not have any impact in OS or PFS (Table 3).
Prognostic significance of MMR
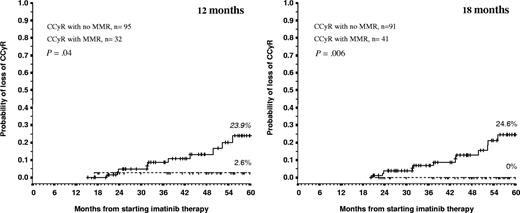
Whether we considered the whole population or limited our analysis to patients in CCyR, the achievement of MMR at 12 or 18 months failed to confer any benefit in 5-year PFS or OS. We further explored the prognostic implication of achieving MMR by studying the effect of molecular response on the probability of losing a CCyR. Patients in CCyR who had failed to achieve MMR at 12 or 18 months were more likely to lose their CCyR than patients who did achieve MMR, 23.6% versus 2.6% (P = .04) and 24.6% versus 0% (P < .006), respectively (Figure 3).
Contribution of the individual criteria to the identification of the high-risk patients
Table 3 summarizes OS, PFS, and probability of achieving CCyR for the 224 patients in this analysis according to each of the components that define failure, suboptimal response, or warnings at the various time points in the LeukemiaNet recommendations. To study the relative contribution of these individual components to the identification of high-risk patients, we performed 3 landmark analyses for PFS using the variables defined at 6, 12, and 18 months (Table 3).
At 6 months, the only independent predictors for PFS were: (1) being in CHR (RR = 5.9, P = .012), (2) being in MCyR (RR = 3.3, P = .017), and (3) ACAs at diagnosis (RR = .2, P = .034). At 12 months, the only independent predictors for PFS were: (1) being in CCyR (RR = 4.5, P = .02) and (2) prior loss of CCyR (RR = .24, P = .036). At 18 months, the only independent predictor for PFS was being in CCyR (RR = 6.9, P = .005).
At both 6 and 12 months, the multivariate analysis showed that the cytogenetic criteria used to define suboptimal response were more predictive than the ones used to define failure. When we subclassified the patients according to their cytogenetic response at 6 months as (1) more than 95% Ph+, n = 34; (2) 36% to 95% Ph+, n = 28; and (3) MCyR, n = 157, we found that the probabilities for 5-year PFS were 72.8%, 74.9%, and 91.5% (P = .003), respectively. The P value for the comparison 2 versus 3 was P = .02, whereas the P value for the comparison 1 versus 2 was P = .6. We also reclassified the patients according to their cytogenetic response at 12 months as (1) no MCyR (n = 46), (2) MCyR but no CCyR (n = 42), and (3) CCyR (n = 127); the probabilities of 5-year PFS were 76.3%, 81.5%, and 96.2%, respectively (P < .001). The P values for the comparison 2 versus 3 was P = .01, whereas the P value for the comparison 1 versus 2 was P = .4.
To further explore the prognostic value of variables like loss of CHR or emergence of KD mutations that may occur at any time during follow-up, we performed an analysis where the cytogenetic and molecular responses were defined at 12 months, but the loss of responses, emergence of ACAs, and KD mutations were introduced as time-dependent covariables. In this analysis, we considered the 215 patients who remained in CP at 12 months. Loss of CCyR (RR = 0.08, P < .001), loss of CHR (RR = 0.07, P < .001), and the acquisition ACAs (RR = 0.1, P < .001) were the only independent predictors for PFS. Similar results were found at 18 months (data not shown).
Discussion
Since their publication in 2006, the European LeukemiaNet recommendations have been widely accepted because they help physicians identify, as early as possible, patients with CML in CP who may not fare well on imatinib and therefore require alternative therapeutic strategies. The recommendations were, however, based largely on an analysis of outcome for patients treated in the IRIS study, which focused mainly on cytogenetic responses and PFS, and the experience of a panel of experts who had treated smaller number of patients in their own institutions. Here we have analyzed outcomes for 224 patients with CML in CP treated in a single institution in an attempt to assess, for the first time, the extent to which the LeukemiaNet recommendations can be validated in clinical practice.
We found that the patients classified as “failure” had a lower survival, a lower PFS, and a lower probability of achieving CCyR, and a higher probability of losing their CCyR if they did achieve it (Table 2; Figure 2). Furthermore, almost all the individual parameters that comprise the definition of failure at the various time points were per se significant predictors for those outcomes. We could not examine the impact on survival and PFS of finding a TK mutation highly resistant to imatinib as we found such mutations in only 2 cases. We found a complete “overlap” between the definitions of “failure” and “suboptimal response” at 3 months as all the patients classified as “nonfailure” were indeed in CHR at 3 months. When patients classified as failure were excluded from analysis, we found that the criteria used to define suboptimal response at 6 months significantly discriminated between patients with good and poor PFS and probability of achieving CCyR. The 12-month criteria significantly discriminated patients with good and poor OS, PFS, and probability of achieving CCyR; for example, with the 12-month criteria, PFS for suboptimal responders was 73.4% versus 96.1% for responders (Table 2). Furthermore, responders without “warnings” had a 5-year PFS of 100% (data not shown).
The prognostic significance of achieving MMR at 12 or 18 months has been controversial for some time. In our analysis, the definitions of “warning” at 12 months and of “suboptimal response” at 18 months, both of which are based predominantly on molecular responses, did not have prognostic impact on PFS or survival. The initial report in the IRIS study found a marginal advantage in PFS for those patients in CCyR who had also achieved MMR by 12 months,11 but this was not confirmed by a subsequent analysis with 5-year follow-up.3 Furthermore, in the more recent report, patients in CCyR who had achieved MMR at 18 months did not have any PFS advantage. Other groups have also failed to confirm a PFS advantage of MMR patients.4,12 One possible explanation is that early intervention when patients lose their CCyR may successfully prevent the progression of the leukemia; thus, the adverse influence of lack of an MMR could in some cases be reversed by a change to more effective therapy. We compared the probability of losing CCyR between these 2 groups; and indeed, patients who had achieved MMR either at 12 and 18 months had a significantly lower probability of losing their CCyR (Figure 4). The same explanation, namely, a change of therapy, could explain the fact that loss of MMR was associated with loss of CCyR (RR = 5.0, P = .02, data not shown) but did not adversely influence OS or PFS.
Twelve- and 18-month landmark analysis for loss of CCyR according to the level of molecular response. Vertical lines represent censored patients.
Twelve- and 18-month landmark analysis for loss of CCyR according to the level of molecular response. Vertical lines represent censored patients.
We found that the cytogenetic criteria used to define suboptimal response at 6 and 12 months identified better the patients with bad prognosis than the cytogenetic criteria used to define failure. For instance, at 12 months, patients who were in MCyR but not in CCyR had a PFS very similar to that of patients who had failed entirely to achieve MCyR (81.5% vs 76.3%, P = .4), whereas they had a PFS significantly different from that of the CCyR patients (81.5% vs 96.2%, P = .01). This suggests that the recommendations might be improved by using the current cytogenetic criteria for suboptimal response at 6 and 12 months to define “failure.” And indeed, when we pool the patients classified as failure and those classified as suboptimal response either at 6 or 12 months, we found a more accurate prediction of the poor-risk patients than when we consider only patients who met the failure criteria, with the additional benefit that poor-risk patients can be identified at 12 months rather than at 18 months (Figure 3).
Additional cytogenetic abnormalities in Ph+ clones both at diagnosis and during follow-up are associated with poor outcomes.13-15 In our study, additional cytogenetic abnormalities at diagnosis were one of the independent adverse predictors for PFS in the 6-month analysis. They were present in 4 of the 6 patients who progressed within 1 year. The emergence of additional cytogenetic abnormalities on therapy at any time during the follow-up was an independent adverse prognostic factor for PFS (RR = 10.5, P < .001). Our data therefore confirm the poor prognosis associated with the acquisition of additional cytogenetic abnormalities and provide some support for the recommendation that such patients should be reclassified as in accelerated phase.14
We have reported previously that the acquisition of KD mutations is a poor prognostic factor for PFS in CP patients, some of whom had previously been treated with interferon-alfa,16 and also predicts for loss of CCyR in previously untreated patients.4 In this series, we identified 17 patients with “acquired” KD mutations and showed that they too had a significantly inferior PFS in univariate analysis and higher loss of hematologic response in multivariate analysis. It should be noted, however, that the analysis performed for this study was not designed to assess the prognostic significance of KD mutations because other extraneous variables entered into this analysis, such as loss of CCyR and loss of CHR, for which KD mutations were strong independent predictors (data not shown). These might have obscured the significance of KD mutations.
When the recommendations were published in 2006, very little was known about the efficacy of the second-generation tyrosine kinase inhibitors for treating patients who had failed imatinib. There is now a considerable experience with the use of these drugs, in particular, dasatinib and nilotinib. Both are active in patients who have failed imatinib, and both have a manageable safety profile.17-20 Early identification of the patient who may benefit most from use of these drugs now seems possible,21 and they are now being tested as first-line therapy.
With hindsight, the recommendations for response and lack of response, devised by Baccarani et al2 at a time when the intermediate- to long-term efficacy of imatinib as first-line therapy were unknown, have been shown to have remarkably good predictive value. Now that second-line agents are readily available, it may be time to refine the recommendations by combining some of the criteria that define “failure” with some of the criteria that are currently used to define “suboptimal response”; this might identify at a rather earlier stage those patients who require alternative therapy.
The publication costs of this article were defrayed in part by page charge payment. Therefore, and solely to indicate this fact, this article is hereby marked “advertisement” in accordance with 18 USC section 1734.
Acknowledgment
This work was supported by the National Institute for Health Research Biomedical Research Center Funding Scheme (United Kingdom).
Authorship
Contribution: D. Marin designed the study, performed the statistical analysis, supervised patient care, and wrote the manuscript; D. Milojkovic, H.d.L., F.D., M.B., J.P., M.K., and J.F.A. provided patient care and commented on the manuscript; E.O. provided patient care, designed the study, and commented on the manuscript; J.S. Khorashad performed the molecular studies, assembled the molecular data, and commented on the manuscript; A.G.R. performed the cytogenetics and commented on the manuscript; L.F. and J.S. Kaeda supervised the day-to-day running of the Minimal Residual Disease laboratory and commented on the manuscript; K.R. reviewed the manuscript; and J.M.G. helped to design the study and wrote the manuscript.
Conflict-of-interest disclosure: D. Marin received research support from Novartis and is a Consultant for Novartis and Bristol-Myers Squibb. The remaining authors declare no competing financial interests.
Correspondence: David Marin, Department of Haematology, Imperial College London, Du Cane Road, London W12 0NN, United Kingdom; e-mail: d.marin@imperial.ac.uk.

