Abstract
Adult T-cell leukemia/lymphoma (ATLL) is caused by latent human T-lymphotropic virus-1 (HTLV-1) infection. To clarify the molecular mechanism underlying leukemogenesis after viral infection, we precisely mapped 605 chromosomal breakpoints in 61 ATLL cases by spectral karyotyping and identified frequent chromosomal breakpoints in 10p11, 14q11, and 14q32. Single nucleotide polymorphism (SNP) array–comparative genomic hybridization (CGH), genetic, and expression analyses of the genes mapped within a common breakpoint cluster region in 10p11.2 revealed that in ATLL cells, transcription factor 8 (TCF8) was frequently disrupted by several mechanisms, including mainly epigenetic dysregulation. TCF8 mutant mice frequently developed invasive CD4+ T-cell lymphomas in the thymus or in ascitic fluid in vivo. Down-regulation of TCF8 expression in ATLL cells in vitro was associated with resistance to transforming growth factor β1 (TGF-β1), a well-known characteristic of ATLL cells, suggesting that escape from TGF-β1–mediated growth inhibition is important in the pathogenesis of ATLL. These findings indicate that TCF8 has a tumor suppressor role in ATLL.
Introduction
Adult T-cell leukemia/lymphoma (ATLL) is a peripheral CD4+ T-cell malignancy caused by infection with human T-lymphotropic virus-1 (HTLV-1).1 HTLV-1 infection is endemic in a number of well-defined geographic regions within Japan, and as many as 20 million individuals worldwide are estimated to harbor it.2 ATLL occurs after a prolonged latency period of up to 50 years in approximately 5% of individuals who have been infected with HTLV-1 around the time of birth. HTLV-1 encodes a transactivator, Tax, which plays a key role in the polyclonal growth of infected T cells through the activation of various genes.3 However, recent studies have shown that Tax expression is undetectable in circulating ATLL cells, while a genetically and epigenetically defective provirus was observed in more than half of the ATLL patients examined.4,5 Considering the long latency period of ATLL, it has been proposed that at least 5 additional genetic or epigenetic events are required for the development of overt disease.1,6
Nonrandom chromosomal translocations are considered to cause leukemic transformation, including structural and/or quantitative abnormalities of transcription factors such as AML1, EVI1, and MLL.7 To identify disease-specific chromosomal translocations in ATLL, karyotypes of 107 ATLL cases determined by the G-banding method were reviewed in Japan.8 There was a high degree of diversity and complexity, and disease-specific translocations were not found; however, translocations involving 14q32 (28%) or 14q11 (14%) and the deletion of 6q (23%) were the most frequent chromosomal abnormalities.8 Recently, chromosome-based comparative genomic hybridization (CGH)9 and BAC array-based CGH showed complex chromosomal abnormalities with gains in 1q, 2p, 4q, 7p, and 7q, and losses in 10p, 13q, 16q, and 18p.10 To date, however, no gene involved in the development of ATLL has been isolated. Array CGH is useful for detecting genomic deletions or amplifications, but it cannot detect chromosomal translocations or inversions.
In this study, we searched for the existence of recurrent chromosomal rearrangements by multicolor spectral karyotyping (SKY) and high-resolution single nucleotide polymorphism (SNP) array-CGH (SNP array-CGH). We precisely mapped 605 chromosomal breakpoints in 61 ATLL cases. Breakpoints occurred most frequently in 10p11 and were mapped within a 1-Mb region in 10p11.2 with heterozygous deletions in all cases. A minimal common region of chromosome deletions, including a region of homozygous deletion, was mapped to a 2-Mb region. Genetic and expression analyses of the genes mapped within the deleted region revealed transcription factor 8 (TCF8) to be frequently altered in ATLL cells by several mechanisms, including mainly epigenetic dysregulation, suggesting that TCF8 may be a candidate tumor suppressor gene. TCF8 (GenBank accession number, NM 03075111 ), AREB6, ZFHEP, NIL-2A, ZFHX1A, NIL-2-A, MGC133261, or ZEB1 encodes a 2-handed zinc finger homeodomain protein,12 which represents a key player in pathogenesis associated with tumor progression in solid cancers.13,14 In this study, we found that TCF8 mutant mice frequently developed CD4+ T-cell lymphoma/leukemia half a year after birth. Furthermore, we showed that down-regulation of TCF8 expression in ATLL cells in vitro was associated with TGF-β1 resistance, a well-known characteristic of ATLL cells, suggesting that escape from TGF-β1–mediated growth inhibition is one of the primary mechanisms in the pathogenesis of ATLL. These findings suggest that TCF8 has an important tumor suppressor role in ATLL.
Methods
Patient samples
ATLL cells were collected from patients at the time of admission to hospital and before chemotherapy.15 Diagnosis of ATLL was made on the basis of clinical features, hematologic characteristics, serum antibodies against HTLV-1 antigens, and insertion of the HTLV-1 viral genome into leukemia cells by Southern blot hybridization. Using Shimoyama's criteria,16 all patients were diagnosed as acute-type ATLL. Mononuclear cells were obtained from heparinized blood or ascites by Histopaque density gradient centrifugation (Sigma-Aldrich, St Louis, MO). After separation, ATLL cell enrichment of more than 90% was confirmed by 2-color flow cytometric analysis. All samples were separated by Histopaque density gradient centrifugation, quickly frozen within 3 hours, and cryopreserved at −80°C. This study was approved by the Institutional Review Board of the Faculty of Medicine, University of Miyazaki. Informed consent was obtained from all blood and tissue donors in accordance with the Declaration of Helsinki.
Cell lines
Acute lymphoblastic leukemia (ALL) cell lines used in this study were described previously.15 Briefly, 4 of the cell lines, Jurkat, MOLT4, MKB1, and KAWAI, are HTLV-1–negative human T-cell acute lymphoblastic leukemia (T-ALL) cell lines.17,18 Three cell lines, KOB, SO4, and KK1, are interleukin 2 (IL2)–dependent ATLL cell lines.19 ED, Su9T, and S1T are IL2-independent ATLL cell lines.20 MT2 and HUT102 are human T-cell lines transformed by HTLV-1 infection.21 CTLL2 is a murine IL2–dependent T-lymphoma cell line.22 All the cell lines were maintained in RPMI1640 medium supplemented with 10% fetal calf serum (FCS) and with or without IL2.
Cell culture and karyotype analysis
G-banding studies were performed as described previously.8 Briefly, leukemia cells were diluted in 10 mL RPMI1640 medium supplemented with 10% FCS at a final concentration of 106 cells/mL. The cells were cultured at 37°C for 24 to 48 hours in humidified air with 5% CO2, exposed to colcemid (0.05 mg/mL) for 60 minutes, processed in 0.075 M potassium chloride for 20 minutes, and fixed with methanol/glacial acetate (3:1). The chromosomes were treated with trypsin, stained with a Giemsa solution, and karyotyped according to the International System for Human Cytogenetic Nomenclature (ISCN 2005).23 The remaining chromosome pellets were stored at −20°C for SKY and fluorescence in situ hybridization (FISH) analyses.
SKY and DAPI banding analysis
The strategy of combined spectral karyotyping (SKY) and 4,6-diaminido-2-phenylindole dihydrochloride (DAPI) banding analysis of chromosome abnormalities was published24 and is briefly described as follows: The chromosomes prepared on a slide glass were denatured and hybridized with a cocktail probe mixture for 2 days at 37°C. The SKY probe mixture and hybridization reagents were purchased from Applied Spectral Imaging (Vista, CA), and signal detection was performed according to the manufacturer's protocol. The chromosomes were counterstained with DAPI combined with an antifade solution (Vectashield; Vector Laboratories, Burlingame, CA). Images were acquired by an SD200 Spectracube (Applied Spectral Imaging) mounted on an Olympus BX50-RF (Olympus, Tokyo, Japan) using a custom-designed optical filter (SKY-1; Chroma Technology, San Diego, CA). With another special optical filter, the inverted DAPI images were captured in conjunction with spectral classifications as QFH band patterns for the identification of chromosomal breakpoints. For each case, 10 to 20 metaphase spreads were analyzed, and karyotypes were described according to the ISCN 2005.23
FISH analysis
The plasmid library from sorted human chromosomes 10 (pBS10) was used as a whole chromosome painting (WCP) probe, labeled with digoxigenin-16-dUTP (Boehringer-Ingelheim, Ingelheim, Germany) by standard nick translation. BAC clones were labeled with biotin-16-dUTP (Sigma-Aldrich). Hybridization and signal detection were performed as described previously.25 A minimum of 50 nuclei was examined for each FISH. FISH analysis was performed on metaphase and interphase chromosomes by 53 BAC clones mapped to the chromosome bands 10p11-12 in the human genome mapping of NCBI (build 36 version 1)26 as probes.
High-density SNP array comparative genomic hybridization (array-CGH) analysis
Total genomic DNA was digested with XbaI, ligated to an adaptor, and subjected to polymerase chain reaction (PCR) amplification using a single primer. After treatment with DNase I, 40 μg of the PCR products was labeled with a biotinylated nucleotide analog and hybridized the microarray. SNP genotypes were scored with the GTYPE 4.1 software (Affymetrix, Santa Clara, CA). Chromosome copy number and LOH were calculated with 2 programs, ACUE 2.1 (Mitsui Knowledge Industry, Tokyo, Japan, http://bio.mki.co.jp/en/product/acue2/index.html) and CNAG 2.0 (Affymetrix).27 For data normalization, we used 6 normal reference samples. Genomic location of probes on the array was determined with the information in NCBI genome map build 35.1.26
Mice
C57BL/6 and ICR mice were purchased from CLEA Japan (Tokyo, Japan) and maintained under specific pathogen-free conditions. The targeted allele of the δEF1 gene, the murine orthologue of TCF8, lacks only the COOH-proximal zinc finger cluster domain.28 Approximately 20% of the homozygous TCF8 mutant mice were born alive and grew up to adulthood, although it was reported to cause a defect in the thymic T-cell development.28,29 To produce viable homozygous TCF8 mutant mice, we made their genetic backgrounds more heterogeneous by crossing the C57BL/6 background TCF8 mutant mice with the ICR outbred strain or F1 (C57BL/6 × C3H) mice.
Assay for cell proliferation
Control siRNA was purchased from Qiagen (Valencia, CA; AllStars Negative Control [ANC] siRNA) and the TCF8 siRNA was from Ambion (Austin, TX; murine TCF8; 5′-CCUGUGGAUUAUGAGUUCA-3′, human TCF8 5′-GGGUUACUUGUACACAGCU-3′). For the construction of vectors expressing TCF8, human TCF8 cDNA was subcloned into pCMV26 (Sigma-Aldrich). The cells were transiently transfected using the Nucleofector Kit (Amaxa, Gaithersburg, MD) according to the manufacturer's recommendations. The transfection efficiency, evaluated by fluorescence microscopy of green fluorescent protein, was more than 80%. Twenty-four hours after transfection, the expression of TCF8 protein in the cells was investigated by Western blotting, while for the cell proliferation studies, each transfectant was plated at a density of 4 × 10³ cells per well in 96-well microtiter plates. The cells were treated with various concentrations of transforming growth factor (TGF-β1; R&D Systems, Minneapolis, MN) for 72 hours and counted by the methyl thiazolyl tetrazolium (MTT) assay using Tetra color one assay kit (Seikagaku Kogyo, Tokyo, Japan). Each experiment was performed 3 times, and typical results are shown.
Results
Identification of a common hemizygous deletion in 10p11 in ATLL by mapping chromosomal breakpoints
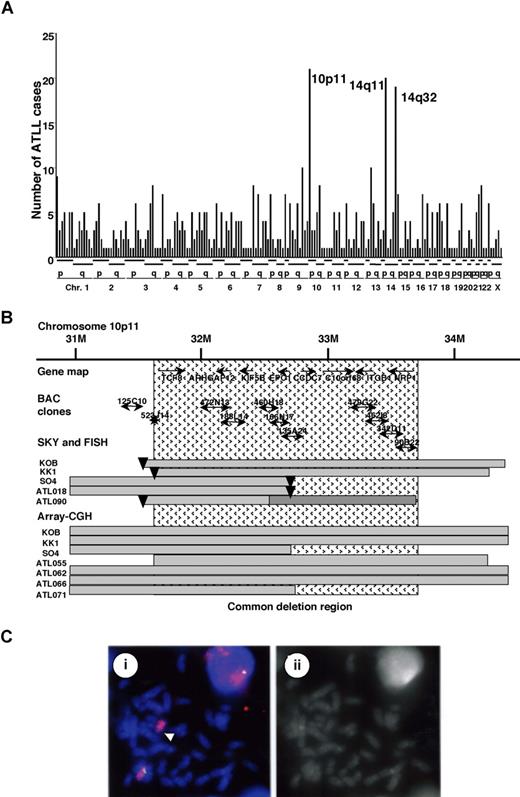
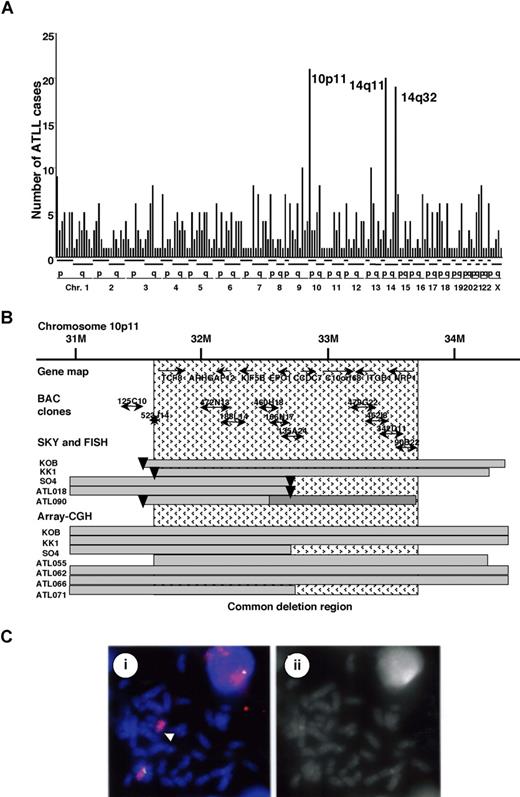
We recently studied recurrent chromosomal rearrangements in adult T-cell leukemia lymphoma (ATLL) cells from 61 patients by spectral karyotyping (T.H. et al, manuscript in preparation). In examining the molecular changes in ATLL cells, 605 chromosomal breakpoints in 61 cases were identified and precisely mapped by DAPI banding analysis. The frequency of the breakpoints was counted in each region of the chromosomes, with an average of around 10 translocations in each case (Figure 1A). Most of the chromosomal translocations were unbalanced, and a few recurrent reciprocal translocations were found. Chromosomal breakages were most frequently identified at 10p11 (21 [34.6%] of 61 cases), and they were also frequently represented at 14q11 and 14q32 regions (Figure 1A). Based on the data of SKY, these 3 events occurred almost independently; however, almost 50% of the cases with 14q32 abnormality demonstrated a 10p11.2 abnormality, suggesting that both events are interrelated chromosomal abnormalities. The 10p11 regions were translocated to more than 10 different partner chromosomal regions, such as 21q22, 13q14, and 14q32.
Mapping of the deletions at 10p11.2. (A) Mapping of the chromosomal breakpoints in whole chromosomes in acute-type ATLLs. An analysis of the chromosomal breakpoints was performed by spectral karyotyping (SKY), and all chromosomal breakpoints were mapped in each region of the chromosomes (x-axis), as indicated at the bottom. The y-axis shows the numbers of ATLL cases with the chromosomal breakpoints in each chromosomal region. Three regions, 10p11, 14q11, and 14q32, were frequently identified with chromosomal breakpoints. (B) Physical and transcriptional maps of the region containing the chromosomal deletion at 10p11. A FISH analysis was performed on metaphase and interphase chromosomes using 53 BAC clones mapped to the chromosome bands at 10p11-12 in the human genome map of NCBI (build 36 version 126 ) as probes. The bars indicate the region covering each BAC clone. Horizontal bars indicate the region with hemizygous deletions in each DNA sample from the ATLL cell lines or ATLL cells from patients, which were detected by SKY and FISH or array-CGH analyses. The inverted triangles indicate the regions of chromosomal breakpoints. Closed bars indicate the region of a homozygous deletion in a DNA sample from ATLL cells (ATL090). The hatch pattern represents the minimal heterozygous deletion at 10p11.2. TCF8 through NRP1 represent the names of the genes within the region in the human genome map of NCBI (build 36 version 126 ). (C) FISH validation of the RP11-188L14 probe to detect the hemizygous deletion of the chromosome10p11.2 in SO4 cell line. The RP11-188L14 probe was green (FITC) and the whole chromosome painting probe was red (TRITC). FISH with RP11-188L14 shows no signal on the abnormal chromosome 10 as indicated by the arrow (i), and a DAPI photograph corresponding to the FISH picture is shown on the right side (ii). Images were captured through the oil objective lens (100×) with a CCD camera (SenSys 0400-GI; Photometrics Ltd, Tucson, AZ). Subsequent image processing was performed with the Software IPLab version 2.4.0 (BD Biosciences Bioimaging, Rockville, MD).
Mapping of the deletions at 10p11.2. (A) Mapping of the chromosomal breakpoints in whole chromosomes in acute-type ATLLs. An analysis of the chromosomal breakpoints was performed by spectral karyotyping (SKY), and all chromosomal breakpoints were mapped in each region of the chromosomes (x-axis), as indicated at the bottom. The y-axis shows the numbers of ATLL cases with the chromosomal breakpoints in each chromosomal region. Three regions, 10p11, 14q11, and 14q32, were frequently identified with chromosomal breakpoints. (B) Physical and transcriptional maps of the region containing the chromosomal deletion at 10p11. A FISH analysis was performed on metaphase and interphase chromosomes using 53 BAC clones mapped to the chromosome bands at 10p11-12 in the human genome map of NCBI (build 36 version 126 ) as probes. The bars indicate the region covering each BAC clone. Horizontal bars indicate the region with hemizygous deletions in each DNA sample from the ATLL cell lines or ATLL cells from patients, which were detected by SKY and FISH or array-CGH analyses. The inverted triangles indicate the regions of chromosomal breakpoints. Closed bars indicate the region of a homozygous deletion in a DNA sample from ATLL cells (ATL090). The hatch pattern represents the minimal heterozygous deletion at 10p11.2. TCF8 through NRP1 represent the names of the genes within the region in the human genome map of NCBI (build 36 version 126 ). (C) FISH validation of the RP11-188L14 probe to detect the hemizygous deletion of the chromosome10p11.2 in SO4 cell line. The RP11-188L14 probe was green (FITC) and the whole chromosome painting probe was red (TRITC). FISH with RP11-188L14 shows no signal on the abnormal chromosome 10 as indicated by the arrow (i), and a DAPI photograph corresponding to the FISH picture is shown on the right side (ii). Images were captured through the oil objective lens (100×) with a CCD camera (SenSys 0400-GI; Photometrics Ltd, Tucson, AZ). Subsequent image processing was performed with the Software IPLab version 2.4.0 (BD Biosciences Bioimaging, Rockville, MD).
Therefore, we precisely mapped the chromosomal breakpoints at 10p11 in 3 ATLL cell lines (KK1, KOB, and SO4) and 2 primary ATLL cases (ATL018 and ATL090) by FISH. We identified der(10)t(10,22)(p11.2;q13.1) in KK1, der(10)t(10,14)(p11.2;q11.2) in KOB, der(10)t(2,10)(p23;p11.2) in SO4, t(10;21)(p11.2;q11.2) in ATL018, and t(10;13)(p11.2;q14) in ATL090 (Table S1, available on the Blood website; see the Supplemental Materials link at the top of the online article). Using 53 BAC clones on 10p as DNA probes for FISH (Table S2), the chromosomal breakpoints in these 5 cases were mapped to a 1-Mb region at 10p11.2 (Figure 1B). It was noted that the genomic deletions surrounding the chromosomal breakpoints were detected by a FISH analysis (Figure 1C) and heterozygous deletions of the 10p11.2 region with translocations were found in all 5 samples (Table S2; Figure 1B). Heterozygous deletions of approximately 2 to 8 Mb in the 10p11.2 region with translocations were found in all 5 samples. In addition, no FISH signals were detected in the 1-Mb region from RP11-135A24 to RP11-462L8 in ATL090, suggesting that a 10p11 region-specific homozygous deletion had occurred in this case (Figure 1B). Therefore, a minimal common region of chromosome deletions, including a region of homozygous deletion in ATL090, was mapped to a 2-Mb region from PR11-523J14 to RP11-342D11 (Figure 1B).
To confirm these results, we performed SNP array-CGH using DNA from 8 ATLL-related cell lines including KK1, KOB, SO4, and an additional 10 samples from acute-type ATLL patients. Deletions in 10p11.2, including the 2-Mb deletion region, were noted in 3 cell lines: KK1, KOB, and SO4, and an additional 4 patient samples (Figure 1B; Table S3). Using SNP array-CGH, the telomeric deleted regions in chromosome 10p11.2 in KOB and KK1 covered a wider area than those detected by FISH analysis, and each deleted region in the 3 cell lines and 4 patients samples covered the common deletion region. To combine these data, the same minimal common region of chromosome deletions, including regions of homozygous deletion in ATL090, was mapped to a 2-Mb region from PR11-523J14 to RP11-342D11 (Figure 1B), suggesting that a tumor suppressor gene possibly exists in this 2-Mb region in 10p11.2.
Down-regulation of TCF8 mRNA in ATLL cells
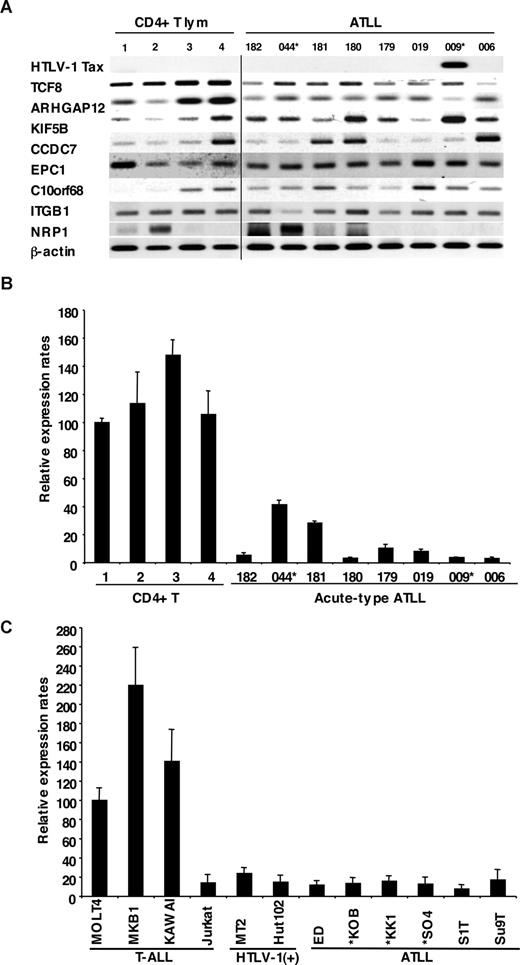
We examined the mRNA expression profiles of all 12 genes within the commonly deleted region in 10p11.2, which were identified by NCBI and Celera gene maps (Rockville, MD). Since mRNA samples from the ATLL patients used for the deletion mapping were not available, we initially used the mRNA expression profiles of the other 8 leukemia cell samples from acute-type ATLL patients by semiquantitative reverse-transcription PCR (RT-PCR), which had been previously identified by DNA microarray.15 Two leukemia samples from patients with ATLL had chromosome 10p11.2 abnormalities: t(10;15) (p11.2;q26) in ATL044 and monosomy 10 in ATL009 (Table S1). Expression levels of 8 genes (TCF8, ARHGAP12, KIF5B, CCDC7, EPC1, C10orf68, ITGB1 and NRP1) and HTLV-1 Tax as well as β-actin are shown in Figure 2A. The results showed that levels of TCF8 mRNA in ATLL cells had a tendency to be lower than those in CD4+ T lymphocytes from healthy volunteers, even though only 2 of 8 patients had chromosome 10p11.2 abnormalities. Other genes did not show any differences in expression level between the 2 groups. Expression profiles of the leukemia cells using a DNA microarray gave the same results (Figure S1), and quantitative real-time RT-PCR also showed that the expression level of TCF8 mRNA in ATLL cells was significantly lower than that in CD4+ T lymphocytes (Figure 2B).
Down-regulated expression of TCF8 in ATLL cells. (A) The expression profiles of the genes mapped within the deletion region at 10p11. Semiquantitative reverse-transcription PCR (RT-PCR) was performed to determine the expression of the genes mapped within the deletion region. TCF8, ARHGAP12, KIF5B, CCDC7, EPC1, C10orf68, ITGB1, and NRP1 showed a single band of amplified cDNA from CD4+ T lymphocytes from healthy volunteers as controls and from ATLL cells from the patients. A band of HTLV1 Tax was amplified from only 1 of 8 ATLL cells. A vertical line has been inserted to indicate a repositioned gel lane. (B) Quantitative RT-PCR analysis of TCF8 mRNA in 4 samples of CD4+ T lymphocytes from healthy volunteers and 8 samples of ATLL cells from the patients. The data were normalized to β-actin mRNA and calibrated to the TCF8/β-actin ratio (ΔCT) in the case of healthy volunteer no. 1, as a relative expression rate of 100. The data are the mean and standard deviation of 2−ΔΔCt in a duplicate assay. Two patients (indicated by *) have the chromosome 10p11.2 abnormalities. (C) Quantitative RT-PCR analysis of TCF8 mRNA in various types of T lymphoblastic leukemia cell lines. MOLT4, MKB1, KAWAI, and Jurkat are T-lymphoid leukemia cell lines; MT2 and HUT102 are HTLV-1–infected cell lines; and ED, KOB, KK1, SO4, S1T, and Su9T are ATLL cell lines. Three ATLL cell lines (indicated by *) showed the deletion of chromosome 10p11.2 with TCF8.
Down-regulated expression of TCF8 in ATLL cells. (A) The expression profiles of the genes mapped within the deletion region at 10p11. Semiquantitative reverse-transcription PCR (RT-PCR) was performed to determine the expression of the genes mapped within the deletion region. TCF8, ARHGAP12, KIF5B, CCDC7, EPC1, C10orf68, ITGB1, and NRP1 showed a single band of amplified cDNA from CD4+ T lymphocytes from healthy volunteers as controls and from ATLL cells from the patients. A band of HTLV1 Tax was amplified from only 1 of 8 ATLL cells. A vertical line has been inserted to indicate a repositioned gel lane. (B) Quantitative RT-PCR analysis of TCF8 mRNA in 4 samples of CD4+ T lymphocytes from healthy volunteers and 8 samples of ATLL cells from the patients. The data were normalized to β-actin mRNA and calibrated to the TCF8/β-actin ratio (ΔCT) in the case of healthy volunteer no. 1, as a relative expression rate of 100. The data are the mean and standard deviation of 2−ΔΔCt in a duplicate assay. Two patients (indicated by *) have the chromosome 10p11.2 abnormalities. (C) Quantitative RT-PCR analysis of TCF8 mRNA in various types of T lymphoblastic leukemia cell lines. MOLT4, MKB1, KAWAI, and Jurkat are T-lymphoid leukemia cell lines; MT2 and HUT102 are HTLV-1–infected cell lines; and ED, KOB, KK1, SO4, S1T, and Su9T are ATLL cell lines. Three ATLL cell lines (indicated by *) showed the deletion of chromosome 10p11.2 with TCF8.
To confirm these results, 12 T-ALL cell lines containing 6 ATLL cell lines (ED, KOB, KK1, SO4, S1T, and Su9T), 2 HTLV-1–infected T-cell lines (MT2 and HUT102), and 4 HTLV-1–uninfected T-ALL cell lines (Jurkat, MOLT4, MKB1, and KAWAI) were used for an expression study. Three cell lines (KOB, KK1, and SO4) revealed the deletion of chromosome 10p11.2 with TCF8. Although no other genes except TCF8 showed any change in expression level in these cell lines (Figure S2), the expression level of TCF8 was specifically down-regulated in all of the ATLL cell lines along with Jurkat cells by quantitative real-time RT-PCR (Figure 2C). These data suggest that TCF8 transcription might be down-regulated by epigenetic inactivation in most ATLL-related cell lines with Jurkat cells.
Increased expression of TCF8 by 5-aza-2′-deoxycytidine or trichostatin A in ATLL cell lines
To clarify whether DNA methylation and/or histone deacetylation of the TCF8 gene promoter were involved in the transcriptional repression of TCF8 in ATLL cell lines with Jurkat cells, 10 cell lines (2 T-ALL, 2 HTLV-1–infected, and 6 ATLL-derived cell lines) were cultured with (1) 10 μM 5-aza-2′-deoxycytidine (5-aza-dC), a DNA demethylating agent, for 72 hours, (2) 1.2 μM trichostatin A (TSA), an inhibitor of histone deacetylase, for 48 hours, or (3) 1.2 μM TSA for 48 hours following culture with 10 μM 5-aza-dC for 24 hours. After treatment with 5-aza-dC, TCF8 expression was up-regulated in 8 of 10 cell lines (Jurkat, MT2, HUT102, ED, KOB, KK1, S1T, and Su9T), with more than 3-fold activation (P < .05) as detected by real-time RT-PCR (Table 1). After treatment with TSA for 48 hours, the levels of TCF8 mRNA increased in 7 of 10 cell lines (Jurkat, MT2, HUT102, ED, KK1, S1T, and Su9T), also with more than 3-fold activation (P < .05). In addition, combination therapy induced TCF8 mRNA expression in 5 cell lines by more than 3-fold. Therefore, TCF8 mRNA expression was activated in 7 of 8 ATLL-related cell lines along with Jurkat cells by either 5-aza-dC or TSA treatment, suggesting that the down-regulation of TCF8 in most of the ATLL cell lines except SO4 cells with a chromosome 10p hemizygous deletion was dependent on epigenetic abnormalities.
Unmethylated putative TCF8 promoter in ATLL cell lines
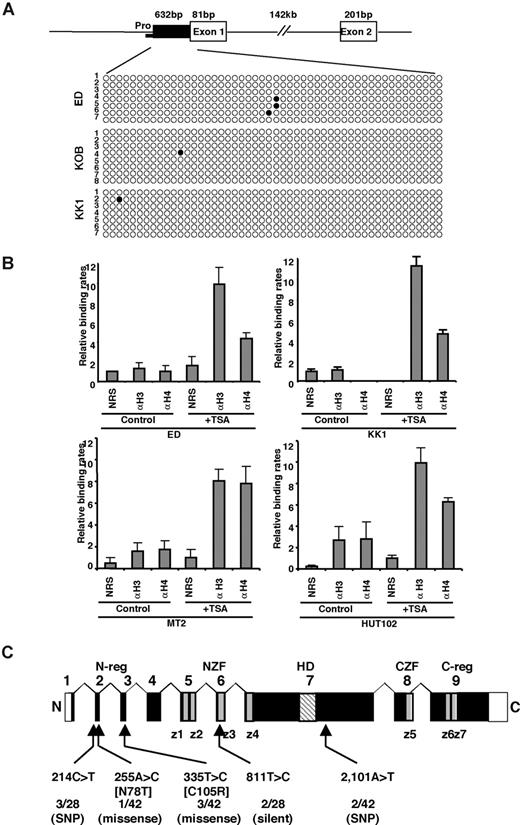
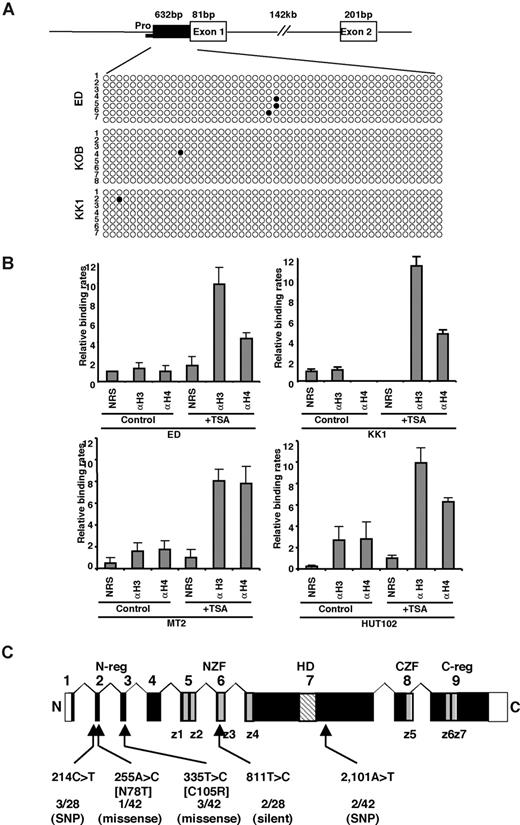
Next, we determined the methylation status of the TCF8 promoter by bisulfite sequencing. A CpG island containing 50 CpGs was amplified from a 632-bp region of the putative TCF8 promoter adjacent to exon 1 using 2 pairs of PCR primers and bisulfite-treated genomic DNA from 3 ATLL cell lines: ED, KOB, and KK1. However, the TCF8 promoter was not methylated in any of the 3 ATLL cell lines in which TCF8 expression was induced by 5-aza-dC (Figure 3A), suggesting that the CpG island was not a direct target for DNA methylation in ATLL cells. Moreover, TCF8 mRNA was up-regulated in various ATLL cell lines after treatment with hydralazine, which was reported to decrease DNA methyltransferase expression (Figure S3). This observation suggests that a transactivating regulator of TCF8 may be modulated by methylation or the other regulatory elements are located outside the TCF8 promoter. Such enhancer-related methylation events have been described for the imprinting of H19 and Igf2, p21WAF1 regulation by p73, and Apaf-1.30-33 Therefore, further analyses will be needed to determine the exact regulatory element near the TCF8 gene or to find a transactivating regulator of TCF8, which is directly methylated in ATLL cells.
Genetic and epigenetic abnormalities of the TCF8 gene in ATLL cells. (A) Bisulfite genomic sequencing of the TCF8 promoter region in 3 ATLL cell lines: ED, KOB, and KK1. PCR products amplified from bisulfite-treated DNA were subcloned, and 8 clones in each cell line were sequenced. ○ indicate unmethylated CpGs (Thy), and • indicate methylated CpGs (Cyt). The sequenced region contains 50 CpGs in 632 bp, just upstream from exon 1. Pro indicates a region of the TCF8 promoter for chromatin immunoprecipitation. (B) Specific DNA binding of acetylated histone H3 or H4 to the TCF8 promoter region detected by chromatin immunoprecipitation (ChIP). Two genomic DNA fragments containing every possible DNA-binding site, TCF8 promoter, or β-actin promoter were amplified from the genomic DNA of fixed ATLL-related cell lines (MT2, HUT102, ED, and KK1) after immunoprecipitation with normal rabbit serum (NRS) or with antiacetylated histone H3 or H4 antibodies (αH3 or αH4). Quantitative PCR data calibrated to the TCF8 promoter/β-actin ratio are shown in the NRS as a relative expression rate of 1. Data are the means plus or minus standard deviation of 2−ΔΔCt in a duplicate assay. Cell lines were cultured in RPMI1640 medium containing 10% FCS with (+ TSA) or without (control) 1.2 μM TSA. (C) Genomic structure of the TCF8 gene with a missense mutation and single nucleotide polymorphisms. Locations of the mutations and the single nucleotide polymorphisms relative to the exons encoding the functional domains are shown. TCF8 encodes a homeodomain (HD) flanked by 2 zinc-finger clusters (z1 to z4 and z5 to z7) (NZF indicates N-terminal zinc finger repeats, CZF; C-terminal zinc finger repeats). The N-terminal transcriptional regulatory domain (N-reg) could bind to p300/CBP and the C-terminal transcriptional regulator domain (C-reg) is the region where acidic amino acids are clustered just after the last zinc-finger domain. Values represent the number of mutated cases per total number of tested cases. SNP indicates single nucleotide polymorphism. White boxes represent noncoding regions in exons 1 and 9.
Genetic and epigenetic abnormalities of the TCF8 gene in ATLL cells. (A) Bisulfite genomic sequencing of the TCF8 promoter region in 3 ATLL cell lines: ED, KOB, and KK1. PCR products amplified from bisulfite-treated DNA were subcloned, and 8 clones in each cell line were sequenced. ○ indicate unmethylated CpGs (Thy), and • indicate methylated CpGs (Cyt). The sequenced region contains 50 CpGs in 632 bp, just upstream from exon 1. Pro indicates a region of the TCF8 promoter for chromatin immunoprecipitation. (B) Specific DNA binding of acetylated histone H3 or H4 to the TCF8 promoter region detected by chromatin immunoprecipitation (ChIP). Two genomic DNA fragments containing every possible DNA-binding site, TCF8 promoter, or β-actin promoter were amplified from the genomic DNA of fixed ATLL-related cell lines (MT2, HUT102, ED, and KK1) after immunoprecipitation with normal rabbit serum (NRS) or with antiacetylated histone H3 or H4 antibodies (αH3 or αH4). Quantitative PCR data calibrated to the TCF8 promoter/β-actin ratio are shown in the NRS as a relative expression rate of 1. Data are the means plus or minus standard deviation of 2−ΔΔCt in a duplicate assay. Cell lines were cultured in RPMI1640 medium containing 10% FCS with (+ TSA) or without (control) 1.2 μM TSA. (C) Genomic structure of the TCF8 gene with a missense mutation and single nucleotide polymorphisms. Locations of the mutations and the single nucleotide polymorphisms relative to the exons encoding the functional domains are shown. TCF8 encodes a homeodomain (HD) flanked by 2 zinc-finger clusters (z1 to z4 and z5 to z7) (NZF indicates N-terminal zinc finger repeats, CZF; C-terminal zinc finger repeats). The N-terminal transcriptional regulatory domain (N-reg) could bind to p300/CBP and the C-terminal transcriptional regulator domain (C-reg) is the region where acidic amino acids are clustered just after the last zinc-finger domain. Values represent the number of mutated cases per total number of tested cases. SNP indicates single nucleotide polymorphism. White boxes represent noncoding regions in exons 1 and 9.
Histone deacetylation is directly involved in down-regulation of TCF8 mRNA expression in ATLL cells
To confirm the correlation between reduced TCF8 mRNA expression and histone deacetylation, TCF8 expression and histone acetylation status were analyzed in the ATLL-related cell lines (MT2, HUT102, ED, and KK1) by chromatin immunoprecipitation (ChIP) after treatment with or without TSA. After treatment with TSA for 48 hours, the chromosomal DNA precipitated by antiacetylated histone H3 or H4 antibody was amplified with 2 sets of primers for the TCF8 promoter region or for the human β-actin promoter region (Figure 3B). Band intensities of the TCF8 promoter region in 4 cell lines were amplified 3- to 6-fold after treatment with TSA, indicating that histone deacetylation of the TCF8 promoter region was directly involved in the down-regulation of TCF8 mRNA expression in ATLL cells.
Identification of missense mutations in TCF8 in ATLL cells
We then searched for somatic TCF8 mutations in DNA samples from 34 patients with acute-type ATLL and 10 T-cell leukemia cell lines. Genomic PCR did not detect any homozygous deletions in any of the 9 coding exons of TCF8 in these samples. We detected 5 types of nucleotide substitutions, and all were heterozygous (Figure 3C). The 255A>C substitution in HUT102, creating a missense mutation (Asn78Thr) in exon 2, and the 335T>C substitution in the leukemia cells from 3 ATLL patients, creating a missense mutation (Cys105Arg) in exon 3, were likely to be somatic mutations (Table S4), since they were not detected in noncancerous cells from 95 Japanese volunteers.
The results of genomic and expression analysis indicate that the TCF8 gene is altered by several mechanisms, including hemizygous deletion, epigenetic dysregulation, and intragenic mutations. Regarding the ATLL-related cell lines, 3 of 9 showed hemizygous deletions of 10p11.2; 8 of 9 showed epigenetic dysregulation of the TCF8 gene; and 1 of 9 showed an intragenic mutation (Table 1). Therefore, TCF8 is a strong candidate tumor suppressor gene for ATLL leukemogenesis and is initially inactivated by unbalanced translocations with heterozygous deletion in the 10p11.2 region in ATLL cells.
Development of CD4+ T-cell lymphoma in TCF8 mutant mice
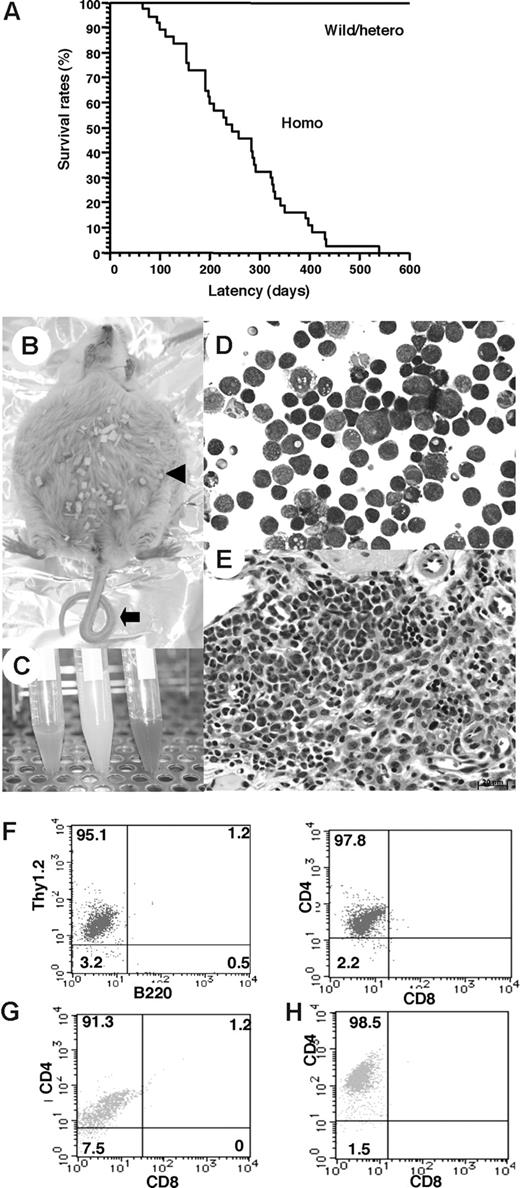
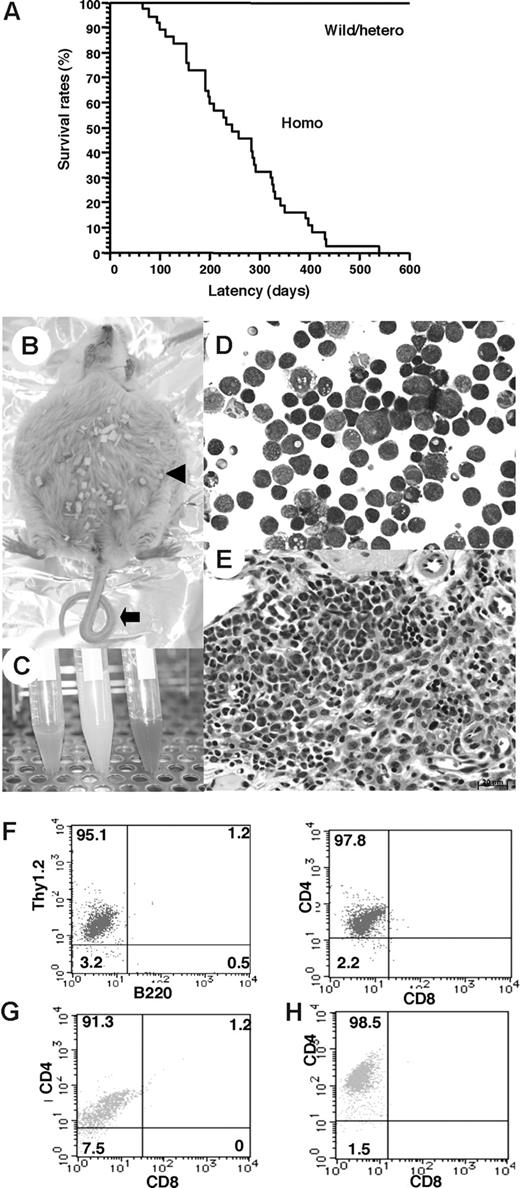
To determine whether down-regulation of the TCF8 gene could be a causative event for leukemogenic conversion of T lymphocytes to leukemia-lymphoma cells, we investigated δEF1 (mouse homologue of TCF8) gene-targeted mutant mice, which lack the COOH-proximal zinc finger clusters (δEF1ΔC-fin allele) and were reported to have a defect in the thymic T-cell development.28,29 Since 20% of the homozygous TCF8 mutant mice were born alive, we made their genetic backgrounds more heterogeneous by crossing the C57BL/6 background with the ICR or F1 (C57BL/6 × C3H) mice. Homozygous mice on a mixed genetic background were born with almost normal Mendelian frequencies (wild-type:heterozygote:homozygote = 60:91:42). After 4 months, almost half of the TCF8 homozygous mutant mice experienced enlargement of the abdomen due to ascites (27 [64.3%] of 42 mice), and many mice developed lymphomas with a median onset of disease of 30 weeks after birth and an earliest onset at 95 days after birth (Figure 4A). Half of the mice died within a year, and 84% of them developed fatal T-cell lymphomas. In TCF8 homozygous mutant mice, 2 types of lymphomas were observed: (1) peripheral lymphomas with or without ascites, and (2) thymic tumors. Typical pathological findings of 15 mice (no. 6 to no. 21) are shown in Table S5. In the peripheral lymphoma group, a large amount of bloody or milky ascitic fluid had collected in approximately 60% of the mice with invasion of various organs (Figure 4B,C). Numerous lymphoma cells with medium to large, cleaved or noncleaved nuclei were observed in the ascitic fluid (Figure 4D). Lymphoma cells had invaded various lymph nodes, including the thoracic, peripancreatic, mesenteric, perirenal, mesenteric, and other peripheral lymph nodes (Figure 4E). Fluorescence-activated cell sorter (FACS) analysis of the tumor cells showed that most of the lymphoma cells in the ascitic fluid and those that had invaded various organs were CD4+ SP T cells (Figure 4F-H).
Survival rates and pathologic findings in TCF8 mutant mice. (A) The survival rates of a cohort of wild-type (wild), TCF8 heterozygous (hetero), and TCF8 homozygous (homo) mutant mice were followed over the indicated period using Kaplan-Meier plots. (B) Gross photograph of TCF8 mutant mice with ascites (◀). Approximately 30% of TCF8-homologous mutant mice showed curled tail ( ). (C) Bloody or milky ascites was pooled. (D) May-Giemsa staining of tumor cells in ascites. Original magnification ×400. (E) Many lymphoma cells with medium- to large-sized nuclei infiltrated in the mesentery. Cells were examined using an Axioskop 2 plus inverted microscope (Carl Zeiss, Rugby, United Kingdom) and digital images were aquired using AxioCam camera and AxioVision 2.05 software (Carl Zeiss). Original magnification ×400. (F) Tumor cells from ascitic fluids were analyzed by staining with a combination of monoclonal antibodies, either Thy1.2-PE with B220-FITC (left) or CD4-PE with CD8-FITC (right) and FACS. (G,H) The tumor cells that invaded liver (G) or spleen (H) were analyzed by staining with a combination of monoclonal antibodies, CD4-PE with CD8-FITC.
Survival rates and pathologic findings in TCF8 mutant mice. (A) The survival rates of a cohort of wild-type (wild), TCF8 heterozygous (hetero), and TCF8 homozygous (homo) mutant mice were followed over the indicated period using Kaplan-Meier plots. (B) Gross photograph of TCF8 mutant mice with ascites (◀). Approximately 30% of TCF8-homologous mutant mice showed curled tail ( ). (C) Bloody or milky ascites was pooled. (D) May-Giemsa staining of tumor cells in ascites. Original magnification ×400. (E) Many lymphoma cells with medium- to large-sized nuclei infiltrated in the mesentery. Cells were examined using an Axioskop 2 plus inverted microscope (Carl Zeiss, Rugby, United Kingdom) and digital images were aquired using AxioCam camera and AxioVision 2.05 software (Carl Zeiss). Original magnification ×400. (F) Tumor cells from ascitic fluids were analyzed by staining with a combination of monoclonal antibodies, either Thy1.2-PE with B220-FITC (left) or CD4-PE with CD8-FITC (right) and FACS. (G,H) The tumor cells that invaded liver (G) or spleen (H) were analyzed by staining with a combination of monoclonal antibodies, CD4-PE with CD8-FITC.
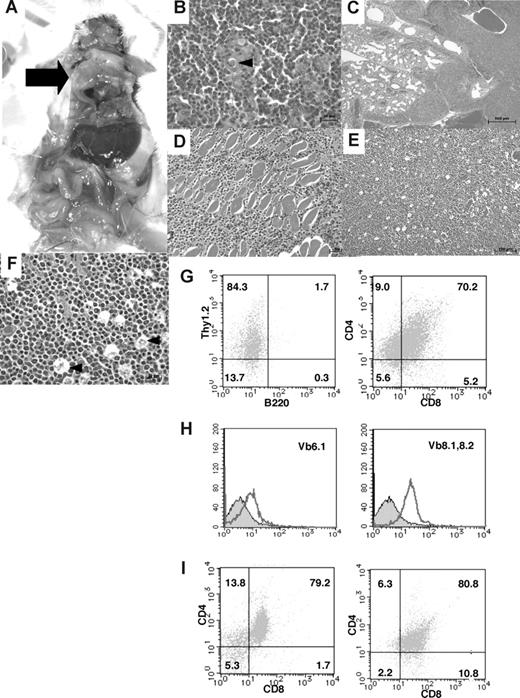
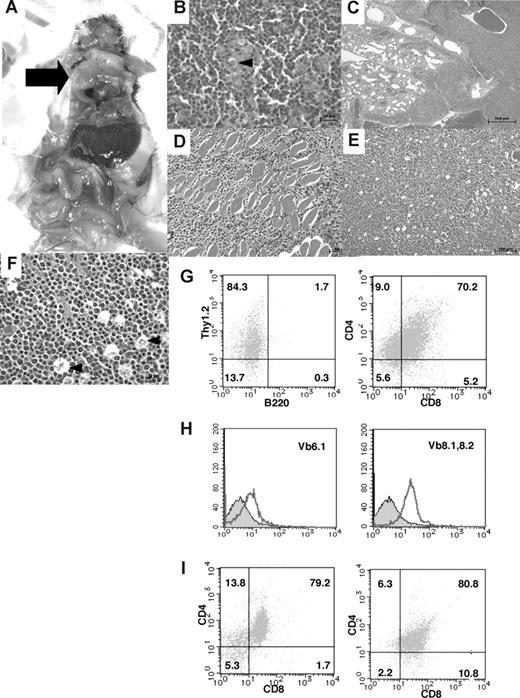
In the thymic tumor group, 16% of the homozygous mutant mice had large thymic tumors with a diameter of 1 to 3 cm (Figure 5A). Histologic analysis of the thymic tumors revealed that lymphoblastic lymphoma cells had densely proliferated in the cortex and medulla of the thymus (Figure 5B). Thymic lymphoma cells continuously invaded the lungs, chest wall, and pericardium (Figure 5C,D). In the peripheral lymph nodes, there was diffuse proliferation of monomorphic lymphoma cells focally mixed with tingible body macrophages, giving a “starry-sky” appearance (Figure 5E,F). In the thymic tumor group, surface marker analysis of thymic lymphoma cells revealed CD4+CD8+ DP T lymphoma cells (Figure 5G), which were negative for Vβ6.1 TCR and weakly positive for Vβ8.1-8.2 TCR with a single peak (Figure 5H). In this mouse, the mononuclear cells that invaded the liver, as well as a majority of the cells that invaded the spleen, were DP T lymphoma cells (Figure 5I). Therefore, in the same mouse, both tumor cells derived from the thymus and those that had invaded the organs were revealed to be DP T lymphoma cells. Moreover, the remaining mice with large thymic tumors showed the same CD4+CD8+ DP T lymphoma cells. In total, 84% of the T-cell tumors in TCF8 homologous mutant mice could be classified as CD4+ SP T-cell lymphoma, and 16%, as CD4+CD8+ DP thymic T-cell lymphoma. CD8+ SP T lymphomas were never observed. Thus, the histopathological and cellular findings revealed that CD4+ T-cell lymphoma/leukemia developed in most TCF8 mutant mice.
Pathological findings of TCF8 mutant mice. (A) Gross autopsy of TCF8 mutant mice with thymic tumors. A large thymic tumor ( ) was observed at the mediastinum of the dissected mouse. (B) Hematoxylin and eosin staining of tumor sections from the mouse as indicated. The normal thymic cellular architecture in the TCF8 mutant mice is replaced with monotonous fields of large, highly mitotic lymphoblasts with small Hassall bodies (◀). The scale bar indicates 20 μm. Original magnification ×400. (C) The tumor cells invaded the lung, vascular tissues, and heart in the mouse. The scale bar indicates 500 μm. Original magnification ×25. (D) The tumor cells invaded the muscular tissues of the chest wall. The scale bar indicates 50 μm. Original magnification ×200. (E) Hematoxylin and eosin staining of peripheral lymph nodes. Tumor cells showed a diffuse proliferation of monomorphic lymphoma cells, focally mixed with tingible body macrophages (“starry-sky appearance”) (◀). The scale bar indicates 100 μm. Original magnification ×100. (F) Hematoxylin and eosin staining of peripheral lymph nodes. The scale bar indicates 20 μm. Original magnification ×400. (G) Tumor cells from the thymic tumor were analyzed by staining with a combination of monoclonal antibodies, either Thy1.2-PE with B220-FITC (left) or CD4-PE with CD8-FITC (right) and FACS. (H) The tumor cells of the CD3+B220− population did not express Vβ6.1 TCR (left), but showed weak expression of Vβ8.1-8.2 TCR (right). (I) Tumor cells from the liver (left) or spleen (right) were analyzed by staining with a combination of monoclonal antibodies, CD4-PE and CD8-FITC.
Pathological findings of TCF8 mutant mice. (A) Gross autopsy of TCF8 mutant mice with thymic tumors. A large thymic tumor ( ) was observed at the mediastinum of the dissected mouse. (B) Hematoxylin and eosin staining of tumor sections from the mouse as indicated. The normal thymic cellular architecture in the TCF8 mutant mice is replaced with monotonous fields of large, highly mitotic lymphoblasts with small Hassall bodies (◀). The scale bar indicates 20 μm. Original magnification ×400. (C) The tumor cells invaded the lung, vascular tissues, and heart in the mouse. The scale bar indicates 500 μm. Original magnification ×25. (D) The tumor cells invaded the muscular tissues of the chest wall. The scale bar indicates 50 μm. Original magnification ×200. (E) Hematoxylin and eosin staining of peripheral lymph nodes. Tumor cells showed a diffuse proliferation of monomorphic lymphoma cells, focally mixed with tingible body macrophages (“starry-sky appearance”) (◀). The scale bar indicates 100 μm. Original magnification ×100. (F) Hematoxylin and eosin staining of peripheral lymph nodes. The scale bar indicates 20 μm. Original magnification ×400. (G) Tumor cells from the thymic tumor were analyzed by staining with a combination of monoclonal antibodies, either Thy1.2-PE with B220-FITC (left) or CD4-PE with CD8-FITC (right) and FACS. (H) The tumor cells of the CD3+B220− population did not express Vβ6.1 TCR (left), but showed weak expression of Vβ8.1-8.2 TCR (right). (I) Tumor cells from the liver (left) or spleen (right) were analyzed by staining with a combination of monoclonal antibodies, CD4-PE and CD8-FITC.
Down-regulation of TCF8 expression is associated with TGF-β1 resistance in ATLL cells
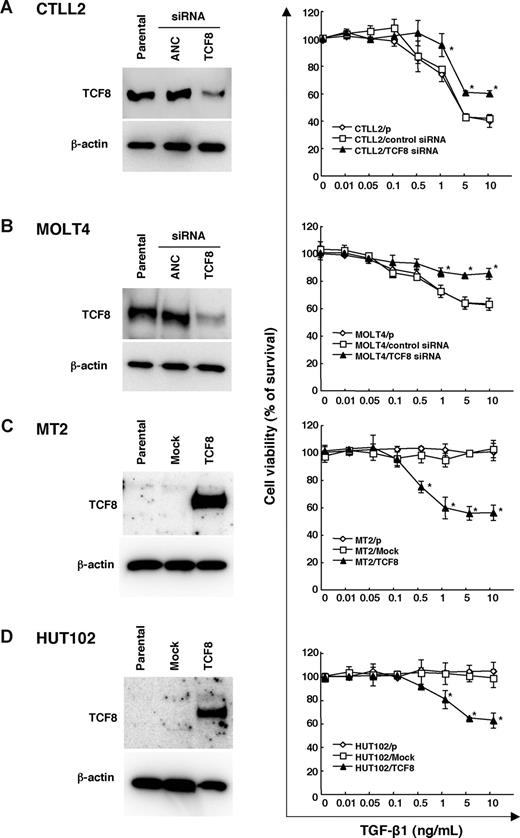
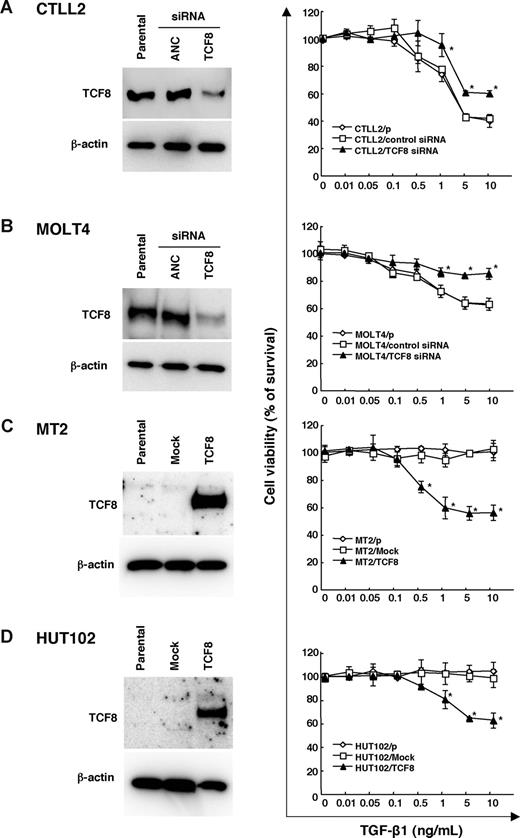
The TGF-β superfamily is known to inhibit the lineage commitment of double-positive (DP) cells toward CD4+ T-cell differentiation.34 Interestingly, the ATLL cells were found to be resistant to growth inhibition by TGF-β1, even with high levels of TGF-β1 expression,35-37 suggesting that ATLL cells may have developed several mechanisms of resistance to escape the antiproliferative and inactivating signal mediated by TGF-β1, including Tax through activation of the JNK/c-Jun pathway38,39 or MEL1S expression.37 Since TCF8 is reported to synergize with Smad proteins to activate TGF-β1 signal transduction,40,41 we investigated whether the down-regulation of TCF8 expression was associated with resistance to TGF-β1–mediated growth inhibition in ATLL cells. Thereafter, either TCF8 or ANC siRNA was introduced into a murine IL2–dependent T-lymphoma cell line, CTLL2, and human T-ALL cell line, MOLT4. Western blot analyses revealed the TCF8 expression in the siRNA-treated cells to be less than half of that in the control cells, while the viable cell curves of both cell lines treated with TCF8 siRNA exhibited a significantly higher resistance to TGF-β1 than those of the control cells (Figure 6A,B). Next, the TCF8 expression plasmid was transiently introduced into 2 HTLV-1–infected T-cell lines (MT2 and HUT102) and up to 40% of the TCF8 transfectants died after TGF-β1 treatment in a dose-dependent manner, whereas the parental and transfectants with mock plasmid did not die with TGF-β1 treatment at all (Figure 6C,D). These results indicate that down-regulation of TCF8 expression is one of the mechanisms of TGF-β1 resistance in ATLL cells, suggesting that CD4+ T lymphoma cells might escape from negative selection due to reduced TGF-β1 responsiveness.
TGF-β1 responsiveness in various leukemia cell lines with the up- or down-regulation of TCF8 expression. (A,B) The down-regulation of the TCF8 protein by TCF8 siRNA. The CTLL2 (A) and MOLT4 (B) cell lines were transfected with either TCF8 or the AllStars Negative Control (ANC) siRNAs and then were incubated for 24 hours. The levels of TCF8 protein were examined in each cell line by Western blotting (left panel). After transfection with siRNAs, the cells were treated with the indicated concentrations of TGF-β1 for 72 hours. The degree of proliferation of each cell line was examined by MTT assay. The results are shown as percentages of the values obtained from the control TGF-β1–free culture (right panel). A ◇ represents parental cells, □ represents cells treated with ANC siRNA, and ▴ represents cells treated with TCF8 siRNA. Student t test (P < .05) was used for the statistical analysis. (C,D) The enforced expression of TCF8 in HTLV-1–infected cell lines. The TCF8 protein levels were examined in each MT-2 (C) and HUT102 (D) cell transfected with a mock or TCF8 expression plasmid after 24 hours by Western blotting (left panel). The cells were treated with the indicated concentrations of TGF-β1 for 72 hours and the proliferation of each was examined by MTT assay. The results are shown as percentages of the values obtained from the control TGF-β1–free culture (right panel). Parental cells (◇), mock vector-transfected cells (□), and TCF8 expression plasmid-transfected cells (▴). All data are the means plus or minus standard deviation in a duplicate assay. Student t test (P < .05) was used for the statistical analysis.
TGF-β1 responsiveness in various leukemia cell lines with the up- or down-regulation of TCF8 expression. (A,B) The down-regulation of the TCF8 protein by TCF8 siRNA. The CTLL2 (A) and MOLT4 (B) cell lines were transfected with either TCF8 or the AllStars Negative Control (ANC) siRNAs and then were incubated for 24 hours. The levels of TCF8 protein were examined in each cell line by Western blotting (left panel). After transfection with siRNAs, the cells were treated with the indicated concentrations of TGF-β1 for 72 hours. The degree of proliferation of each cell line was examined by MTT assay. The results are shown as percentages of the values obtained from the control TGF-β1–free culture (right panel). A ◇ represents parental cells, □ represents cells treated with ANC siRNA, and ▴ represents cells treated with TCF8 siRNA. Student t test (P < .05) was used for the statistical analysis. (C,D) The enforced expression of TCF8 in HTLV-1–infected cell lines. The TCF8 protein levels were examined in each MT-2 (C) and HUT102 (D) cell transfected with a mock or TCF8 expression plasmid after 24 hours by Western blotting (left panel). The cells were treated with the indicated concentrations of TGF-β1 for 72 hours and the proliferation of each was examined by MTT assay. The results are shown as percentages of the values obtained from the control TGF-β1–free culture (right panel). Parental cells (◇), mock vector-transfected cells (□), and TCF8 expression plasmid-transfected cells (▴). All data are the means plus or minus standard deviation in a duplicate assay. Student t test (P < .05) was used for the statistical analysis.
Discussion
We demonstrated that in ATLL cells, the TCF8 gene was mainly epigenetically inactivated in a majority of ATLL cells. In addition, TCF8 (or δEF1ΔC-fin homozygous) mutant mice frequently developed CD4+ T-cell lymphoma and/or leukemia after a few months. These findings indicate that TCF8 has a tumor suppressor role in ATLL. Since the heterozygous TCF8 mutant mice did not develop any tumors and the level of TCF8 expression in some ATLL cells was approximately 30% to 40% of that observed in the control CD4 lymphocytes, TCF8 may therefore be involved in only some and not all of ATLL development. On the other hand, it is reported that TCF8 overexpressed in colorectal or breast cancer cells induces epithelial-mesenchymal transition (EMT) with the development of metastatic properties such as migration and invasion in vitro and in vivo.42 Therefore, TCF8 has dual functions in cancer progression, which are dependent on the type of the tumors, such as WT1 or TSLC1 tumor suppressor genes.43,44
It was previously reported that TCF8 mutant mice had a defect in T-cell development in the first week of life.28 At the early stage of development, intrathymic c-kit+ T precursor cells in these mice were depleted to just 1% of the level in normal mice, and the number of CD8+ SP T cells was significantly reduced relative to the number of CD4+ SP T cells. These observations indicate that TCF8 is involved in the regulation of T-cell development at multiple stages. Lymphoma cells in TCF8 mutant mice showed either CD4+ SP T cells or DP T cells after 6 months. Interestingly, TGF-β1 was important for regulating T-cell development in the thymus and for negative selection at the late stage of differentiation of DP T cells to CD4+ SP cells.34 Recently, DNA microarray analysis identified a higher level of TCF8 expression in DP thymocytes to CD4+ SP T cells,45 suggesting that TCF8 enhanced negative selection due to TGF-β1 responsiveness. Moreover, TGF-β1–deficient mice had an increased number of CD4+ SP T cells and a decreased number of CD8+ SP T cells.46,47 By correlating the development of CD4+ SP T-lymphoma cells in TCF8 mutant mice with the increase in the number of CD4+ T cells in TGF-β1–deficient mice, we concluded that leukemogenesis in TCF8 mutant mice was partly dependent on resistance to TGF-β1.
TCF8 is an E-box–binding transcription factor reported to regulate many genes. We found that the transcription of CD4, α4 integrin, and GATA-3, which was reported to be suppressed by TCF8,48 was up-regulated in ATLL cells (data not shown). It was therefore suggested that impaired regulation of TCF8 expression in ATLL induced the increase in expression of CD4 and GATA3, which was crucial for the establishment of the ATLL phenotype in CD4+ SP helper T lymphocytes. Moreover, TCF8 was reported to regulate p73, CCNG2, or p130.49,50 Since these genes are very important for cell-cycle progression and apoptosis, further investigation is needed to determine which ones are directly related to leukemogenesis among those regulated by TCF8.
The phenotypes of T-cell lymphomas in TCF8 mutant mice were very similar to those of ATLL patients. In TCF8 mutant mice, the tumor cells were mainly CD4+ SP or DP T cells, which invaded various organs, such as the liver, spleen, and lungs. In ATLL, the tumor cells were mainly CD4+ SP T cells that also invaded various organs. One difference, however, was that thymic lymphomas developed in the TCF8 mutant mice, which has not been reported in ATLL cases. Another difference is that lymphoma cells in TCF8 mutant mice did not have multilobulated nuclei. Such nuclei result from alterations in the PI3-kinase signaling cascades,51 suggesting that down-regulation of TCF8 expression is not related to the PTEN signaling pathway and that other mutations are necessary for the development of ATLL. This is the first report illustrating the importance of the disruption of TCF8 in leukemogenesis of ATLL.
The online version of this article contains a data supplement.
The publication costs of this article were defrayed in part by page charge payment. Therefore, and solely to indicate this fact, this article is hereby marked “advertisement” in accordance with 18 USC section 1734.
Acknowledgments
We thank Drs M. Shiraga, I. Nishikata, and T. Uetsuki for technical assistance and advice on the paper.
This work was supported by Grants-in-Aid for Scientific Research of Priority Area and for 21st Century COE program (Life science) from the Ministry of Education, Culture, Sports, Science and Technology, Japan Leukemia Research fund, and Research fund from Miyazaki Prefecture Collaboration of Regional Entities for the Advancement of Technological Excellence, Japan Science and Technology Corporation.
Authorship
Contribution: T.H., S.N., and K.H. designed and performed experiments, analyzed data, and drafted the paper; M.H. performed experiments; T.K., Y.A., T.T., K.N., and M.T. performed experiments and data analysis; Y.A. and R.Y. performed the histopathology; K.Y., A.O., and H.T. collected case material and supervised the project; J.Y. and Y.H. supervised the project and drafted the paper; K.M. designed the experiments, analyzed data, and drafted the paper.
Conflict-of-interest disclosure: The authors declare no competing financial interests.
Correspondence: Kazuhiro Morishita, Division of Tumor and Cellular Biochemistry, Department of Medical Sciences, Faculty of Medicine, University of Miyazaki, 5200 Kihara, Kiyotake, Miyazaki, Japan, 889-1692; e-mail: kmorishi@med.miyazaki-u.ac.jp.
References
Author notes
*T.H., S.N., and K.H. contributed equally to this paper.



 ). (C) Bloody or milky ascites was pooled. (D) May-Giemsa staining of tumor cells in ascites. Original magnification ×400. (E) Many lymphoma cells with medium- to large-sized nuclei infiltrated in the mesentery. Cells were examined using an Axioskop 2 plus inverted microscope (Carl Zeiss, Rugby, United Kingdom) and digital images were aquired using AxioCam camera and AxioVision 2.05 software (Carl Zeiss). Original magnification ×400. (F) Tumor cells from ascitic fluids were analyzed by staining with a combination of monoclonal antibodies, either Thy1.2-PE with B220-FITC (left) or CD4-PE with CD8-FITC (right) and FACS. (G,H) The tumor cells that invaded liver (G) or spleen (H) were analyzed by staining with a combination of monoclonal antibodies, CD4-PE with CD8-FITC.
 ) was observed at the mediastinum of the dissected mouse. (B) Hematoxylin and eosin staining of tumor sections from the mouse as indicated. The normal thymic cellular architecture in the TCF8 mutant mice is replaced with monotonous fields of large, highly mitotic lymphoblasts with small Hassall bodies (◀). The scale bar indicates 20 μm. Original magnification ×400. (C) The tumor cells invaded the lung, vascular tissues, and heart in the mouse. The scale bar indicates 500 μm. Original magnification ×25. (D) The tumor cells invaded the muscular tissues of the chest wall. The scale bar indicates 50 μm. Original magnification ×200. (E) Hematoxylin and eosin staining of peripheral lymph nodes. Tumor cells showed a diffuse proliferation of monomorphic lymphoma cells, focally mixed with tingible body macrophages (“starry-sky appearance”) (◀). The scale bar indicates 100 μm. Original magnification ×100. (F) Hematoxylin and eosin staining of peripheral lymph nodes. The scale bar indicates 20 μm. Original magnification ×400. (G) Tumor cells from the thymic tumor were analyzed by staining with a combination of monoclonal antibodies, either Thy1.2-PE with B220-FITC (left) or CD4-PE with CD8-FITC (right) and FACS. (H) The tumor cells of the CD3+B220− population did not express Vβ6.1 TCR (left), but showed weak expression of Vβ8.1-8.2 TCR (right). (I) Tumor cells from the liver (left) or spleen (right) were analyzed by staining with a combination of monoclonal antibodies, CD4-PE and CD8-FITC.