Abstract
T-cell large granular lymphocyte (LGL) leukemia is characterized by clonal expansion of CD3+CD8+ cells. Leukemic LGLs correspond to terminally differentiated effector-memory cytotoxic T lymphocytes (CTLs) that escape Fas-mediated activation-induced cell death (AICD) in vivo. The gene expression signature of peripheral blood mononuclear cells from 30 LGL leukemia patients showed profound dysregulation of expression of apoptotic genes and suggested uncoupling of activation and apoptotic pathways as a mechanism for failure of AICD in leukemic LGLs. Pathway-based microarray analysis indicated that balance of proapoptotic and antiapoptotic sphingolipid-mediated signaling was deregulated in leukemic LGLs. We further investigated sphingolipid pathways and found that acid ceramidase was constitutively overexpressed in leukemic LGLs and that its inhibition induced apoptosis of leukemic LGLs. We also showed that S1P5 is the predominant S1P receptor in leukemic LGLs, whereas S1P1 is down-regulated. FTY720, a functional antagonist of S1P-mediated signaling, induced apoptosis in leukemic LGLs and also sensitized leukemic LGLs to Fas-mediated death. Collectively, these results show a role for sphingolipid-mediated signaling as a mechanism for long-term survival of CTLs. Therapeutic targeting of this pathway, such as use of FTY720, may have efficacy in LGL leukemia.
Introduction
T-cell large granular lymphocyte (LGL) leukemia is characterized by abnormal clonal expansion of postthymic CD3+CD8+ cells.1 Previous work suggests that these cells represent antigen-primed mature effector cells of the adaptive immune system. It is believed that chronic activation of T lymphocytes with autoantigen or viral antigen may serve as an initial stimulus for the expansion of leukemic cells.2,3 We and others have shown that leukemic LGLs represent effector-memory cells of cytotoxic T lymphocyte (CTL) origin.4,5 Clinically, up to 60% of LGL leukemia patients have associated autoimmune conditions such as rheumatoid arthritis, systemic lupus erythematosus, and Sjögren syndrome.6,7 Thus, LGL leukemia stands at an intersection of dysregulation in cell growth (cancer) and immunity (autoimmunity).
Normally, antigenic stimulation results in clonal expansion of naive CD8+ T cells and their differentiation into the effector cells known as CTLs. Subsequently, contraction ensues resulting in the loss of most of the antigen-specific effector cells and prolonged survival of few “memory” cells. This contraction phase, termed as activation-induced cell death (AICD), is a result of Fas-dependent apoptosis specific to antigen-primed CTLs.8 Leukemic LGLs, unlike activated normal T lymphocytes, are resistant to apoptosis despite expressing high levels of both Fas and FasL. Mechanisms of resistance to apoptosis are not completely understood, although it has been shown that dysregulation of survival pathways contributes to such resistance.9-12
The objective of this study was to use global gene expression profiling to identify the unique “molecular signature” of leukemic LGLs. We were particularly interested in identifying potential survival pathways that might render leukemic LGLs resistant to AICD. We analyzed microarray data using “theme-based” bioinformatics approaches such as Expression Analysis Systematic Explorer (EASE)13 and Gene Set Enrichment Analysis (GSEA).14 Pathway-based microarray analysis using GSEA identified genes related to sphingolipid metabolism and G-protein signaling pathways (Gα12-related pathway) to be differentially expressed in leukemic LGLs. These pathways were of particular interest since our laboratory discovered the human sphingosine 1-phosphate (S1P) receptor-5 (S1P5). S1P5 was cloned from an LGL leukemia library following initial identification as an expressed sequence tag (EST) overexpressed in LGL leukemia.15 Whether sphingolipid signaling plays any role in apoptosis of CTLs in vivo, and consequently in long-term survival of CTLs, is not known.
Sphingolipid biosynthetic pathway is an intricate pathway with many rapidly interchangeable intermediate metabolites. A proapo-ptotic sphingolipid, ceramide, can be synthesized in vivo by condensation of serine and palmytoyl CoA (de novo synthesis) or from sphingomyelin (catabolic pathway). Sphingosine cannot be synthesized de novo and can be derived only from ceramide hydrolysis. Sphingosine can further be phosphorylated to make sphingosine-1-phosphate (S1P). Ceramide and S1P are potent second messenger molecules with opposite biologic functions. Whereas ceramide and its analogues are considered proapoptotic, S1P promotes cell survival and growth. Cell fate is determined, not by the absolute levels of these metabolites, but the ratio of prosurvival to proapoptotic molecules (sphingolipid rheostat).16,17
We hypothesized that altered sphingolipid-mediated signaling is important for survival of leukemic LGLs. As there is no known curative therapy for patients with LGL leukemia, identification of potential therapeutic targets is important. Therefore, we tested a series of inhibitors in the sphingolipid pathway to functionally validate its importance in survival of leukemic LGLs. Inhibitors of enzymes leading to synthesis of ceramide in either de novo or catabolic pathways did not induce apoptosis in leukemic LGLs. In contrast, perturbation of the pathway central to sphingolipid rheostat and S1P-mediated signaling induced apoptosis in leukemic LGLs. In support of our microarray data, we found that acid ceramidase was up-regulated in leukemic LGLs and that inhibition of acid ceramidase by N-oleoylethanolamine (NOE) differentially induced apoptosis in leukemic LGLs. Moreover, inhibition of S1P mediated signaling using FTY720-induced apoptosis in leukemic LGLs, whereas normal LGLs were resistant to the treatment. Our results also show that FTY720 treatment sensitizes leukemic LGLs to Fas-mediated apoptosis, whereas S1P treatment renders normal activated peripheral blood mononuclear cells (PBMCs) resistant to Fas-mediated apoptosis. Thus, our results strongly suggest that differential sphingolipid-mediated signaling is important for survival of leukemic LGLs. Our results also indicate that FTY720 may have therapeutic utility in LGL leukemia.
Methods
Patient consent
All patients met the clinical criteria of T-cell (CD3+) LGL leukemia with increased LGL counts and clonal T-cell receptor (TCR) gene rearrangement and had not received treatment for LGL leukemia. Informed consents were signed by all patients and age- and sex-matched healthy individuals to allow the use of their cells for these experiments. Buffy coats were obtained from Hershey Medical Center Blood Bank according to protocols observed by Milton S. Hershey Medical Center (Hershey, PA). Informed consent was obtained in accordance with the Declaration of Helsinki.
Chemicals and reagents
Reagents and chemicals including phytohemagglutinin (PHA), TRIzol, RPMI-1640 with Glutamax, and fetal bovine serum were obtained from Invitrogen (Carlsbad, CA) and used according to the manufacturer's instructions. Human CD8 cell Immunocolumn was obtained from Cedarlane Labs (Burlington, NC). N-oleoylethanolamine (NOE) was purchased from Calbiochem (San Diego, CA). FTY720 was purchased from Cayman Chemical (Ann Arbor, MI), and d-erythro-sphingosine-1-phosphate (S1P) was purchased from Avanti Polar Lipids (Alabaster, AL). The following reagent was obtained through the AIDS Research and Reference Reagent Program, Division of AIDS, National Institute of Allergy and Infectious Diseases (NIAID), National Institutes of Health (NIH, Bethesda, MD): human rIL-2 from Dr Maurice Gately, Hoffmann-La Roche (Nutley, NJ).18
Antibodies
Anti-Fas antibody (activating, human CH11 clone) was obtained from Upstate Cell Signaling Solutions (Lake Placid, NY); annexin V: PE Apoptosis Detection Kit-I, CD3-APC, CD8-FITC, CD57-FITC with respective isotype controls, and monoclonal antibody to acid ceramidase were obtained from BD Biosciences (San Jose, CA).
Cell culture and CD8+ T-cell enrichment
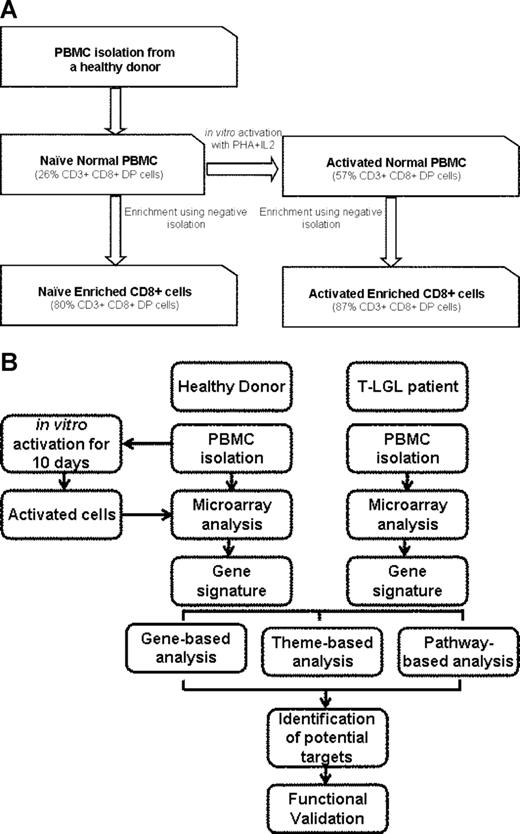
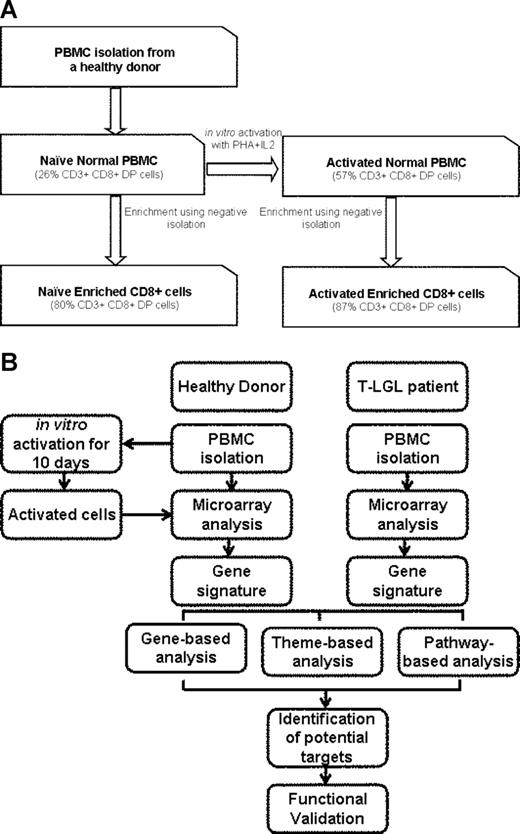
Buffy coats of healthy donors were either used for RNA isolation or enriched for CD8+ cells using Human CD8 cell Immunocolumn. These samples are referred to as “naive normal PBMCs” and “naive normal enriched CD8+,” respectively. PBMCs (5 × 10⁷) were cultured in RPMI-1640 with Glutamax supplemented with 10% fetal bovine serum in presence of PHA (1 μg/mL) for 3 days followed by IL-2 (500 IU/mL) for 7 days. These cells are referred to as “activated normal PBMCs.” A high dose of IL-2 resulted in preferential proliferation of CD3+CD8+ cells. At the end of 10 days, a fraction of cells was subjected to CD8+ enrichment using Human CD8 cell Immunocolumn. Enriched CD8+ cells are referred to as “activated normal enriched CD8+” (Figure 1). We chose this method for activation as it is consistent with induction of activation-induced cell death in vitro culture. LGL leukemia patient PBMCs were isolated from patient blood samples and studied without culturing, sorting, or activation in vitro.
Preparation of samples and experimental procedure. (A) Freshly isolated PBMCs from healthy individuals (naive normal PBMCs) were enriched for CD8+ T cells using negative isolation (naive normal enriched CD8+ cells) as described in “Methods.” Cells (5 × 10⁷) were activated using 1 μg/mL PHA for 3 days followed by 500 IU/mL IL2 for 7 days (activated normal PBMCs). Following activation, 108 cells were enriched for CD8+ cells (activated normal enriched CD8+ cells). Percentage of CD3+CD8+ cells is shown in parentheses. (B) Experimental procedure: The samples were used for RNA isolation and subjected to microarray analysis. LGL leukemia PBMCs were obtained fresh from the patients and were not cultured, sorted, or activated. The samples with similar phenotype were either pooled (pooled sample analysis) or analyzed without pooling (unpooled sample analysis). Genes differentially expressed in both analyses were considered to be differentially expressed.
Preparation of samples and experimental procedure. (A) Freshly isolated PBMCs from healthy individuals (naive normal PBMCs) were enriched for CD8+ T cells using negative isolation (naive normal enriched CD8+ cells) as described in “Methods.” Cells (5 × 10⁷) were activated using 1 μg/mL PHA for 3 days followed by 500 IU/mL IL2 for 7 days (activated normal PBMCs). Following activation, 108 cells were enriched for CD8+ cells (activated normal enriched CD8+ cells). Percentage of CD3+CD8+ cells is shown in parentheses. (B) Experimental procedure: The samples were used for RNA isolation and subjected to microarray analysis. LGL leukemia PBMCs were obtained fresh from the patients and were not cultured, sorted, or activated. The samples with similar phenotype were either pooled (pooled sample analysis) or analyzed without pooling (unpooled sample analysis). Genes differentially expressed in both analyses were considered to be differentially expressed.
RNA isolation and global gene expression analysis
Gene expression analysis using total RNA was carried out on the Human Genome U133A GeneChip (Affymetrix, Santa Clara, CA). Data files were processed with the Affymetrix GeneChip Operating Software (GCOS) using settings and quality control parameters as described in Document S1 (available on the Blood website; see the Supplemental Materials link at the top of the online article). A total of 44 hybridizations were performed for this study: naive PBMCs (3 hybridizations from individual donors, 1 hybridization from a pool of 10 donors), naive CD8+ (3 hybridizations from individual donors, 1 hybridization from a pool of 10 donors), activated PBMCs (3 hybridizations from individual donors), activated CD8+ (3 hybridizations from individual donors), and LGL leukemia PBMCs (30 hybridizations from individual LGL leukemia patient PBMCs). Hybridization data and parameter information can be accessed in the Gene Expression Omnibus (GEO) database (http://www.ncbi.nlm.nih.gov/geo).19 The GEO platform accession number is GSE10631; the Affymetrix CHP and CEL file accessions are GSM267916–GSM267959. Details of statistical analysis are provided in Document S1.
EASE analysis
Biologic themes associated with genes found to be differentially expressed were identified using the Expression Analysis Systematic Explorer (EASE) application.13 A Fisher exact score less than .05 was considered significant.
Pathway-based analysis
The expression data matrix created using GCOS as described in “RNA isolation and global gene expression analysis” was imported into DNA Chip Analyzer (dChip) software20 and normalized using default settings. Gene expression profiles of 30 LGL leukemia patients versus activated PBMCs from 3 controls were used to generate a molecular signature and theme-based analysis. Details of statistical analysis are provided in Document S1.
Northern blot assay
Northern blotting was done using 10 μg total RNA of each sample as described in Document S1.
Real-time PCR analysis
Total RNA was isolated using TRIzol per the manufacturer's instructions. RNA was treated with amplification-grade DNAse I (Invitrogen) according to the manufacturer's instructions. Real-time polymerase chain reaction (PCR) analysis was done using SYBR GreenER 2-Step qRT-PCR Kits Universal (Invitrogen) according to the manufacturer's instructions. PCR conditions, primers used, and analysis methods are listed in Document S1.
Western blot assay
Total protein (30 μg) was boiled in Laemmli sodium dodecyl sulfate–polyacrylamide gel electrophoresis (SDS-PAGE) sample loading buffer and subjected to 15% SDS-PAGE. The proteins were then transferred to a membrane and Western blot assay was performed as described previously.12
Apoptosis assay
Freshly isolated PBMCs of healthy individuals or LGL patients were used for apoptosis assay. Cells were assessed by flow cytometry for apoptosis using annexin-V conjugated with phycoerythrin (PE) and 7-amino-actinomycin-D (7-AAD) staining (BD Biosciences) according to the manufacturer's instructions.
Results
Comparison of the gene expression signature of naive normal cells, activated normal cells, and leukemic LGLs
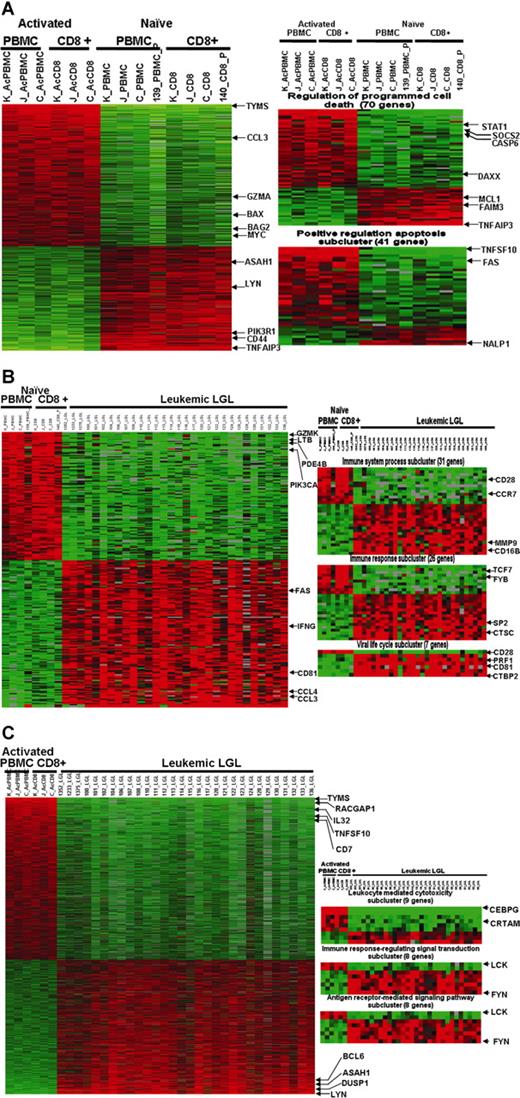
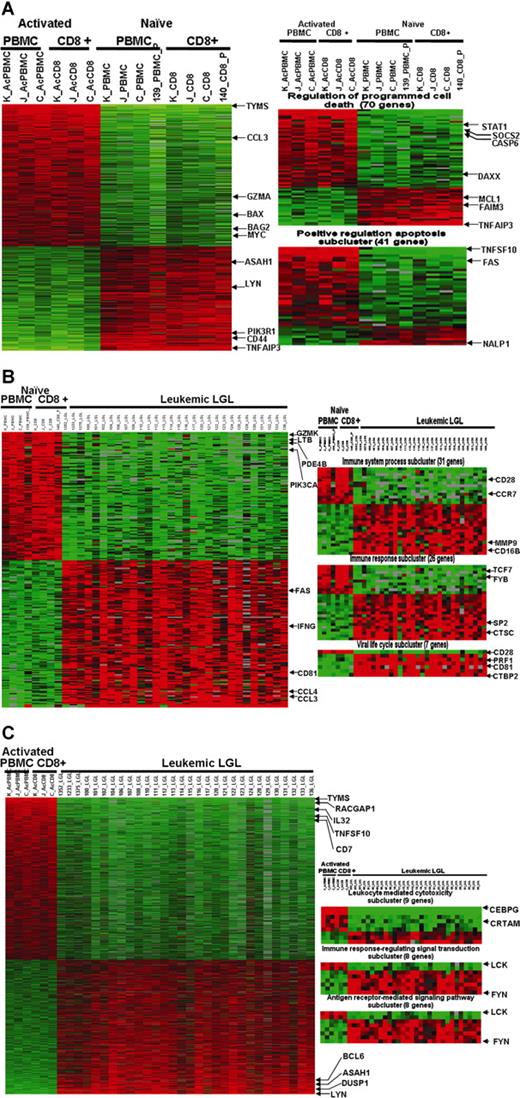
First, we asked the following question: what defines the gene expression pattern of PBMCs following activation in vitro? A total of 775 genes showed differential expression in naive versus activated samples (Figure 2A; Table S1). EASE analysis of naive versus activated cells revealed that the differentially expressed genes were overrepresented in 305 GO categories. An overwhelming number of genes that exhibited differential expression between activated and naive cells belonged to categories related to positive regulation of apoptosis and enhanced immune response (Table S2).
Microarray profiling of naive normal PBMCs, activated normal PBMCs, and leukemic LGLs using gene- and theme-based approaches. (A) Differential expression of genes in normal PBMCs following activation. A total of 775 genes are expressed differentially (at least 2-fold change and 1% FDR) following activation. EASE analysis of 2 phenotypes shows statistically significant up-regulation of genes belonging to GO categories “regulation of programmed cell death” and “positive regulation of apoptosis.” (B) Constitutive gene expression signature of leukemic LGLs compared with naive normal cells. A total of 174 genes were differentially expressed in leukemic LGLs compared with naive normal cells (at least 2-fold change and 1% FDR). EASE analysis of leukemic LGLs compared with naive normal cells shows significant up-regulation of genes belonging to GO categories such as immune system process, immune response, viral life cycle, viral infectious cycle, and viral genome replication. (C) Constitutive gene expression signature of leukemic LGLs compared with activated normal cells. A total of 1492 genes were differentially expressed in leukemic LGLs compared with activated normal cells (at least 2-fold change and 1% FDR). EASE analysis of leukemic LGLs compared with activated normal cells shows up-regulation of immune response–related signaling and cytotoxicity-related GO categories to be significantly up-regulated in leukemic LGLs compared with activated normal cells. Each row in the cluster image represents an individual gene, and each column represents an individual sample from LGL leukemia patient or healthy donor. The relative transcript abundance of each gene is color coded. A red color indicates high expression, black indicates intermediate expression, and green indicates low expression.
Microarray profiling of naive normal PBMCs, activated normal PBMCs, and leukemic LGLs using gene- and theme-based approaches. (A) Differential expression of genes in normal PBMCs following activation. A total of 775 genes are expressed differentially (at least 2-fold change and 1% FDR) following activation. EASE analysis of 2 phenotypes shows statistically significant up-regulation of genes belonging to GO categories “regulation of programmed cell death” and “positive regulation of apoptosis.” (B) Constitutive gene expression signature of leukemic LGLs compared with naive normal cells. A total of 174 genes were differentially expressed in leukemic LGLs compared with naive normal cells (at least 2-fold change and 1% FDR). EASE analysis of leukemic LGLs compared with naive normal cells shows significant up-regulation of genes belonging to GO categories such as immune system process, immune response, viral life cycle, viral infectious cycle, and viral genome replication. (C) Constitutive gene expression signature of leukemic LGLs compared with activated normal cells. A total of 1492 genes were differentially expressed in leukemic LGLs compared with activated normal cells (at least 2-fold change and 1% FDR). EASE analysis of leukemic LGLs compared with activated normal cells shows up-regulation of immune response–related signaling and cytotoxicity-related GO categories to be significantly up-regulated in leukemic LGLs compared with activated normal cells. Each row in the cluster image represents an individual gene, and each column represents an individual sample from LGL leukemia patient or healthy donor. The relative transcript abundance of each gene is color coded. A red color indicates high expression, black indicates intermediate expression, and green indicates low expression.
When comparing the constitutive gene expression signature of leukemic LGLs to naive normal PBMCs and naive normal enriched CD8+ cells, we noted 174 differentially expressed genes (Figure 2B; Table S3). EASE analysis shows a total of 201 GO categories that had significant overrepresentation of differentially expressed genes in leukemic LGLs (Table S4). GO categories related to leukocyte activation and immune responses, inhibition of apoptosis, and response to virus were particularly prominent.
The constitutive gene expression signature of leukemic LGLs showed 1492 genes to be differentially expressed compared with activated normal PBMCs and activated normal enriched CD8+ cells (Figure 2C; Table S5). EASE analysis revealed that these differentially expressed genes were overrepresented in 482 GO categories. Of note were the categories related to negative regulation of apoptosis, positive regulation of T-cell receptor signaling, and enhanced immune response that dominated the list (Table S6).
Dysregulated expression of apoptosis-related genes in leukemic LGLs
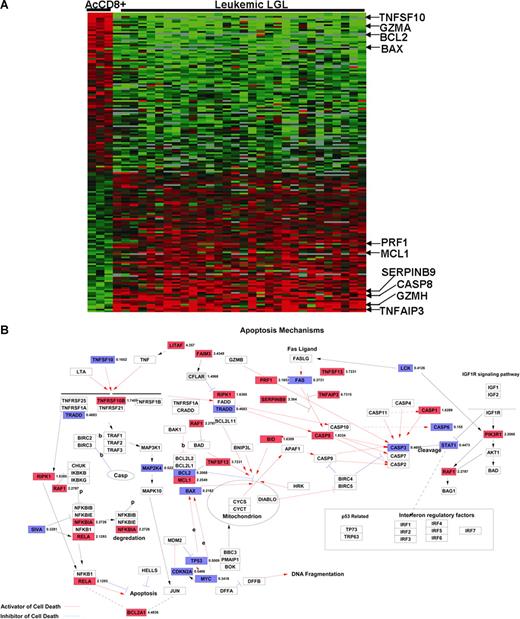
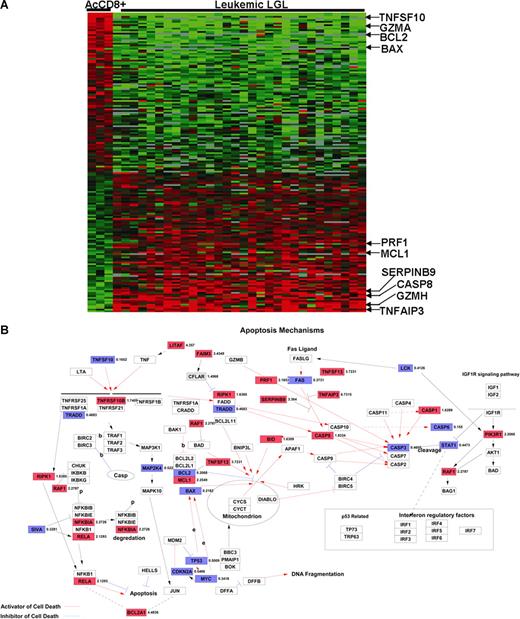
Previous work in our laboratory has suggested that leukemic LGLs accumulate in vivo because of inhibited apoptotic pathways. In addition, global gene expression and EASE analyses revealed a preponderance of differentially expressed genes related to apoptosis in leukemic LGLs. Hence, we further focused on the genes belonging to GO category 0006915 (“apoptosis-related genes”) that are differentially expressed in AICD-prone—activated enriched CD8+ cells—and AICD-resistant leukemic LGLs (Figure 3A; Table S7). Table 1 lists some of 128 genes belonging to GO:0006915 that are constitutively differentially expressed in leukemic LGLs compared with activated enriched CD8+ cells (at least 2-fold change and 1% FDR).
Differentially regulated apoptosis-related genes in leukemic LGLs compared with activated enriched normal CD8+ cells. (A) Apoptosis-related genetic signature unique to leukemic LGLs. The genes that were differentially regulated between leukemic LGLs and activated enriched normal CD8+ cells were identified (at least 2-fold change and 1% FDR). A total of 128 genes belonging to GO category “apoptosis” were differentially expressed in leukemic LGLs compared with activated enriched normal CD8+ cells (AcCD8+). Each row in the cluster image represents an individual gene, and each column represents an individual sample from LGL leukemia patient or healthy donor. The relative transcript abundance of each gene is color coded. A red color indicates high expression, black indicates intermediate expression, and green indicates low expression. (B) Differentially regulated genes between leukemic LGLs and activated enriched CD8+ cells were imported in GenMAPP software for visualization. Known apoptosis-related genes and their relation are shown. The genes constitutively up-regulated in leukemic LGLs compared with activated normal enriched CD8+ cells are shown in red, genes constitutively down-regulated in leukemic LGLs are shown in blue, and those in white show no change in expression between 2 phenotypes. The number accompanying each gene indicates fold change in expression.
Differentially regulated apoptosis-related genes in leukemic LGLs compared with activated enriched normal CD8+ cells. (A) Apoptosis-related genetic signature unique to leukemic LGLs. The genes that were differentially regulated between leukemic LGLs and activated enriched normal CD8+ cells were identified (at least 2-fold change and 1% FDR). A total of 128 genes belonging to GO category “apoptosis” were differentially expressed in leukemic LGLs compared with activated enriched normal CD8+ cells (AcCD8+). Each row in the cluster image represents an individual gene, and each column represents an individual sample from LGL leukemia patient or healthy donor. The relative transcript abundance of each gene is color coded. A red color indicates high expression, black indicates intermediate expression, and green indicates low expression. (B) Differentially regulated genes between leukemic LGLs and activated enriched CD8+ cells were imported in GenMAPP software for visualization. Known apoptosis-related genes and their relation are shown. The genes constitutively up-regulated in leukemic LGLs compared with activated normal enriched CD8+ cells are shown in red, genes constitutively down-regulated in leukemic LGLs are shown in blue, and those in white show no change in expression between 2 phenotypes. The number accompanying each gene indicates fold change in expression.
Validation of microarray analysis
Among the genes belonging to the GO category 0006915 (apoptosis-related genes), the gene showing the highest up-regulation in leukemic LGLs was tumor necrosis factor-α induced protein 3—TNFAIP3 (A20). The expression of TNFAIP3 was found to be constitutively up-regulated in leukemic LGLs by 6.2-fold compared with normal activated PBMCs. To validate the microarray results, we performed Northern blot analysis using an 800–base pair fragment of TNFAIP3 cDNA as a probe (Figure 4). These results confirmed that the expression of TNFAIP3 gene transcripts was much higher in RNA from LGL leukemia patients compared with activated normal PBMCs. Of interest, the levels of expression of TNFAIP3 gene transcripts were down-regulated after IL-2 activation of normal PBMCs.
Differential expression of TNFAIP3 (A20) mRNA in leukemic LGLs compared with activated normal PBMCs. Total RNA (10 μg) from 9 LGL patients and from 5 healthy individuals was analyzed by Northern blot hybridization. The blot was probed with 800-bp fragment of TNFAIP3 or housekeeping gene (GAPDH). Northern blot analysis shows that TNFAIP3 is constitutively expressed in naive normal PBMCs (N PBMCs, lanes 1-5) and that the expression was down-regulated following PHA+IL-2 activation of normal PBMCs (AC PBMCs, lanes 6-7). In contrast, the expression of TNFAIP3 gene transcripts was much higher in RNA from LGL leukemia patients (TLGLs, lanes 8-16) compared with activated normal PBMCs. (White spaces have been inserted to indicate realigned gel lanes.)
Differential expression of TNFAIP3 (A20) mRNA in leukemic LGLs compared with activated normal PBMCs. Total RNA (10 μg) from 9 LGL patients and from 5 healthy individuals was analyzed by Northern blot hybridization. The blot was probed with 800-bp fragment of TNFAIP3 or housekeeping gene (GAPDH). Northern blot analysis shows that TNFAIP3 is constitutively expressed in naive normal PBMCs (N PBMCs, lanes 1-5) and that the expression was down-regulated following PHA+IL-2 activation of normal PBMCs (AC PBMCs, lanes 6-7). In contrast, the expression of TNFAIP3 gene transcripts was much higher in RNA from LGL leukemia patients (TLGLs, lanes 8-16) compared with activated normal PBMCs. (White spaces have been inserted to indicate realigned gel lanes.)
We also found constitutive up-regulation of numerous genes in leukemic LGLs that are involved in CTL function, such as serine proteinases (granzyme B and granzyme H), cysteine proteinases (cathepsin C and cathepsin S), calpain (a cytosolic nonlysosomal cysteine protease), and perforin. Since these genes are expressed only after activation, these results confirm that leukemic LGLs had been activated in vivo. We had previously found these genes to be up-regulated in leukemic LGLs using Northern blot and RNAse protection assays, thus providing further validation of the current microarray studies.21
Pathway-based (GSEA) microarray analysis of leukemic LGLs
We used GSEA to identify potential survival mechanisms in leukemic LGLs compared with activated normal PBMCs. These 2 phenotypes were chosen to identify themes or “pathways” that are differentially regulated in cells that upon activation do undergo AICD (normal activated PBMCs) and those that do not (LGL leukemia samples).
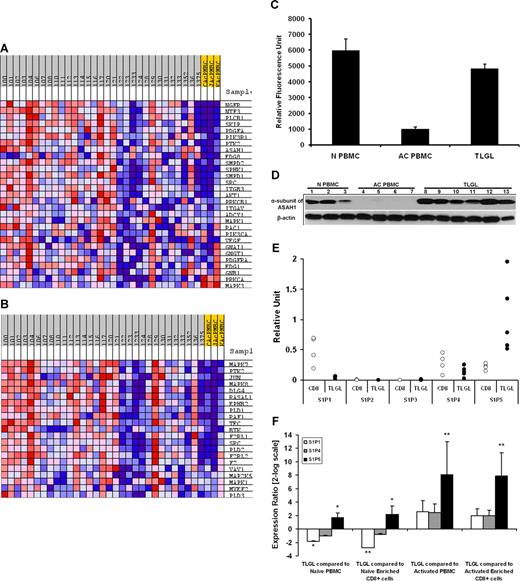
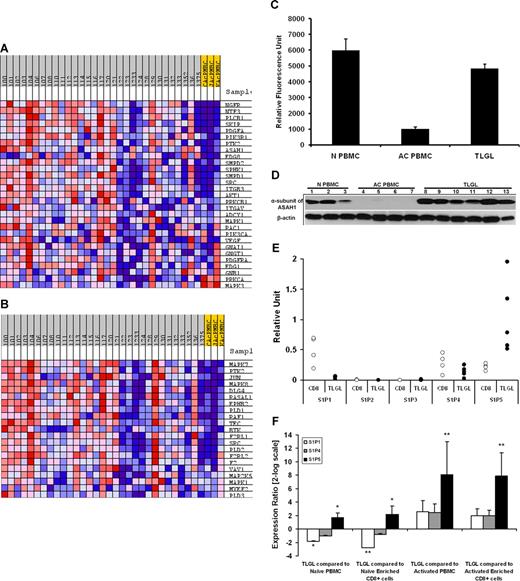
GSEA of LGL leukemia PBMCs compared with activated normal PBMCs revealed a total of 13 gene sets to be constitutively enriched in LGL leukemia phenotype compared with activated normal PBMC phenotype at the FDR less than 15%. Two of the gene sets enriched in leukemic LGLs were “EDG Pathway” (P = .006) and “ST GA12 Pathway” (P = .001), representing the genes that belong to S1P receptor (S1PR)– and Gα12-mediated signaling, respectively (Figure 5A,B). In GSEA, the enrichment score is driven by the group of genes within a gene set that shows the highest correlation with the given phenotype—the core enriched genes (Table 2). The core-enrichment analysis of leukemic LGLs compared with activated normal PBMCs showed that many of the genes central to sphingolipid metabolism and signaling including acid ceramidase (ASAH1), S1P receptor-5 (EDG8), sphingosine kinase 1 (SPHK1), sphingomyelin diesterase 1 and 2 (SMPD1 and SMPD2), and phosphatidyl inositol-3 kinase (PI3KR1) were core-enriched in the LGL leukemia phenotype.
Sphingolipid metabolism and signaling pathway is differentially regulated in leukemic LGLs. The expression profile of LGL leukemia PBMCs (n = 30) was compared with that of activated normal PBMCs (n = 3) using Gene Set Enrichment Analysis (GSEA). Two of the 13 pathways enriched (FDR ≤ 15%) in leukemic LGLs are shown. The expression profile of the components of (A) EDG_Pathway (P = .006) and (B) ST_GA_12_pathway (P = .001) gene sets in leukemic LGLs compared with activated normal PBMCs. Each column represents individual sample from a LGL leukemia patient (gray) or healthy donor (yellow). Each row represents a gene. Red shows high expression, white denotes intermediate expression, and blue denotes low expression. (C) Microarray analysis of ASAH1 mRNA expression. The expression of ASAH1 mRNA in naive normal PBMCs (N PBMCs, n = 4), and activated normal PBMCs (AC PBMCs, n = 3) compared with LGL leukemia PBMCs (TLGLs, n = 30). Each bar represents mean relative fluorescence units, and error bars represent standard error of mean (SEM). (D) Differential expression of ASAH1 in LGL leukemia PBMCs. Expression of α-subunit of acid ceramidase in naive normal PBMCs (N PBMCs, n = 3) and activated normal PBMCs (AC PBMCs, n = 4) compared with LGL leukemia PBMCs (TLGLs, n = 6). Samples were subjected to SDS-PAGE followed by membrane transfer. The blot was probed with antibody to α-subunit of acid ceramidase or β-actin and developed using chemiluminescence. Western blot analysis suggests that acid ceramidase is expressed in naive PBMCs constitutively (N PBMCs, lanes 1-3). Following activation of lymphocytes, α-subunit of acid ceramidase is down-regulated to almost undetectable levels (AC PBMCs, lanes 4-7), whereas it is significantly up-regulated in all LGL leukemia PBMC samples (TLGLs, lanes 8-13). (E) Relative abundance of S1P receptors in naive enriched normal CD8+ cells (white dots, n = 4) and leukemic LGLs (black dots, n = 5) as analyzed by real-time PCR. The figure shows that S1P5 is the predominant S1P receptor for leukemic LGLs. (F) Relative expression of S1P1 (□), S1P4 ( ), and S1P5 (■) in leukemic LGLs (n = 5) compared with normal phenotypes (n = 3-5). A positive value indicates up-regulation, whereas a negative value indicates down-regulation of a gene in leukemic LGLs. Error bars represent standard deviation of expression. S1P5 is up-regulated in LGL leukemia PBMCs compared with all normal phenotypes. S1P1 is up-regulated in naive phenotypes compared with both activated phenotypes and leukemic LGL. (*P < .05; **P < .001.)
Sphingolipid metabolism and signaling pathway is differentially regulated in leukemic LGLs. The expression profile of LGL leukemia PBMCs (n = 30) was compared with that of activated normal PBMCs (n = 3) using Gene Set Enrichment Analysis (GSEA). Two of the 13 pathways enriched (FDR ≤ 15%) in leukemic LGLs are shown. The expression profile of the components of (A) EDG_Pathway (P = .006) and (B) ST_GA_12_pathway (P = .001) gene sets in leukemic LGLs compared with activated normal PBMCs. Each column represents individual sample from a LGL leukemia patient (gray) or healthy donor (yellow). Each row represents a gene. Red shows high expression, white denotes intermediate expression, and blue denotes low expression. (C) Microarray analysis of ASAH1 mRNA expression. The expression of ASAH1 mRNA in naive normal PBMCs (N PBMCs, n = 4), and activated normal PBMCs (AC PBMCs, n = 3) compared with LGL leukemia PBMCs (TLGLs, n = 30). Each bar represents mean relative fluorescence units, and error bars represent standard error of mean (SEM). (D) Differential expression of ASAH1 in LGL leukemia PBMCs. Expression of α-subunit of acid ceramidase in naive normal PBMCs (N PBMCs, n = 3) and activated normal PBMCs (AC PBMCs, n = 4) compared with LGL leukemia PBMCs (TLGLs, n = 6). Samples were subjected to SDS-PAGE followed by membrane transfer. The blot was probed with antibody to α-subunit of acid ceramidase or β-actin and developed using chemiluminescence. Western blot analysis suggests that acid ceramidase is expressed in naive PBMCs constitutively (N PBMCs, lanes 1-3). Following activation of lymphocytes, α-subunit of acid ceramidase is down-regulated to almost undetectable levels (AC PBMCs, lanes 4-7), whereas it is significantly up-regulated in all LGL leukemia PBMC samples (TLGLs, lanes 8-13). (E) Relative abundance of S1P receptors in naive enriched normal CD8+ cells (white dots, n = 4) and leukemic LGLs (black dots, n = 5) as analyzed by real-time PCR. The figure shows that S1P5 is the predominant S1P receptor for leukemic LGLs. (F) Relative expression of S1P1 (□), S1P4 ( ), and S1P5 (■) in leukemic LGLs (n = 5) compared with normal phenotypes (n = 3-5). A positive value indicates up-regulation, whereas a negative value indicates down-regulation of a gene in leukemic LGLs. Error bars represent standard deviation of expression. S1P5 is up-regulated in LGL leukemia PBMCs compared with all normal phenotypes. S1P1 is up-regulated in naive phenotypes compared with both activated phenotypes and leukemic LGL. (*P < .05; **P < .001.)
We were interested in validating overexpression of these core components in leukemic LGLs. Microarray analysis had suggested that the expression of ASAH1 was down-regulated following activation of normal CD8+ T cells. In contrast, leukemic LGLs constitutively express higher levels of ASAH1 mRNA (Figure 5C). We found down-regulation of α-subunit of ASAH1 in activated normal PBMCs compared with both naive normal PBMCs and leukemic LGLs (Figure 5D). We also assessed relative abundance of S1P receptors in PBMC samples from patients with LGL leukemia using real-time PCR. S1P5 was the most abundant of these receptors in LGL leukemia, whereas S1P2 and S1P3 were not expressed (Figure 5E,F). Next, we compared expression of S1P receptors in leukemic LGLs to naive and activated normal phenotypes. We found that S1P1 mRNA was significantly down-regulated in leukemic LGLs compared with naive phenotypes, but not in comparison with activated phenotypes. Comparing 3 phenotypes with approximately similar percentage of CD3+CD8+ cells, namely naive enriched CD8+ cells, activated enriched CD8+ cells, and leukemic LGLs, S1P5 mRNA was overexpressed in leukemic LGLs by 4.5-fold compared with naive enriched CD8+ cells (P = .008) and by 235-fold compared with activated enriched normal CD8+ cells (P < .001).
Differential regulation of sphingolipid metabolism and signaling plays important role in survival of leukemic LGLs
Given the contrasting role of ceramide and S1P in cellular homeostasis, we hypothesized that the collective differential expression of genes associated with sphingolipid metabolism and related signaling could result in an altered rheostat of sphingolipid metabolites. This, in association with collective up-regulation of genes in the Gα12-mediated signaling pathway in leukemic LGLs, may confer abnormal survival on leukemic LGLs resulting in the accumulation of leukemic cells.
To test our hypothesis functionally, we treated PBMCs from healthy controls or LGL leukemia patients with a series of inhibitors of sphingolipid metabolism pathway. Treatment of normal or LGL leukemia PBMCs with myriocin (inhibitor of serine palmitoyl-CoA transferase or SPCT), fumonisin (inhibitor of ceramide synthase), desipramine (inhibitor of acid sphingomyelinase), or GW4869 (inhibitor of neutral sphingomyelinase) for up to 24 hours does not induce apoptosis (Figure 6B-E). In contrast, treatment with the inhibitor of acid ceramidase, NOE, for 6 hours led to significantly higher apoptosis in leukemic LGLs (P < .001, Figure 6F). Treatment of leukemic LGLs with inhibitor of S1P-mediated signaling, FTY720, induced apoptosis by greater than 13-fold compared with naive normal PBMCs within 6 hours (P < .001, Figure 6G). None of the inhibitors we tested induced any significant apoptosis in normal PBMCs.
Differential regulation of sphingolipid metabolism and signaling in leukemic LGLs. (A) Sphingolipid metabolism and signaling pathway and its inhibitors. The inhibitors of the pathway are underlined. The genes shown in reversed color are core enriched as analyzed by GSEA. Naive normal PBMCs (N PBMCs, 1 representative sample of 2 independent experiments showed) or leukemic LGLs (TLGLs, n = 3) were either left untreated or treated with vehicle or indicated concentrations of myriocin (B), fumonisin (C), desipramine (D), and GW4869 (E) for 24 hours. Induction of apoptosis was assessed using flow cytometry. There was no differential apoptosis of leukemic LGLs compared with normal naive PBMCs using each of these inhibitors. (F) Inhibition of acid ceramidase induced differential apoptosis in leukemic LGLs. Naive normal PBMCs (N PBMCs, white dots, n = 5), activated normal PBMCs (AC PBMCs, gray dots, n = 6), or leukemic LGLs (TLGLs, black dots, n = 6) were either left untreated or treated with vehicle (methanol) or 100 μM NOE for 6 hours. Induction of apoptosis was assessed using flow cytometry. NOE induced approximately 30-fold higher apoptosis in LGL leukemia PBMCs compared with normal PBMCs (*P < .001). (G) Inhibition of S1P-mediated signaling by FTY720-induced differential apoptosis in leukemic LGLs. Naive normal PBMCs (N PBMCs, white dots, n = 5), activated normal PBMCs (AC PBMCs, gray dots, n = 4), or leukemic LGLs (TLGLs, black dots, n = 5) were either left untreated or treated with vehicle (DMSO) or 5 μM FTY720 for 6 hours. Leukemic LGLs showed approximately 13-fold higher apoptosis compared with naive normal PBMCs (*P < .001). (Each open dot [○] represents mean percentage of apoptosis ± SEM of 3 separate experiments in an individual sample; marker (•) represents the mean of all samples in a given treatment.)
Differential regulation of sphingolipid metabolism and signaling in leukemic LGLs. (A) Sphingolipid metabolism and signaling pathway and its inhibitors. The inhibitors of the pathway are underlined. The genes shown in reversed color are core enriched as analyzed by GSEA. Naive normal PBMCs (N PBMCs, 1 representative sample of 2 independent experiments showed) or leukemic LGLs (TLGLs, n = 3) were either left untreated or treated with vehicle or indicated concentrations of myriocin (B), fumonisin (C), desipramine (D), and GW4869 (E) for 24 hours. Induction of apoptosis was assessed using flow cytometry. There was no differential apoptosis of leukemic LGLs compared with normal naive PBMCs using each of these inhibitors. (F) Inhibition of acid ceramidase induced differential apoptosis in leukemic LGLs. Naive normal PBMCs (N PBMCs, white dots, n = 5), activated normal PBMCs (AC PBMCs, gray dots, n = 6), or leukemic LGLs (TLGLs, black dots, n = 6) were either left untreated or treated with vehicle (methanol) or 100 μM NOE for 6 hours. Induction of apoptosis was assessed using flow cytometry. NOE induced approximately 30-fold higher apoptosis in LGL leukemia PBMCs compared with normal PBMCs (*P < .001). (G) Inhibition of S1P-mediated signaling by FTY720-induced differential apoptosis in leukemic LGLs. Naive normal PBMCs (N PBMCs, white dots, n = 5), activated normal PBMCs (AC PBMCs, gray dots, n = 4), or leukemic LGLs (TLGLs, black dots, n = 5) were either left untreated or treated with vehicle (DMSO) or 5 μM FTY720 for 6 hours. Leukemic LGLs showed approximately 13-fold higher apoptosis compared with naive normal PBMCs (*P < .001). (Each open dot [○] represents mean percentage of apoptosis ± SEM of 3 separate experiments in an individual sample; marker (•) represents the mean of all samples in a given treatment.)
Differential regulation of S1P-mediated signaling contributes to abnormal survival of leukemic LGLs
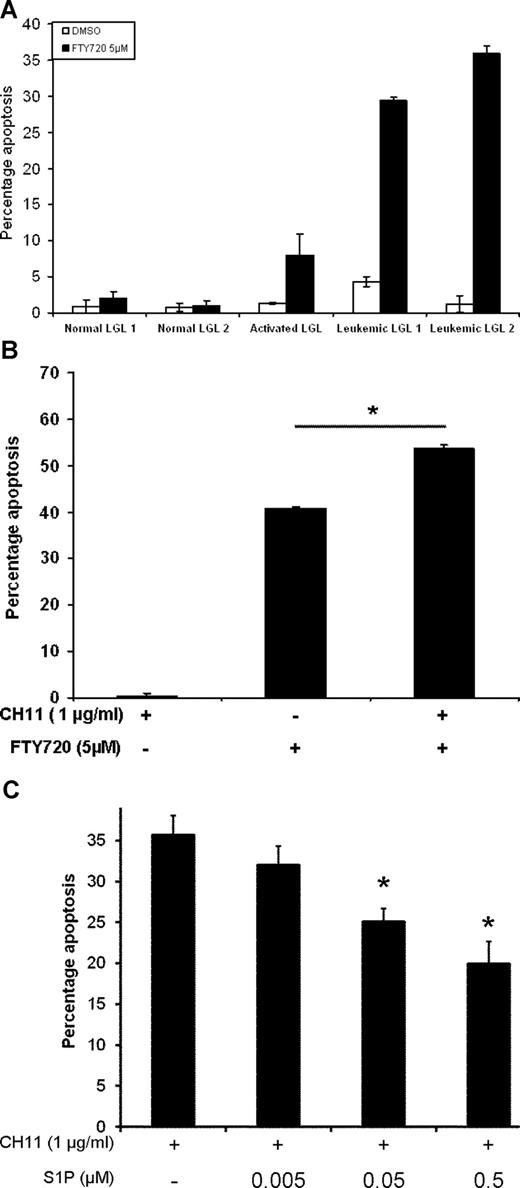
Leukemic LGLs are characterized by abnormal expansion of CD3+CD57+ cells. We then asked whether normal and leukemic CD3+CD57+ cells (LGLs) differed in their sensitivity toward inhibition of S1P-mediated signaling. Freshly isolated PBMCs from healthy donors or LGL leukemia patients were treated with vehicle or 5 μM FTY720 for 6 hours. Induction of apoptosis was assessed in CD3+CD57+ double-positive cells using flow cytometry. As an additional control, PBMCs from a healthy donor were activated using PHA and IL2 for 10 days. Following 10-day activation, activated normal PBMCs were treated with vehicle or 5 μM FTY720 for 6 hours. We found that FTY720 induced 20-fold higher apoptosis in leukemic LGLs compared with naive normal LGLs and approximately 4-fold higher apoptosis compared with activated normal LGLs (Figure 7A).
S1P-mediated signaling plays an important role in survival of leukemic LGLs. (A) PBMCs from healthy donors (N PBMCs 1,2), normal activated PBMCs (AC PBMCs), or LGL leukemia patients (TLGLs 1,2) were treated with DMSO (□) or 5 μM FTY720 (■) as described. Flow cytometric analysis for induction of apoptosis was done. Cells were gated for CD3+CD57+ double-positive cells (LGL cells) and further analyzed for apoptosis. Leukemic LGLs showed 20-fold higher apoptosis compared with naive normal LGLs. (B) Treatment with FTY720 sensitizes LGL leukemia PBMCs to Fas-mediated apoptosis. PBMCs from LGL leukemia patients were incubated with vehicle or 5 μM FTY720 for 1 hour. Each treatment group was further divided into 2 and left untreated or treated with 1 μg/mL CH11 and further incubated for 6 hours. In addition to inducing spontaneous apoptosis, treatment with 5 μM FTY720 further sensitizes leukemic LGLs to Fas-mediated apoptosis (*P = .001). (Results shown are representative of 3 independent experiments.) (C) Activated PBMCs from healthy donors were cultured in RPMI-1640 supplemented with 1% FBS for 18 hours. The cells were treated with either vehicle or indicated concentrations of S1P for 1 hour. CH11 (1 μg/mL) was added to the wells and cells were further incubated for an additional 3.5 hours. The graph shows that increasing amounts of S1P in culture protects cells from Fas-mediated apoptosis in a dose-dependent manner. At 0.5-μM and 0.05-μM concentrations, S1P inhibits Fas-mediated apoptosis by more than 55% and 30% (*P < .03), respectively. The results shown are a representative of 1 of the 3 individual experiments performed.
S1P-mediated signaling plays an important role in survival of leukemic LGLs. (A) PBMCs from healthy donors (N PBMCs 1,2), normal activated PBMCs (AC PBMCs), or LGL leukemia patients (TLGLs 1,2) were treated with DMSO (□) or 5 μM FTY720 (■) as described. Flow cytometric analysis for induction of apoptosis was done. Cells were gated for CD3+CD57+ double-positive cells (LGL cells) and further analyzed for apoptosis. Leukemic LGLs showed 20-fold higher apoptosis compared with naive normal LGLs. (B) Treatment with FTY720 sensitizes LGL leukemia PBMCs to Fas-mediated apoptosis. PBMCs from LGL leukemia patients were incubated with vehicle or 5 μM FTY720 for 1 hour. Each treatment group was further divided into 2 and left untreated or treated with 1 μg/mL CH11 and further incubated for 6 hours. In addition to inducing spontaneous apoptosis, treatment with 5 μM FTY720 further sensitizes leukemic LGLs to Fas-mediated apoptosis (*P = .001). (Results shown are representative of 3 independent experiments.) (C) Activated PBMCs from healthy donors were cultured in RPMI-1640 supplemented with 1% FBS for 18 hours. The cells were treated with either vehicle or indicated concentrations of S1P for 1 hour. CH11 (1 μg/mL) was added to the wells and cells were further incubated for an additional 3.5 hours. The graph shows that increasing amounts of S1P in culture protects cells from Fas-mediated apoptosis in a dose-dependent manner. At 0.5-μM and 0.05-μM concentrations, S1P inhibits Fas-mediated apoptosis by more than 55% and 30% (*P < .03), respectively. The results shown are a representative of 1 of the 3 individual experiments performed.
To evaluate the effects of S1P inhibition on Fas-mediated apoptosis in leukemic LGLs, we assessed the effect of FTY720 treatment on Fas-mediated apoptosis in PBMCs from LGL leukemia patients. In agreement with our previous work, there was no significant induction of apoptosis following treatment with vehicle and anti-Fas mAb (1 μg/mL CH11). We showed that treatment with FTY720 induced apoptosis in leukemic LGLs and also sensitized leukemic LGLs to Fas-mediated apoptosis (P < .001) (Figure 7B).
To assess whether addition of S1P leads to inhibition of Fas-mediated apoptosis in normal PBMCs, PBMCs from healthy donors were activated with PHA + IL2 as described in “Methods.” After 10 days, the cells were washed and resuspended in RPMI-1640 supplemented with 1% FBS for 18 hours. The cells were then treated with indicated amount of S1P or vehicle for 1 hour and then either left untreated or treated with 1 μg/mL CH11 for further 3.5 hours. Induction of apoptosis was assessed by flow cytometry. Addition of CH11 led to induction of apoptosis in activated normal cells as expected. Addition of S1P, but not vehicle, led to inhibition of Fas-mediated apoptosis in activated normal PBMCs in a dose-dependent manner (Figure 7C). Addition of 0.5 μM S1P to the culture medium inhibited Fas-mediated apoptosis by more than 55% compared with addition of CH11 only (P < .03).
Discussion
Here we show that the unique molecular signature of LGL leukemia is characterized by dysregulation in expression of many apoptotic genes. We further demonstrate that sphingolipid signaling is differentially regulated in LGL leukemia patients and that perturbation of sphingolipid signaling results in induction of apoptosis in leukemic LGLs. Collectively, these results suggest a novel role of sphingolipid signaling in long-term survival of competent CTLs in vivo.
Theme-based approach using EASE analysis showed that whereas the principal difference between naive normal PBMCs and leukemic LGLs was in immune response–related pathways, leukemic cells significantly differed from activated normal PBMCs in terms of apoptosis-related pathways. Activated normal PBMCs show simultaneous up-regulation of both prosurvival pathway (eg, “Jak-Stat cascade–related genes”)– and proapoptotic pathway (eg, “induction of apoptosis”)–related genes, reinforcing the idea that activation and proliferation of T lymphocytes are tightly coupled with proapoptotic signaling.22 In contrast, leukemic LGLs were characterized by overrepresentation of the genes belonging to GO categories such as “leukocyte activation” along with categories such as “negative regulation of apoptosis.” This marked difference suggests that the activation and apoptosis that are tightly coupled in normal activated cells are uncoupled in leukemic LGLs, resulting in the failure of AICD. One possible mechanism of such dysregulation is chronic viral infection, suggested by up-regulation of genes belonging to virus infection–related GO categories in leukemic LGLs.
Many of the differentially regulated genes found in leukemic LGLs compared with activated normal cells belong to GO category “apoptosis” (Table 1; Figure 3A). Most of the genes constitutively up-regulated in leukemic LGLs are antiapoptotic, whereas those down-regulated are known to have proapoptotic functions (Figure 3B). TNFAIP3 (A20) was the apoptotic pathway gene that showed the highest up-regulation in leukemic LGLs in microarray analysis. TNFAIP3 is an NF-κB inducible gene that protects T lymphocytes from undergoing TNF-induced apoptosis. In normal T lymphocytes, TNFAIP3 is down-regulated after activation.23,24 Up-regulated expression of TNFAIP3 in leukemic LGLs was confirmed by Northern blot analysis, thus validating these microarray results. Differentially regulated apoptosis genes in LGL leukemia featured many of those belonging to the Bcl-2 family. The Bcl-2 family proteins are central to life-or-death decisions made by cells due to presence of both proapoptotic and antiapoptotic actions of its family members.22 The expression of the Bcl-2–related X gene (BAX) was down-regulated in leukemic LGLs by approximately 4.5-fold. In contrast, the expression of myeloid cell factor-1 (MCL1) was up-regulated in leukemic LGLs by 2.25-fold. We have previously shown that inhibition or down-regulation of STAT3 is associated with decreased MCL1 and increased apoptosis in leukemic LGLs.12 Collectively, these observations support our hypothesis that LGL leukemia is characterized by profound dysregulation of apoptosis in these chronically activated T lymphocytes and that inhibition of apoptosis could play an important role in its pathogenesis.
GSEA of leukemic LGLs compared with activated normal PBMCs suggested that sphingolipid metabolism and signaling-related gene set are enriched in leukemic LGLs. GSEA is a pathway-based approach to microarray analysis that determines whether a predefined set of genes shows statistically significant difference in expression between 2 phenotypes. It considers the behavior of a set of genes rather than individual genes.25 An approach such as GSEA is particularly important in samples with subtle variations between 2 phenotypes or in those with high variances. Such an approach can be valuable in suggesting potential involvement of a pathway; however, this assertion needs to be validated functionally.
We hypothesized that inhibitors that alter ceramide-S1P rheostat would induce apoptosis in leukemic LGLs, but inhibitors of sphingolipid metabolism not altering this rheostat would have no effect on survival of leukemic LGLs. In the latter category, we tested myriocin, fumonisin, desipramine, and GW4869. None of these agents induced apoptosis in leukemic LGLs (Figure 6B-E). We conclude that inhibition of pathways outside sphingolipid rheostat had no effect on survival of leukemic LGLs.
In contrast, inhibition of acid ceramidase—an enzyme central to sphingolipid rheostat—led to apoptosis of leukemic LGLs. Ceramidase is the enzyme regulating the rate-limiting step in conversion of ceramide into sphingosine and a free fatty acid. Up-regulation of acid ceramidase is seen in many human cancers. High acid ceramidase activity results in lower levels of ceramide in the cells even following ceramide-inducing stimuli.26,27 Gene-based analysis identified ASAH1 as one of the most significantly up-regulated apoptosis-related genes in leukemic LGLs compared with activated enriched CD8+ cells. This observation was confirmed at the protein level by Western blot analysis. Acid ceramidase was also identified as a core enriched gene using GSEA—thus rendering it as an important potential target to perturb sphingolipid signaling. The activity of acid ceramidase can be inhibited by its specific chemical inhibitor NOE. NOE is known to induce apoptosis in human alveolar macrophages28 ; however, the effect of NOE treatment in lymphocytes is not known. We found that inhibition of the activity of acid ceramidase led to significantly higher induction of apoptosis in leukemic LGLs. This result suggests that high ceramidase activity, presumably due to higher expression of acid ceramidase, is one of the mechanisms of survival in leukemic LGLs. Further studies using the overexpression of ASAH1 will be needed to confirm the importance of up-regulation of acid ceramidase in the long-term survival of CTLs.
Our results strongly suggest that S1P-mediated signaling is important in keeping CD8+ cells alive following activation. S1P provides protection against Fas-mediated apoptosis in various T-lymphocyte cell lines.29-32 Our results showed that S1P can protect activated normal PBMCs from Fas-mediated apoptosis, similar to the Fas-resistant phenotype observed in leukemic LGLs. S1P signaling can be inhibited by FTY720 (fingolimod). In peripheral T lymphocytes, FTY720 preferentially augments apoptosis of activated cells following TCR-mediated activation.33 We found that 6-hour treatment with FTY720 induces apoptosis in PBMCs from LGL leukemia patients but not in naive or activated normal PBMCs. Importantly, we demonstrated that FTY720 selectively induced apoptosis in leukemic LGLs but not in naive or activated normal LGLs. FTY720 is an immunomodulator currently being evaluated in clinical trials for use in autoimmune conditions such as multiple sclerosis.34,35 Immunosuppressive therapy has been the cornerstone of treatment in LGL leukemia. However, only approximately 50% of patients respond to such an initial regimen and there is no known curative treatment.6 Hence, FTY720 may be a potential therapeutic in LGL leukemia.
FTY720 binds to all the S1P receptors except S1P2.35 Because of selective activity of FTY720 on leukemic LGLs, we were interested in further characterizing S1P receptor expression in leukemic LGLs. We found that S1P1 is the predominant receptor in all normal phenotypes. S1P1 is known to be down-regulated in T lymphocytes following in vitro or in vivo activation.35,36 We confirmed these results in activated normal CD8+ cells and also showed down-regulation of S1P1 in leukemic LGLs. These results further suggest that leukemic LGLs are activated cells in vivo. Previously, we showed up-regulation of S1P5 in leukemic LGLs.15 Our results show that S1P5 is the predominant S1P receptor in leukemic LGLs and that S1P5 is selectively up-regulated in leukemic LGLs compared with naive and activated normal PBMCs and enriched CD8+ cells. Recently, it was also shown that S1P5 is the predominant receptor in mature natural killer (NK) cell subset.37
GSEA of leukemic LGLs compared with activated PBMCs suggested enrichment of Gα12 signaling pathway. S1P5 acts as G-protein–coupled receptor upstream to both Gαi and Gα12/13. Constitutive Gα12 signaling can mediate oncogenic transformation through Src- and PI3k-Akt–mediated activation of STAT3.38 We and others have shown that Src-family kinases, PI3K-AKT, and STAT3 activation contribute to apoptotic resistance of leukemic LGLs.9,12 Taken together, these facts suggest that altered sphingolipid-mediated signaling through S1P5-Gα12 may play an important role in survival of leukemic LGLs.
Maintenance of long-lived functional CTLs is necessary for generating vaccines directed at cancer and chronic viral infections as well as in adoptive T-cell cancer therapy. As recently reviewed, the biggest obstacle following adoptive T-cell therapy for cancers is poor survival and maintenance of effector functions of desired T cells.39,40 Passive transfer of “primed” CTLs is not sufficient for generating long-lasting effector response in vivo. In addition, many tumor cells express FasL on their surfaces. This can be an effective mechanism of immune evasion by tumors since activated T lymphocytes express high levels of Fas on their surface, making the latter susceptible to Fas/FasL-mediated apoptosis.41 LGL leukemia patients show clonal expansion of functional cytotoxic CD8+ cells that are inherently resistant to Fas/FasL-mediated apoptosis. Therefore, LGL leukemia might serve as a human model to investigate key pathways promoting CTL survival. Our findings suggest importance of sphingolipid-mediated signaling in long-term survival of CTLs in vivo.
The online version of this article contains a data supplement.
The publication costs of this article were defrayed in part by page charge payment. Therefore, and solely to indicate this fact, this article is hereby marked “advertisement” in accordance with 18 USC section 1734.
Acknowledgments
We thank Nate Sheaffer and David Stanford of Cell Science/Flow Cytometry Core Facility at Penn State Hershey Cancer Institute/Milton S. Hershey Medical Center (Hershey, PA) for their help with acquisition and analysis of flow cytometry data. We thank Lynn Ruiz, Kendall Thomas, and Nancy Ruth Jarbadan for helping us with acquiring patient samples and processing them.
This work was supported by NIH grants CA90633 and CA94872.
National Institutes of Health
Authorship
Contribution: M.V.S. performed experiments, analyzed results, generated figures, and wrote the paper; R.Z. performed experiments and analyzed results; R.I., R.K., and X.L. designed experiments; T.A. and B.F. performed microarray experiments; N.H.L. analyzed results, generated figures, and wrote the paper; T.P.L. designed research, analyzed results, and wrote the paper.
Conflict-of-interest disclosure: The authors declare no competing financial interests.
Correspondence: Thomas P. Loughran Jr, Milton S. Hershey Medical College, 500 University Drive, Hershey, PA; e-mail: tloughran@psu.edu.


![Figure 6. Differential regulation of sphingolipid metabolism and signaling in leukemic LGLs. (A) Sphingolipid metabolism and signaling pathway and its inhibitors. The inhibitors of the pathway are underlined. The genes shown in reversed color are core enriched as analyzed by GSEA. Naive normal PBMCs (N PBMCs, 1 representative sample of 2 independent experiments showed) or leukemic LGLs (TLGLs, n = 3) were either left untreated or treated with vehicle or indicated concentrations of myriocin (B), fumonisin (C), desipramine (D), and GW4869 (E) for 24 hours. Induction of apoptosis was assessed using flow cytometry. There was no differential apoptosis of leukemic LGLs compared with normal naive PBMCs using each of these inhibitors. (F) Inhibition of acid ceramidase induced differential apoptosis in leukemic LGLs. Naive normal PBMCs (N PBMCs, white dots, n = 5), activated normal PBMCs (AC PBMCs, gray dots, n = 6), or leukemic LGLs (TLGLs, black dots, n = 6) were either left untreated or treated with vehicle (methanol) or 100 μM NOE for 6 hours. Induction of apoptosis was assessed using flow cytometry. NOE induced approximately 30-fold higher apoptosis in LGL leukemia PBMCs compared with normal PBMCs (*P < .001). (G) Inhibition of S1P-mediated signaling by FTY720-induced differential apoptosis in leukemic LGLs. Naive normal PBMCs (N PBMCs, white dots, n = 5), activated normal PBMCs (AC PBMCs, gray dots, n = 4), or leukemic LGLs (TLGLs, black dots, n = 5) were either left untreated or treated with vehicle (DMSO) or 5 μM FTY720 for 6 hours. Leukemic LGLs showed approximately 13-fold higher apoptosis compared with naive normal PBMCs (*P < .001). (Each open dot [○] represents mean percentage of apoptosis ± SEM of 3 separate experiments in an individual sample; marker (•) represents the mean of all samples in a given treatment.)](https://ash.silverchair-cdn.com/ash/content_public/journal/blood/112/3/10.1182_blood-2007-11-121871/4/m_zh80150821290006.jpeg?Expires=1764410734&Signature=f~FQNUgE-CxvIdISMQqE0Ws0qbXvWUgOZDfu6ujk0swTlJA94b5gQ9rUigkCmuUhLxFZGKl8i4DV5IPgoJBWQnqFVVl70L3LGidZicsNSo9tWZtabeoZfpJw03X04KTrkUTCmp5sj3UKikPBBHWLpRceHEduw3BGYIn98no43MsmZ5RiklR3AbdUhxGKDRBMLBHjUOZC33jZHnCfWOXGZW5xlaLnDXnAAGIyepMEk5i19gMUqkx~S5Ev5bgmMKu9UM3mdJnVsKbRlFIGP1KFjIWboYRZzAbAlYLvN-zMW9oTPaT7pDeLFi5k~iDxuvJq6q~Y36T6RGXcTNG0LndoZA__&Key-Pair-Id=APKAIE5G5CRDK6RD3PGA)

 ), and S1P5 (■) in leukemic LGLs (n = 5) compared with normal phenotypes (n = 3-5). A positive value indicates up-regulation, whereas a negative value indicates down-regulation of a gene in leukemic LGLs. Error bars represent standard deviation of expression. S1P5 is up-regulated in LGL leukemia PBMCs compared with all normal phenotypes. S1P1 is up-regulated in naive phenotypes compared with both activated phenotypes and leukemic LGL. (*P < .05; **P < .001.)
![Figure 6. Differential regulation of sphingolipid metabolism and signaling in leukemic LGLs. (A) Sphingolipid metabolism and signaling pathway and its inhibitors. The inhibitors of the pathway are underlined. The genes shown in reversed color are core enriched as analyzed by GSEA. Naive normal PBMCs (N PBMCs, 1 representative sample of 2 independent experiments showed) or leukemic LGLs (TLGLs, n = 3) were either left untreated or treated with vehicle or indicated concentrations of myriocin (B), fumonisin (C), desipramine (D), and GW4869 (E) for 24 hours. Induction of apoptosis was assessed using flow cytometry. There was no differential apoptosis of leukemic LGLs compared with normal naive PBMCs using each of these inhibitors. (F) Inhibition of acid ceramidase induced differential apoptosis in leukemic LGLs. Naive normal PBMCs (N PBMCs, white dots, n = 5), activated normal PBMCs (AC PBMCs, gray dots, n = 6), or leukemic LGLs (TLGLs, black dots, n = 6) were either left untreated or treated with vehicle (methanol) or 100 μM NOE for 6 hours. Induction of apoptosis was assessed using flow cytometry. NOE induced approximately 30-fold higher apoptosis in LGL leukemia PBMCs compared with normal PBMCs (*P < .001). (G) Inhibition of S1P-mediated signaling by FTY720-induced differential apoptosis in leukemic LGLs. Naive normal PBMCs (N PBMCs, white dots, n = 5), activated normal PBMCs (AC PBMCs, gray dots, n = 4), or leukemic LGLs (TLGLs, black dots, n = 5) were either left untreated or treated with vehicle (DMSO) or 5 μM FTY720 for 6 hours. Leukemic LGLs showed approximately 13-fold higher apoptosis compared with naive normal PBMCs (*P < .001). (Each open dot [○] represents mean percentage of apoptosis ± SEM of 3 separate experiments in an individual sample; marker (•) represents the mean of all samples in a given treatment.)](https://ash.silverchair-cdn.com/ash/content_public/journal/blood/112/3/10.1182_blood-2007-11-121871/4/m_zh80150821290006.jpeg?Expires=1764410735&Signature=Z8knBxJNPaci~VYY2YYtW~7IRC-p3KAYIv7J48vGmwCCTi6-Jtwv-hN-gtMJY7pHFZhXpCKbtwPwW227y3I9NlVVkUFdD4sQWKVzazX3d6rhlE8nqhdvi95jcBseWaqAhCRnzQmpGiirEFNV7b4gur-gxdM1vzTCRG7BEVGAUw005F7Dgmui8P8RzSV3A4Wk-tM53PpFWRno3dCJo9HffcSCO4jUuiGqsT2sTUF7D0ANFGSos3QsXnawheFVMYsTZAWTHK8iHRDaBwFLwVQDliwFhfuBv335eoisNSw0CC0DWmqSN0YuelFhbK5kvB-rNBCHq6I9Oyw9BB6HKOem2A__&Key-Pair-Id=APKAIE5G5CRDK6RD3PGA)
