Abstract
Despite the excellent efficacy of imatinib in chronic myeloid leukemia (CML), the response in patients is heterogeneous, which may in part be caused by pharmacogenetic variability. Imatinib has been reported to be a substrate of the P-glycoprotein pump. In the current study, we focused on the ABCB1 (MDR1) genotype. We analyzed the 3 most relevant single nucleotide polymorphisms of MDR1 in 90 CML patients treated with imatinib. Among the patients homozygous for allele 1236T, 85% achieved a major molecular response versus 47.7% for the other genotypes (P = .003). For the 2677G>T/A polymorphism, the presence of G allele was associated with worse response (77.8%, TT/TA; vs 47.1%, GG/GA/GT; P = .018). Patients with 1236TT genotype had higher imatinib concentrations. One of the haplotypes (1236C-2677G-3435C) was statistically linked to less frequent major molecular response (70% vs 44.6%; P = .021). Hence, we demonstrated the usefulness of these single nucleotide polymorphisms in the identification of CML who may or may not respond optimally to imatinib.
Introduction
Imatinib (Gleevec or Glivec, Novartis, Basel, Switzerland), a competitive inhibitor of the Bcr-Abl tyrosine kinase, is the common treatment of chronic myeloid leukemia (CML).1 It is now established that the best way to evaluate the response of imatinib is the major molecular response (MMR) defined by the Bcr-Abl level 3 log reduction after 12 months of treatment.2 Despite the outstanding results of imatinib in the chronic phase of CML, cases of treatment failure or suboptimal response have been reported, resulting in heterogeneous molecular response.3 Trough imatinib plasma levels have been recently reported to be associated with MMR after standard dose of imatinib in CML, and a plasma threshold of 1002 ng/mL was found to have best sensitivity; the rate of MMR was significantly reduced below this threshold.4 Monitoring imatinib plasma levels to adjust treatment strategies in CML patients thus demonstrated interpatient variability. We have demonstrated that imatinib is a substrate of P-glycoprotein–mediated efflux. P-glycoprotein is encoded by the multidrug resistance ABCB1 gene, and the functional variation in this gene could explain at least in part variable responses to this drug.5 Single-nucleotide polymorphisms (SNPs) in ABCB1 genes have the potential to alter protein function and could also influence the efficiency of absorption or elimination.6
In the current study, we have genotyped the 3 most relevant MDR1 polymorphisms in CML patients (n = 90) treated by one single dose of imatinib in one hospital center. Our data suggest that genotyping for some of MDR1 polymorphisms is a useful molecular tool to identify how patients respond to imatinib.
Methods
Informed consent was obtained in accordance with the Declaration of Helsinki from all patients who participated in this study, which was performed parallel to the molecular evaluation. The study was approved by the local Ethics Committe Consultatif de Protection des Personnes dans la Recherche Biomédicale (CCPRB) de Bordeaux at the University of Bordeaux. Pharmacologists who performed the analysis for this study had no direct contact with humans. Chronic-phase or accelerated-phase CML patients were considered for our study and were treated orally, for at least 12 months, with standard-dose imatinib (ie, 400 mg) on front line treatment (n = 42) or on second line after interferon (n = 48) according to the phase 2 expanded access protocols (109,110,113,114) and a phase 3 trial (106) supported by Novartis Pharmaceuticals and the French SPIRIT study. To assess molecular responses, total RNA was extracted from peripheral blood cells and BCR-ABL transcript levels were quantified using real-time quantitative reverse-transcriptase polymerase chain reaction (PCR), according to recommendations recently proposed for harmonization of results.7 MMR was defined as a reduction in BCR-ABL transcript levels of at least 3 log after 12 months of imatinib therapy, from a standardized baseline.2
For imatinib plasma quantification, blood samples were collected between 21 and 27 hours after last drug administration, and the levels were determined as already reported.4,8
The 3 most relevant MDR1 polymorphisms were analyzed in this cohort of patients: 1236C>T, 2677G>T/A, and 3435C>T.6 cDNA samples (∼100 ng), obtained from the reverse-transcriptase PCR, were used. These polymorphisms were genotyped using PCR restriction fragment length polymorphism. The genotypes of 3435C>T were obtained as described by others.9 For the 1236C>T and 2677G>T/A SNPs, oligonucleotide primers were designed from the ABCB1 cDNA sequence (GenBank accession no. 14758)10 and the relevant restriction enzymes were chosen with the New England BioLabs tool (Ipswich, MA). For the 2677G>T/A, mismatch primers were created to introduce a BanI site in the presence of alleles G/A, according to Cascorbi et al.11 PCR reactions were performed in a final volume of 25 μL with 0.5 μM of each of the primers (Sigma-Aldrich, St Louis, MO), 400 μM of each dNTPs, 10 mM Tris-HCL, 1.5 mM MgCl2, 50 mM KCl (pH 8.3), and 1 U Taq polymerase (PCR Core Kit, Roche Diagnostics, Mannheim, Germany). PCR amplification consisted of an initial denaturation for 5 minutes at 95°C followed by 40 cycles of denaturation at 95°C for 30 seconds, annealing at 55°C (1236C>T) or 56°C (2677G>T/A) for 30 seconds, and extension at 72°C for 1 minute 30 seconds. The terminal elongation was performed at 72°C for 20 minutes. DNA fragments generated after restriction enzyme digestion were separated on a 4% agarose gel.
The Hardy-Weinberg equilibrium of alleles at individual loci was tested with a χ2 test with one degree of freedom to compare the observed and expected genotype frequencies among the subjects.
Haplotype phase was obtained by PHASE software, version 2.0.12,13 Carriers of a given haplotype were calculated from all haplotype pairs containing respective haplotype; haplotype frequency was calculated relative to the total number of chromosomes.
A χ2 test was used to evaluate the association between MDR1 polymorphisms and chemotherapy response or trough imatinib plasma levels (less than or more than cutoff point of 1000 ng/mL).4 The risk of not achieving MMR associated with a genetic variant was expressed as odds ratio (with a 95% confidence interval). Multivariate analysis with the inclusion of interferon therapy was performed by unconditional logistic regression analysis. Each genotype of the 1236 locus was considered as a separate category, whereas the 2677 polymorphism was analyzed as a dichotomous variable (individuals with and without a G allele). All analyses assessing the impact of genotypes/haplotypes were performed by SPSS statistical package (Chicago, IL), version 15.
Results and discussion
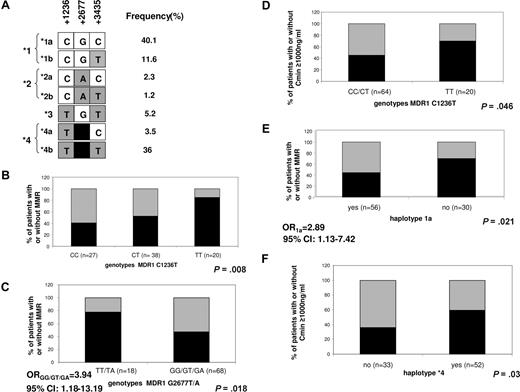
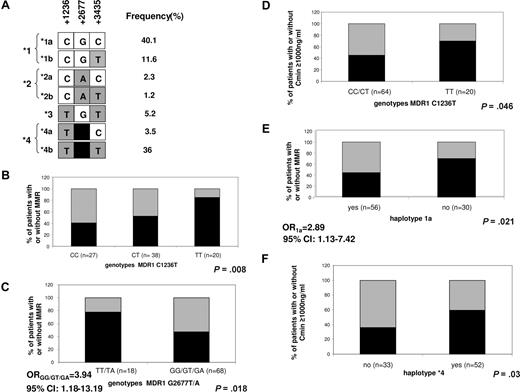
The overall frequencies of the MDR1 1236 CC, CT, and TT genotypes were 31.8%, 44.7%, and 23.5%, respectively. The frequencies of the MDR1 2677 GG, GT, TT, GA, and TA genotypes were 34.9%, 39.5%, 18.6%, 4.7%, and 2.3%, respectively (homozygous individuals were not found for the allele 2677A). The overall frequency of the MDR1 3435 CC, CT, and TT genotypes were 18.9%, 51.1%, and 30%, respectively. The genotype distributions of each polymorphism were in Hardy-Weinberg equilibrium (data not shown) and were similar to those previously reported by Cascorbi et al (P = .3, 1236C>T; P = .3, 2677G>T/A; P = .95, 3435C>T).10 Three variants appeared in partial linkage disequilibrium, as already reported,14 and were organized in 7 haplotypes in our cohort (Figure 1A).
MDR1 polymorphisms in 90 CML patients treated by imatinib. (A) Derived haplotype from MDR1 polymorphisms and their frequency. Seven different haplotypes were defined by the 3 polymorphisms 1236C>T, 2677G>T/A, and 3435C>T. Haplotypes 1, 2, and 4 were subdivided in panels A and B according to the 3435 polymorphism. (B-F) Proportion of patients with and without major molecular response (MMR) after 12 months of imatinib (B,C,E) or with a trough imatinib plasma level (Cmin) less than or more than 1000 ng/mL (D,F), according to indicated MDR1 genotypes or haplotypes. In panels B, C, and E, black represents MMR after 12 months of imatinib; gray, no MMR after 12 months of imatinib. In panels D and F, black represents Cmin more than or equal to 1000 ng/mL; gray, Cmin less than 1000 ng/mL. Respective genotype/haplotype, number of individuals, as well as P values are indicated on each plot. Odds ratio (OR) with 95% confidence interval (CI) in panels C and E represent risk of not achieving MMR associated with the indicated genotype.
MDR1 polymorphisms in 90 CML patients treated by imatinib. (A) Derived haplotype from MDR1 polymorphisms and their frequency. Seven different haplotypes were defined by the 3 polymorphisms 1236C>T, 2677G>T/A, and 3435C>T. Haplotypes 1, 2, and 4 were subdivided in panels A and B according to the 3435 polymorphism. (B-F) Proportion of patients with and without major molecular response (MMR) after 12 months of imatinib (B,C,E) or with a trough imatinib plasma level (Cmin) less than or more than 1000 ng/mL (D,F), according to indicated MDR1 genotypes or haplotypes. In panels B, C, and E, black represents MMR after 12 months of imatinib; gray, no MMR after 12 months of imatinib. In panels D and F, black represents Cmin more than or equal to 1000 ng/mL; gray, Cmin less than 1000 ng/mL. Respective genotype/haplotype, number of individuals, as well as P values are indicated on each plot. Odds ratio (OR) with 95% confidence interval (CI) in panels C and E represent risk of not achieving MMR associated with the indicated genotype.
There was a significant difference in genotype frequencies at the 1236 and 2677 loci between patients with or without MMR when the analysis of individual polymorphisms was performed. MMR correlated with the number of T alleles at locus 1236. MMR was higher for heterozygous patients and increased further for patients homozygous for the 1236T allele compared with patients with other genotype groups (40.7% for CC, vs 52.6% for CT and 85% for TT, P = .008, Figure 1B), suggesting a gene dosage effect for this SNP. For the 2677G>T/A polymorphism, a better MMR was observed for patients with genotype TT or TA, compared with other genotype groups (GG/GT/GA, P = .018, Figure 1C). Given that significant or near significant association was obtained for 1236 and 2677 polymorphisms and interferon treatment (Table 1), we also analyzed the association of these polymorphisms and MMR with the inclusion of interferon treatment in logistic regression model. The genotype effect at both loci remains significant. We have already reported that trough imatinib plasma levels (Cmin) are associated with both cytogenetic and molecular responses to standard-dose imatinib in CML.4 This finding was recently confirmed in the International Randomized Interferon vs STI571 (IRIS) study by Larson et al showing a significant correlation of imatinib Cmin with clinical responses.15 In the current study, we replicated a correlation of Cmin and MMR after 12 months of imatinib (P = .007). A significant link was also found between complete molecular response (defined as negative BCR-ABL by quantitative reverse-transcriptase PCR) and Cmin (P = .025, data not shown). Among polymorphisms tested, the homozygosity for the 1236T allele correlated with higher Cmin levels (70% of 1236TT patients with Cmin > 1000 ng/mL vs 46.3% for other patients; P = .046, Figure 1D).
We further investigated whether the haplotypes derived from tested MDR1 polymorphisms (Figure 1A) were associated with MMR or imatinib plasma levels. Patients who are carriers of haplotype 1 (CG) had MMR less frequently than patients with remaining haplotypes (44.6% vs 81%, P = .003). This association was the result of lower MMR rates among patients with 1a haplotype (GCG; 44.6% vs 70%, P = .02, Figure 1E), according to its expected functional role.15 In contrast, MMR was higher in haplotype 4 (TT) carriers compared with the remaining patients (61.5% vs 41.2%, P = .05). The same haplotype correlated with higher Cmin (59.6% of patients with haplotype 4 had Cmin > 1000 ng/mL vs 36.4% of patients without this haplotype; P = .03, Figure 1F), probably resulting from higher drug concentration (Cmin > 1000 ng/mL) among carriers of haplotype 4b (TTT; 59.2% vs 38.2%, P = .05).
To interpret the results, we have to keep in mind that Cmin is the result of many pharmacokinetic and genetic determinants in addition to the MDR1, such as CYP3A5, hOCT, and plasmatic transporters. Gurney et al recently genotyped 22 patients and reported that homozygotes for the T nucleotide at each of the loci 1236C>T, 2677G>T/A, and 3435C>T had higher estimated imatinib clearance and, hence, a lower rate of toxicity, resulting in 3 months' dose reduction compared with patients with CC or GG genotypes.6 These results are surprising in light of the impressive report demonstrating lower activity of the T allele of the silent 3435C>T polymorphism.16 Likewise, the study of Wang et al showed an association between decreased mRNA and the 3435T allele.17
In conclusion, genotyping MDR1 polymorphisms is easy to perform, and we have set up a straightforward genetic test from cDNA material that could be useful for early identification of the good or poor responders to imatinib among CML patients. We are going to test these findings in a separate and larger patient population with newly diagnosed CML.
The publication costs of this article were defrayed in part by page charge payment. Therefore, and solely to indicate this fact, this article is hereby marked “advertisement” in accordance with 18 USC section 1734.
Acknowledgments
This work was supported by grants from Association pour la Recherche contre le Cancer (ARC) and the Assocaition of Laurette Fugain (Paris, France).
Authorship
Contribution: F.-X.M. and S.D. performed the conception and the design of the study; S.D. did the experiments and performed data analysis; F.-X.M., S.D., and M.K. discussed the final results and wrote the article; and all authors contributed to data interpretation, revised the article critically for the intellectual content, and collaborated on the final approval of the version to be published.
Conflict-of-interest disclosure: The authors declare no competing financial interests.
Correspondence: François-Xavier Mahon, Laboratoire Hématopoïèse Leucémique et cible thérapeutique, Université Victor Ségalen Bordeaux 2, 146 rue Léo Saignat, Inserm U876, 33076 Bordeaux Cedex, France; e-mail: francois-xavier.mahon@umr5540.u-bordeaux2.fr.


