Abstract
We report 2 novel, cryptic chromosomal abnormalities in precursor B-cell acute lymphoblastic leukemia (BCP-ALL): a translocation, either t(X;14)(p22;q32) or t(Y;14)(p11;q32), in 33 patients and an interstitial deletion, either del(X)(p22.33p22.33) or del(Y)(p11.32p11.32), in 64 patients, involving the pseudoautosomal region (PAR1) of the sex chromosomes. The incidence of these abnormalities was 5% in childhood ALL (0.8% with the translocation, 4.2% with the deletion). Patients with the translocation were older (median age, 16 years), whereas the patients with the deletion were younger (median age, 4 years). The 2 abnormalities result in deregulated expression of the cytokine receptor, cytokine receptor-like factor 2, CRLF2 (also known as thymic stromal-derived lymphopoietin receptor, TSLPR). Overexpression of CRLF2 was associated with activation of the JAK-STAT pathway in cell lines and transduced primary B-cell progenitors, sustaining their proliferation and indicating a causal role of CRLF2 overexpression in lymphoid transformation. In Down syndrome (DS) ALL and 2 non-DS BCP-ALL cell lines, CRLF2 deregulation was associated with mutations of the JAK2 pseudokinase domain, suggesting oncogenic cooperation as well as highlighting a link between non-DS ALL and JAK2 mutations.
Introduction
Cytokines and their receptors play an important role in cell survival, proliferation, and differentiation during hematopoiesis.1 Cytokine receptors lack intrinsic catalytic activity and depend on the tyrosine kinase activity of the Janus family of tyrosine kinases. The role of the cytokine interleukin-7 (IL7) signaling in human lymphoid differentiation differs from its role in mice, but has been extensively demonstrated through the study of naturally occurring mutants.2 The receptor for IL7 is composed of 2 chains, Interleukin-2 receptor gamma (IL2RG) and IL7 receptor alpha (IL7RA).3 Intracellular signaling from the IL7 receptor is believed to occur through the JAK1 and JAK3 kinases, resulting in activation of the STAT transcription factors.
Thymic stromal-derived lymphopoietin (TSLP) is an epithelial-derived cytokine that strongly activates dendritic cells. One significant role of TSLP deregulation is the control of inflammatory and allergic processes.4 It was isolated as a cytokine mediating B-cell precursor proliferation and survival in vitro.5 The TSLP and IL7 receptors share IL7RA, although TSLP possesses an IL2RG-related second chain: cytokine receptor-like factor 2 (CRLF2) or TSLPR. Although signaling from the TSLP receptor is known to lead to STAT5 activation, the precise kinase responsible for this is species specific and remains controversial.6-9
Acute lymphoblastic leukemia (ALL) is the most common malignancy in children,10 representing a highly aggressive disease in all age groups. Children with Down syndrome (DS) have a 10- to 20-fold increased risk of developing acute leukemia: both acute myeloid leukemia, particularly acute megakaryoblastic leukemia and B-cell precursor-ALL (BCP-ALL).11 Approximately 1 in 150 persons with DS develop leukemia, implying that the gain of chromosome 21 alone is insufficient for leukemogenesis. However, there is evidence that it represents an early event in a multistep process. For example, mutations of GATA1 have been demonstrated to cooperate with trisomy 21 in transformation to DS acute megakaryoblastic leukemia.12 Recently, mutations within the JAK2 pseudokinase domain have been described as a significant event in the development of BCP-ALL in DS.13-15
Acquired genetic changes provide essential diagnostic and prognostic markers in ALL and are used in the risk stratification of patients for treatment.16 Genomic studies have discovered novel aberrations involving genes involved in B-cell differentiation and cell cycle control that have been linked to prognosis and relapse in BCP-ALL.17-20 Translocations involving the immunoglobulin heavy chain locus, IGH@, have been identified as a new cytogenetic subgroup in BCP-ALL at an incidence of approximately 3%, occurring predominantly among older children and young adults.21 They result in juxtaposition of the IGH@ transcriptional enhancers to genes on partner chromosomes, leading to their deregulated expression.21-24 We have described deregulated expression of the type 1 cytokine receptor erythropoietin receptor precursor, EPOR, in 2 patients with BCP-ALL and the translocation, t(14;19)(q32;p13).25 Here we report the involvement of another cytokine receptor chain, CRLF2, through 2 novel genomic abnormalities that involve the pseudoautosomal region, PAR1, of both sex chromosomes in translocations and interstitial deletions, leading to deregulated CRLF2 signaling.
Methods
Patients and cell lines
The BCP-ALL patients in this study were identified from the Leukaemia Research UK Cancer Cytogenetics Group Karyotype Database in Acute Leukaemia (n = 89)26 or other cytogenetic laboratories (n = 9) and treated over a 17-year period (1991 to 2008). Informed consent was obtained in accordance with the Declaration of Helsinki and ethics committee approval was obtained from each participating institution.
Two BCP-ALL cell lines, MHH-CALL-4 and MUTZ5 (DSMZ), were grown in RPMI-1640 medium supplemented with 20% fetal calf serum and 1% glutamine (Sigma-Aldrich) and maintained at 106 cells/mL.
Cytogenetics and FISH
Cytogenetics and fluorescence in situ hybridization (FISH) were performed on the same diagnostic and relapse samples in patients and cell lines. The involvement of IGH@ was determined by interphase FISH, using the LSI IGH Dual Color Break-Apart Rearrangement Probe (Abbott Diagnostics).21 Whole chromosome painting probes (wcpX and wcpY) (STAR*FISH Cambio and MPBIO) and specific probes were hybridized to identify the partner chromosome and map the breakpoint positions on Xp and Yp.21 Two alternative break-apart probes were designed to identify the involvement of CRLF2 in the translocation, as indicated in Figure 1. The normal signal pattern for these and all other break-apart probes is 0 red, 0 green, and 2 fusion signals (0R0G2F). A break-apart probe to P2RY8 was designed to map the centromeric breakpoint of the deletion in patients with a deleted green signal from CRLF2 probe 1 (Figure 1). A commercial probe to CDKN2A: LSI p16 (9p21) SpectrumOrange/CEP 9 SpectrumGreen (Abbott Diagnostics) or homegrown probe was used to evaluate deletions on 9p.27 Results were recorded using a Zeiss Axioscop fluorescence microscope (Zeiss) fitted with a 100×/1.30 oil objective, CCD camera and digital imaging software from Metasystems (ISIS software version 5.1.9) and Applied Imaging (Cytovision Version 4.5).
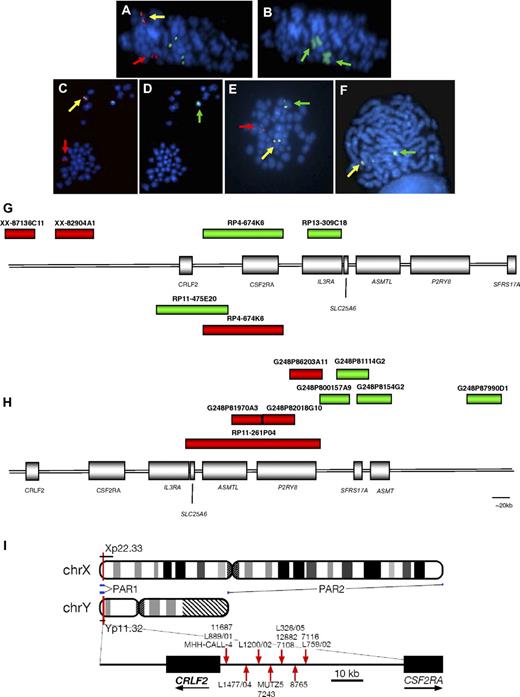
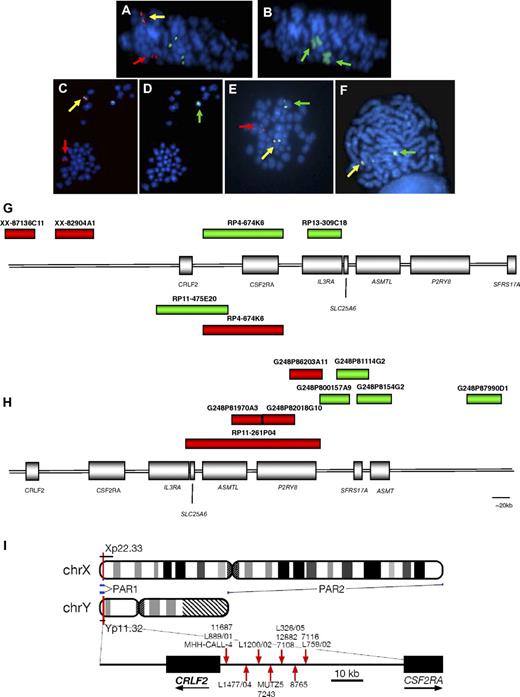
Involvement of IGH@ and CRLF2. The same metaphases from a patient with t(X;14) (A-B) and one with t(Y;14) (C-D) showing a positive result with the IGH@ probe: normal chromosome 14 (yellow arrows), derived chromosome 14 (der(14); red arrows; panels A,C); involvement of the X chromosomes (wcpX; green arrows on der(X)x2; panel B), involvement of Y chromosome (wcpY; green arrow; panel D). Representative metaphase hybridized with CRLF2 probe 1 showing the translocation (E) normal X (yellow arrow), der(14) (red arrow), der(X) (green arrow). Representative metaphase hybridized with the probe to P2RY8 showing the deletion (F): normal X (yellow arrow), X with deletion of red signal covering 3′ P2RY8 (green arrow). Magnification, ∼ × 1000. FISH probe designs for break-apart probes to CRLF2, probes 1 and 2 (G), and P2RY8 (H). (G) The red and green boxes above the schematic representation of PAR1 show the clones (Wellcome Trust Sanger Institute) used in the design of CRLF2 probe 1 (clone names given above each bar). The red and green boxes below the schematic indicate the clones (Invitrogen) used in the design of CRLF2 probe 2. (H) FISH probe design for P2RY8. Fosmid and BAC clone names are given above each bar. (I) Idiograms of X and Y chromosome showing the location of the PAR1 region. Breakpoint locations cloned by LDI-PCR from IGHJ segments are marked with red arrows.
Involvement of IGH@ and CRLF2. The same metaphases from a patient with t(X;14) (A-B) and one with t(Y;14) (C-D) showing a positive result with the IGH@ probe: normal chromosome 14 (yellow arrows), derived chromosome 14 (der(14); red arrows; panels A,C); involvement of the X chromosomes (wcpX; green arrows on der(X)x2; panel B), involvement of Y chromosome (wcpY; green arrow; panel D). Representative metaphase hybridized with CRLF2 probe 1 showing the translocation (E) normal X (yellow arrow), der(14) (red arrow), der(X) (green arrow). Representative metaphase hybridized with the probe to P2RY8 showing the deletion (F): normal X (yellow arrow), X with deletion of red signal covering 3′ P2RY8 (green arrow). Magnification, ∼ × 1000. FISH probe designs for break-apart probes to CRLF2, probes 1 and 2 (G), and P2RY8 (H). (G) The red and green boxes above the schematic representation of PAR1 show the clones (Wellcome Trust Sanger Institute) used in the design of CRLF2 probe 1 (clone names given above each bar). The red and green boxes below the schematic indicate the clones (Invitrogen) used in the design of CRLF2 probe 2. (H) FISH probe design for P2RY8. Fosmid and BAC clone names are given above each bar. (I) Idiograms of X and Y chromosome showing the location of the PAR1 region. Breakpoint locations cloned by LDI-PCR from IGHJ segments are marked with red arrows.
Long-distance inverse PCR
Quantitative real-time PCR
Total cellular RNA was extracted from diagnostic patient samples with the translocation (n = 7), patient samples with the deletion (n = 5), controls without translocations or deletions (n = 17), and BCP-ALL cell lines with (n = 2) and without (n = 12) the translocation. Quantitative real-time PCR was performed using Applied Biosystems TaqMan Gene Expression Assays (CRLF2 assay ID Hs_00845692, IL7RA assay ID Hs_00902334, IL2RG assay ID Hs_00173950, GAPDH assay ID Hs_99999905, and B2M assay ID Hs_99999907), as previously described.21 The comparative Ct method was used to quantify relative mRNA expression levels using the endogenous control genes B2M and GAPDH.
Cell-surface expression of CRLF2: FACS
Staining for flow cytometry was performed in fluorescence-activated cell sorting (FACS) buffer (phosphate-buffered saline, 2 mM ethylenediaminetetraacetic acid, and 1% bovine serum albumin). Antibodies to CRLF2 (clone 1A6) and mouse IgG2a isotype control were obtained from eBiosciences. Acquisition of the data was performed on FACSDiva (BD Biosciences) and analyzed with WinMDI (The Scripps Research Institute, http://facs.scripps.edu/software.html).
Retroviral constructs
The human cDNA sequence for CRLF2 (hCRLF2) was cloned from a pMX-puro construct. The coding sequence, preceded by a Kozak consensus sequence, was subcloned into a pcDNA3.1/myc-His vector (Invitrogen), then into a green fluorescent protein bicistronic retroviral vector, MigRI, with BglII and HpaI restriction sites. Phoenix α packaging cell line was transfected with empty vector (EV) control and hCRLF2-containing plasmids by calcium phosphate transfection. Viral supernatants were collected after 24, 36, and 48 hours and stored at −80°C.
Colony-forming cell assay
Cells were harvested from fetal livers of E13.5 embryos from time-mated C57/BL6 mice. Cells (4 × 10⁶) were transferred to a 6-well plate and centrifuged at 400g for 90 minutes in hCRLF2 or EV retroviral supernatants supplemented with stem cell factor (SCF, 50 ng/mL), FLT3 ligand (FLT3L, 10 ng/mL), and IL7 (10 ng/mL; all cytokines from PeproTech), 3 times over a period of 2 days. They were plated in a semisolid, methylcellulose-based medium (StemCell Technologies) in triplicate to assess colony formation. The cytokines support differentiation only to pre-B cells (CD43+, B220+, CD19+, IgM−). On day 3, green fluorescent protein–positive cells were sorted on a FACSVantage with CellQuest software (Becton Dickinson) until 0.5 × 10⁶ cells were collected. Cells were resuspended in 400 μL Iscove modified medium containing SCF, FLT3L, and IL7 (StemCell Technologies); 3.6 mL of the methylcellulose-based medium was added and cells were evenly resuspended. After 5 minutes, 1.1 mL suspension (containing 0.13 × 10⁶ cells) was plated into 35-mm dishes. Colonies were counted and cells replated every 8 days. Cells were collected by centrifugation, counted, and either snap-frozen for protein lysates or used for FACS staining or further plating.
Flow cytometric analysis for colony-forming cell assay
Cells (1.5 × 10⁵) were stained for 1 hour on ice with saturating concentrations of PE-labeled anti–mouse CD43, Cy5-labeled anti–mouse CD19, or anti–mouse μ chain antibodies (eBiosciences). The cells were washed and resuspended in phosphate-buffered saline and analyzed on a FACSCanto with FACSDiva software (Becton Dickinson).
Transfection of BCP-ALL cell lines
Transfection was performed by nucleofection (program X-05) using the Cell Line Nucleofector Kit V (Amaxa) for the Nucleofector Device (Amaxa), according to the manufacturer's protocol. Briefly, 1.5 × 10⁶ cells were transfected with 3 μg of either pGIPZ control vector containing a scrambled, nonsilencing shRNA sequence (Open Biosystems catalog no. RHS4346) as a control or 1 of 2 different pGIPZ CRLF2 targeting shRNA plasmids (Open Biosystems).
MTS assay
Cell proliferation was determined using the CellTiter 96 AQueous Assay (Promega). Absorbance was recorded at 490 nm. Experiments were carried out in 96-well plates in triplicate with cells seeded at 105 cells per well. Data were plotted to show the mean and SE (n = 3), and subjected to statistical analysis using Graphpad Prism (Graphpad Software Inc) and the Student t test.
JAK2 and STAT5 phosphorylation
Cells were harvested from the second plating and lysed in buffer containing 1% Triton X-100, 10 mM Tris, pH 7.5, 50 mM NaCl, 5 mM ethylenediaminetetraacetic acid, 20% glycerol in the presence of protease inhibitors (Boehringer Ingelheim), and 1 mM sodium orthovanadate. Western blotting was performed using 100 μg cell lysates. Cell lines and colony-forming cell (CFC) cell protein lysates were probed with anti–phospho JAK2 (Y1007/Y1008), anti–phospho STAT5 (Tyr694; Cell Signaling Technology Inc), anti-STAT5, anti-JAK2 (Santa Cruz Biotechnology Inc), and anti–β-actin and anti-CRLF2 (AF981; R&D Systems).
Knockdown of CRLF2
CRLF2 protein expression was knocked down in MUTZ5 using 2 short hairpin RNAs (shRNAs; Open Biosystems); anti-CRLF2 shRNA plasmids and control vector (catalog no. RHS4346) were transfected by nucleofection into MUTZ5. After 3 to 4 days in culture, 50 μg total protein lysates was prepared and probed with an antibody specific for CRLF2 (AF981; R&D systems). The growth of the cells was monitored using an MTS assay (Promega).
CRLF2 mutational analysis
PCR primers were designed to amplify CRLF2 exons 1 to 6, using DSGene software (Accelrys). Genomic DNA from 9 patients and the 2 cells lines was amplified using Amplitaq Gold (Applied Biosystems) prior to denaturing high-performance liquid chromatography with Transgenomic patented separation DNASep cartridges for mutation detection (Transgenomic Wave system). Normal DNA samples (n = 29) were used as negative controls. Amplicons with chromatographic profiles differing from wild type were purified with the QIAquick PCR purification kit (QIAGEN), sequenced by Geneservice, and analyzed using DSGene software.
JAK2 mutational analysis
Genomic DNA was extracted from the bone marrow biopsy or samples fixed for cytogenetic analysis. Primers were used to amplify exon 14 of the JAK2 gene as described previously.15 PCR products were directly sequenced using BigDye Terminator sequencing chemistry (Applied Biosystems) following direct purification of the PCR products by magnetic bead separation (Ampure).
Genomic oligonucleotide arrays
DNA was extracted using either the Gentra or DNeasy blood and tissue kit (QIAGEN). Array-based comparative genomic hybridization (aCGH) was performed on a Human Genome CGH Microarray 244A platform (7 patients and 2 cell lines), or a custom Human Genome CGH Microarray 105K platform (6 patients) with additional probes to the PAR1 region (Agilent Technologies). Test and sex-matched DNA (Promega) was hybridized to the arrays and scanned. Signal intensities from the generated images were measured using Feature Extraction 9.5.3 (Agilent Technologies) and imported into CGH Analytics Version 3.5.14 software packages (Agilent Technologies). Analysis of genomic gains and losses was performed using Spotfire DecisionSite Software for Functional Genomics (TIBCO Software Inc, http://spotfire.tibco.com). All data are available upon request. All microarray data have been deposited with Gene Expression Omnibus (GEO) under accession number GSE17165.29
Results
Clinical and demographic data of patients with translocations and deletions involving CRLF2
We identified 97 BCP-ALL patients with chromosomal abnormalities involving PAR1, 33 with translocations, either t(X;14)(p22;q32) or t(Y;14)(p11;q32), and 64 with deletions, either del(X)(p22.33p22.33) or del(Y)(p11.32p11.32) (Table 1). An incidence of 0.8% for the translocations (accounting for ∼ 23% of all IGH@ translocations) and 4.2% for the deletions was determined by screening 1000 unselected cases of childhood ALL by FISH using the CRLF2-specific probe 1 (Figure 1). The clinical and demographic features of these patients are summarized in Table 1 and detailed in supplemental Table 1 (available on the Blood website; see the Supplemental Materials link at the top of the online article). For the cohort overall, the median age was 5.5 years (range, 1-76 years), their median white blood cell count (WBC) was 25 × 109/L (range, 1-400 × 109/L), and all were positive for CD10 and CD19. Apart from intrachromosomal amplification of chromosome 21 (iAMP21),30,31 none of the patients in this study showed established chromosomal abnormalities of prognostic significance (high hyperdiploidy, rearrangements of MLL or BCR-ABL1, and ETV6-RUNX1 fusions) either from karyotyping or routine FISH screening.32 iAMP21 patients accounted for 38% (11/29) of the non-DS patients with the deletion and 17% (11/64) of the iAMP21 cases tested.
The 33 patients with the translocations included 6 DS children and one patient with Klinefelter syndrome (L759/02). The median age at diagnosis for this group was older than expected for BCP-ALL, at 16 years (range, 3-76 years), with a median WBC of 40 × 109/L (range, 1-342 × 109/L).
The 64 patients with interstitial deletions centromeric of CRLF2 included 35 DS. The median age of this group was 4 years (range, 1-35 years), lower than those with the translocation, and the group had a slightly lower median WBC of 22 × 109/L (range, 1-400 × 109/L). When divided into DS and non-DS the median age was 3 years (range, 1-18 years) and 6 years (range, 1-35 years), respectively. Among 68 DS patients tested, 35 (52%) had the deletion, whereas the remaining 33 patients (48%, data not shown) without the deletion had a median age of 7.5 years (range, 1-16 years) and WBC count of 8 × 10⁹/L (range, 2-605 × 109/L).
FISH identifies translocations and deletions within PAR1
The cryptic translocations were identified by FISH using the probe to IGH@, with the positive result 1R1G1F (Figure 1A,C). Several patients showed additional copies of the partner chromosomes, indicated from the signal pattern with this probe (supplemental Table 1a). The involvement of the sex chromosomes in the translocations was identified by wcpX and wcpY (Figure 1B,D). Mapping by FISH using probes located along the short arms of the sex chromosomes confirmed that the translocation involved PAR1 and specifically the cytokine receptor, CRLF2, at Xp22 and Yp11. Break-apart probes (CRLF2 probes 1 and 2) to CRLF2 hybridized to the same samples (Figure 1E,G) showed the split signal patterns 1R1G1F (probe 1; Figure 1E) and 1R1G1F or 0R1G2F (probe 2), which, in association with the positive result from the IGH@ probe, confirmed the involvement of CRLF2 in the reciprocal translocation. The signal patterns 1R1G2F and 1R2G1F (CRLF2 probe 1) indicated that the translocation was associated with an additional normal or derived X chromosome, respectively. They were observed at a high incidence of 27% (n = 9/33) among the translocation patients (Table 1). The loss of a green signal (1R0G1F) with CRLF2 probe 1 indicated that, in association with the translocation, a cryptic deletion of the derived sex chromosome was present within the region centromeric of CRLF2. This was detected in 25% (n = 6/24) of patients tested with probe 1.
It is known that a high proportion of DS patients with ALL show gain of an X chromosome within the karyotypes of their leukemic blasts.33 The observation that gain of X and/or DS (n = 9, 27%; n = 6, 18%, respectively) were predominant among this series of translocation patients prompted us to test a further cohort of DS-ALL in search of additional cases with these translocations. Among 68 other DS patients tested by FISH, no additional patients with the translocation were identified; however 52% (n = 35) showed deletion of the green signal centromeric of CRLF2 in the absence of the translocation, of which 26% (n = 9) also had the gain of an X chromosome. Prompted by these findings, we tested non-DS-ALL patients with gain of X and gain/abnormality of chromosome 21: 29 patients were identified with this interstitial deletion. Its incidence was high at 38% (11/29 patients tested) in non-DS patients with iAMP2130,31 (Table 1 and supplemental Table 1b).
FISH mapping the extent of the deletion indicates 5′ P2RY8 as the proximal breakpoint
Serial hybridization with probes located centromeric of CRLF2 identified that the deletion incorporated the IL3RA and CSF2RA genes and defined the proximal breakpoint as the 5′ centromeric end of the G protein–coupled purinergic receptor P2Y8, P2RY8. The signal pattern 0R1G1F with the P2RY8 break-apart probe denoted a telomeric deletion of the 3′ portion of this gene (Figure 1F,H) and confirmed this breakpoint in 62 of the patients with this deletion (translocation patients [n = 5], deletion patients [n = 57]) with one translocation patient (10692) harboring a different proximal breakpoint (supplemental Table 1a-b). The signal patterns from this probe, in combination with CRLF2 probe 1, defined both the proximal and distal breakpoint of this interstitial deletion, respectively. Metaphase analysis showed that the red signal of the CRLF2 probe and/or the green signal of the P2RY8 probe were retained on the sex chromosome, ruling out the presence of an unbalanced translocation.
Long-distance inverse PCR confirmed the involvement of CRLF2
LDI-PCR confirmed the involvement of CRLF2 in 11 translocation patient samples and 2 cell lines, MHH-CALL-4 and MUTZ5, with unbalanced t(Y;14) translocations. The breakpoints were clustered within a 27-kb region (summarized in Figure 1I, breakpoint details are provided within supplemental Table 1a and summarized in supplemental Table 2). The translocation juxtaposes the IGHJ segments to the region immediately centromeric of CRLF2, although, similar to all other IGH@ translocations, it does not affect the coding region of the gene. The primary sequence data from the 11 patients and 2 cell lines are provided in supplemental Figure 1. Sequencing traces are available in the DDBJ/EMBL/GenBank nucleotide sequence databases (accession numbers: AB506477, AB506478, AB506479, AB506480, AB506481, AB506482, AB506483, AB506484, AB506485, AB506486, and AB506487).34
Quantitative real-time PCR and flow cytometry showed overexpression of CRLF2 mRNA and protein
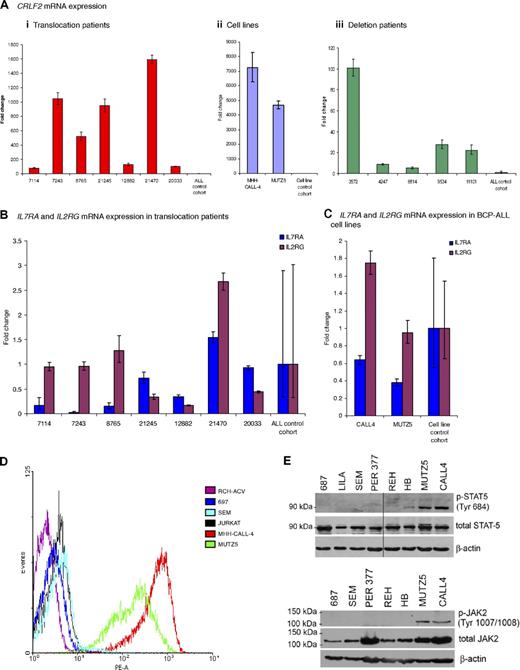
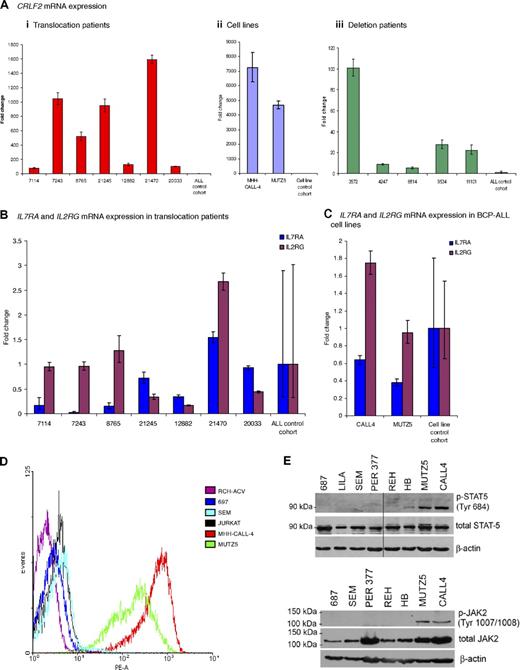
Quantitative real-time PCR showed an increase in CRLF2 mRNA expression in samples from patients and cell lines with the translocation (n = 7 and n = 2, respectively) and deletion (n = 5; Figure 2Ai-iii). mRNA levels were increased from 80- to more than 1500-fold in the translocation patients and from 3500- to more than 7000-fold in the cell lines, compared with the mean of the patient controls or cell line controls, respectively (Figure 2Ai-ii). Samples from patients with the deletion also showed a significant increase in CRLF2 expression from 5- to 100-fold, although at a lower level than the translocation patients compared with the same controls (Figure 2Aiii). Due to the heterodimeric nature of the IL7 and TSLP receptors, we assessed the mRNA levels of IL7RA and IL2RG in patients and cell lines with the translocation. Both were apparently normally expressed (Figure 2B-C). A high CRLF2 protein expression was confirmed by flow cytometry, which measured relative cell surface CRLF2 expression in the 2 cell lines compared with 4 control ALL cell lines (Figure 2E).
CRLF2, IL7RA, and IL2RG mRNA expression and activation of the JAK-STAT pathway. (A) Fold change of mRNA expression measured by the comparative Ct method of CRLF2 in (i) translocation patient samples (n = 7) compared with control patient cohort (n = 17) without the translocation or deletion (ii). Cell lines (n = 2) with the translocation compared with cell line control cohort (n = 12): RCH-ACV, REH, Per365, 697, 380, Tanoue, LILA-1, SEM, LK63 (BCP-ALL) RAJI, DHL4 (B-cell lymphoma), and HL-60 (acute myeloid leukemia) without the translocation or deletion and (iii) deletion patient samples (n = 5) compared with the same patient control cohort (n = 17). IL7RA and IL2RG mRNA expression measured in (B) 7 patients with the translocation compared with the patient control cohort (C) the cell lines (n = 2) compared with a cell line control cohort. The error bars for the control cohorts indicate the variable expression of all target genes tested. (D) Flow cytometry histogram of control cell lines (RCH-ACV; 697; SEM; JURKAT) and translocation positive cell lines (MHH-CALL-4 and MUTZ5) using a PE-labeled antibody to CRLF2. (E) Western blot showing presence of phosphorylated STAT5 and JAK2 observed in translocation-positive cell lines, MHH-CALL-4 and MUTZ5, compared with other cell lines.
CRLF2, IL7RA, and IL2RG mRNA expression and activation of the JAK-STAT pathway. (A) Fold change of mRNA expression measured by the comparative Ct method of CRLF2 in (i) translocation patient samples (n = 7) compared with control patient cohort (n = 17) without the translocation or deletion (ii). Cell lines (n = 2) with the translocation compared with cell line control cohort (n = 12): RCH-ACV, REH, Per365, 697, 380, Tanoue, LILA-1, SEM, LK63 (BCP-ALL) RAJI, DHL4 (B-cell lymphoma), and HL-60 (acute myeloid leukemia) without the translocation or deletion and (iii) deletion patient samples (n = 5) compared with the same patient control cohort (n = 17). IL7RA and IL2RG mRNA expression measured in (B) 7 patients with the translocation compared with the patient control cohort (C) the cell lines (n = 2) compared with a cell line control cohort. The error bars for the control cohorts indicate the variable expression of all target genes tested. (D) Flow cytometry histogram of control cell lines (RCH-ACV; 697; SEM; JURKAT) and translocation positive cell lines (MHH-CALL-4 and MUTZ5) using a PE-labeled antibody to CRLF2. (E) Western blot showing presence of phosphorylated STAT5 and JAK2 observed in translocation-positive cell lines, MHH-CALL-4 and MUTZ5, compared with other cell lines.
Western blotting for pSTAT5 and pJAK2 suggests activation of the JAK-STAT pathway
Intracellular signaling from the wild-type TSLP receptor is thought to lead to STAT5 activation, possibly following JAK2 activation. The phosphorylation status of JAK2 and STAT5 was investigated by Western blot analysis of extracts from the 2 BCP-ALL cell lines, MHH-CALL-4 and MUTZ5. Both showed phosphorylated JAK2 and STAT5, indicating the activation of this pathway (Figure 2F).
Retrovirus-mediated expression of CRLF2 stimulates the growth of primary lymphoid progenitors
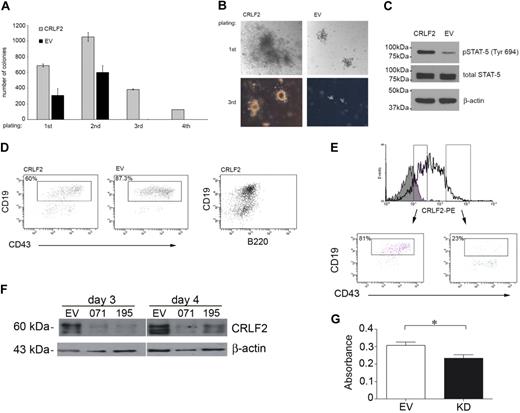
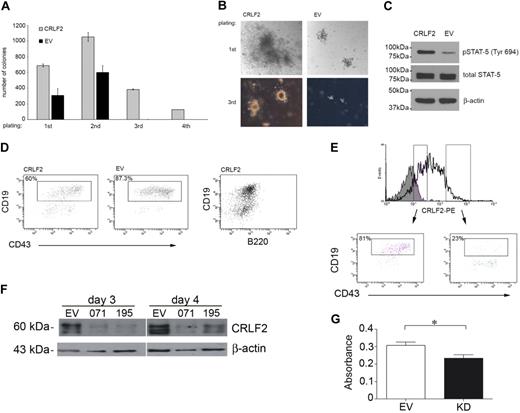
The effect of CRLF2 on proliferation of primary lymphoid progenitors was assessed by colony formation of mouse fetal liver cells infected with hCRLF2. The cytokines added to the medium support differentiation only to pre-B cells (CD43+, B220+, CD19+, IgM−) and approximately 95% of cells in culture were CD43+/B220+ from first plating, with little contamination from CD13+ myeloid cells (∼ 1%-2%, not shown). After 8 days in culture, colonies from hCLRF2-expressing cells were significantly higher in number (unpaired Student t test, first and second plating, P < .001; third plating, P < .001) and larger in diameter compared with EV controls (Figure 3A-B). These differences were consistent for all passages. Differences were most pronounced for the third plating. hCRLF2-expressing cells continued to proliferate in the fourth plating, whereas EV did not.
Retroviral overexpression of CRLF2 in hematopoietic progenitors results in increased proliferation and STAT-5 phosphorylation. Conversely, knockdown of CRLF2 results in decreased proliferation. (A) CFC assay on E13.5 mouse fetal liver cells infected with hCRLF2 or EV control retroviruses and grown in methylcellulose semisolid medium supplemented with IL-7, SCF, and FLT3L. Values are average of 2 independent experiments; error bars indicate SDs. All 4 platings show statistical significance between EV and hCRLF2 for number of colonies (unpaired Student t test, first and second plating P < .001, third plating P < .001); only hCFL2 colonies grew in fourth replating. EV colonies represented 44.9% ± 13.3%, 57.1% ± 11.2%, and 0.43% ± 0.3% of the number of CRLF2 colonies at first, second, and third plating, respectively. (B) Images showing relative sizes of colonies formed by hCRLF2- and EV-transduced hematopoietic progenitors at 2 platings. (C) Lysed hCRLF2-infected cells from second plating have increased STAT-5 Y694 phosphorylation compared with EV cells. (D) A higher proportion of CRLF2-overexpressing cells at second plating show less differentiated phenotype compared with EV cells. CD43+/B220+/CD19+ pre-B cells were more prevalent in EV than hCRLF2 cell populations (P < .001), suggesting that increased proliferation is accompanied by maintenance of a larger pool of cells with immature immunophenotype: CD43+/B220+/CD19− corresponding to Hardy fraction A. (E) flow cytometric evaluation of hCRLF2 surface expression in cells from hCRLF2 hematopoietic progenitor colonies at second plating. Solid histogram represents cells stained with a negative control antibody. hCRLF2-positive cells with lower hCRLF2 expression have a higher proportion of CD43+/CD19+ cells (81%) compared with cells with high expression of hCRLF2 (23.5%). By third plating, all CRLF2 cells are CD43+/CD19+ with almost negligible μ expression (not shown). (F) Cell lysates were prepared from the MUTZ5 cell line, 3 and 4 days following transfection, with either scrambled control (SC) or CRLF2 shRNA knockdown plasmids (071 and 195) and probed with antibodies specific for CRLF2 or β-actin. (G) MUTZ5 cells were transfected with either SC or CRLF2 shRNA knockdown plasmid 071 (KD) and proliferation was monitored using an MTS assay (n = 3). The down-regulation of CRLF2 expression in MUTZ5 results in a significant decrease in proliferation (P = .029, unpaired t test).
Retroviral overexpression of CRLF2 in hematopoietic progenitors results in increased proliferation and STAT-5 phosphorylation. Conversely, knockdown of CRLF2 results in decreased proliferation. (A) CFC assay on E13.5 mouse fetal liver cells infected with hCRLF2 or EV control retroviruses and grown in methylcellulose semisolid medium supplemented with IL-7, SCF, and FLT3L. Values are average of 2 independent experiments; error bars indicate SDs. All 4 platings show statistical significance between EV and hCRLF2 for number of colonies (unpaired Student t test, first and second plating P < .001, third plating P < .001); only hCFL2 colonies grew in fourth replating. EV colonies represented 44.9% ± 13.3%, 57.1% ± 11.2%, and 0.43% ± 0.3% of the number of CRLF2 colonies at first, second, and third plating, respectively. (B) Images showing relative sizes of colonies formed by hCRLF2- and EV-transduced hematopoietic progenitors at 2 platings. (C) Lysed hCRLF2-infected cells from second plating have increased STAT-5 Y694 phosphorylation compared with EV cells. (D) A higher proportion of CRLF2-overexpressing cells at second plating show less differentiated phenotype compared with EV cells. CD43+/B220+/CD19+ pre-B cells were more prevalent in EV than hCRLF2 cell populations (P < .001), suggesting that increased proliferation is accompanied by maintenance of a larger pool of cells with immature immunophenotype: CD43+/B220+/CD19− corresponding to Hardy fraction A. (E) flow cytometric evaluation of hCRLF2 surface expression in cells from hCRLF2 hematopoietic progenitor colonies at second plating. Solid histogram represents cells stained with a negative control antibody. hCRLF2-positive cells with lower hCRLF2 expression have a higher proportion of CD43+/CD19+ cells (81%) compared with cells with high expression of hCRLF2 (23.5%). By third plating, all CRLF2 cells are CD43+/CD19+ with almost negligible μ expression (not shown). (F) Cell lysates were prepared from the MUTZ5 cell line, 3 and 4 days following transfection, with either scrambled control (SC) or CRLF2 shRNA knockdown plasmids (071 and 195) and probed with antibodies specific for CRLF2 or β-actin. (G) MUTZ5 cells were transfected with either SC or CRLF2 shRNA knockdown plasmid 071 (KD) and proliferation was monitored using an MTS assay (n = 3). The down-regulation of CRLF2 expression in MUTZ5 results in a significant decrease in proliferation (P = .029, unpaired t test).
To assess whether CRLF2 was mediating the increased proliferation through STAT5 activation, cells from the second plating were lysed and STAT5 phosphorylation was evaluated by Western blotting (Figure 3C). STAT5 phosphorylation at Tyr694 was increased in hCRLF2-positive cells compared with EV cells, whereas no differences were observed in total STAT5 levels.
A higher proportion of hCRLF2-expressing cells showed a less differentiated phenotype compared with EV cells. This was indicated by the presence of a higher number of CD43+/CD19+ pre-B cells in EV colonies (87.3%) than in hCRLF2 colonies (60%), implicating that the increased proliferation was accompanied by maintenance of a larger pool of cells with an immature CD43+/B220+/CD19− phenotype (Figure 3D). This was confirmed within the hCRLF2-positive population; colonies with lower expression had a higher proportion of CD43+/CD19+ cells (81%) compared with those with high expression of CRLF2, whose CD43+/CD19+ population was only 23% of the total (Figure 3E). These data suggest that activation of STAT5 accompanies the overexpression of CRLF2 in B-lymphoid progenitor transformation and that its effect is most pronounced in early B-cell precursors.
Knockdown of CRLF2 decreases proliferation
To demonstrate that CRLF2 expression plays a role in cellular transformation, CRLF2 protein expression was knocked down in the MUTZ5 cell line using shRNA. There was an appreciable decrease in protein expression in cells transfected with anti-CRLF2 shRNA plasmid compared with cells transfected with a scrambled control vector (Figure 3F). Knockdown of CRLF2 resulted in a decrease in the growth of these cells measured using an MTS assay (P = .029, unpaired Student t test; Figure 3G). However the proliferation was not reduced to the extent that would be expected to correlate with the substantially decreased protein level. Taken together, these results show that although CRLF2 overexpression triggers cell survival and growth, it is insufficient to fully transform primary cells. To further investigate this hypothesis, we searched for cooperating mutations.
DS patients with translocations or deletions showed JAK2 mutations
Among 17 DS patients tested for mutations within the JAK2 pseudokinase domain, 60% (n = 11, 2 with the translocation and 9 with the deletion) showed the specific acquired mutation, JAK2R683 (R683G [n = 8], R683S [n = 2], insertion mutation [n = 1]) (Table 1 and supplemental Table S1a-b). In one patient (20033) with the translocation seen at diagnosis and relapse, the JAK2 mutation was found only in the relapse sample. As these mutations were identified in DS-ALL patients with the translocation or deletion, they indicate a potential oncogenic collaboration between CRLF2 overexpression and JAK2 mutation. The 2 cell lines also showed missense mutations of JAK2. MUTZ5 showed the JAK2R683G, whereas MHH-CALL-4 showed an alternative mutation within the pseudokinase domain: JAK2I682F.
CRLF2 mutation screening reveals single nucleotide polymorphism but no somatic mutations
A preliminary mutational screen of CRLF2 exons, encoding proposed extracellular and transmembrane domains, in patients (n = 9: 4 with the translocation, 5 with deletion) and healthy persons (n = 29) revealed A11A (translocation, n = 3; deletion, n = 4; and controls, n = 5), V136M (translocation, n = 1; and controls, n = 3), and P122P (translocation, n = 1). These represent single nucleotide polymorphisms rather then somatic mutations. A nonsynonymous amino acid change, V244M, was seen in both the MHH-CALL-4 and MUTZ5 cell lines.
Genomic analysis of translocation and deletion patients reveals deletions of genes common to other BCP-ALLs
To investigate the global genomic copy number alterations associated with the translocations and deletions, aCGH was carried out on available translocation (n = 7) and deletion (n = 6) patient samples, as well as the cell lines with the translocation (n = 2; Figure 4; detailed in supplemental Table 3). For translocation patient 11687, matched diagnostic and relapse samples were available.
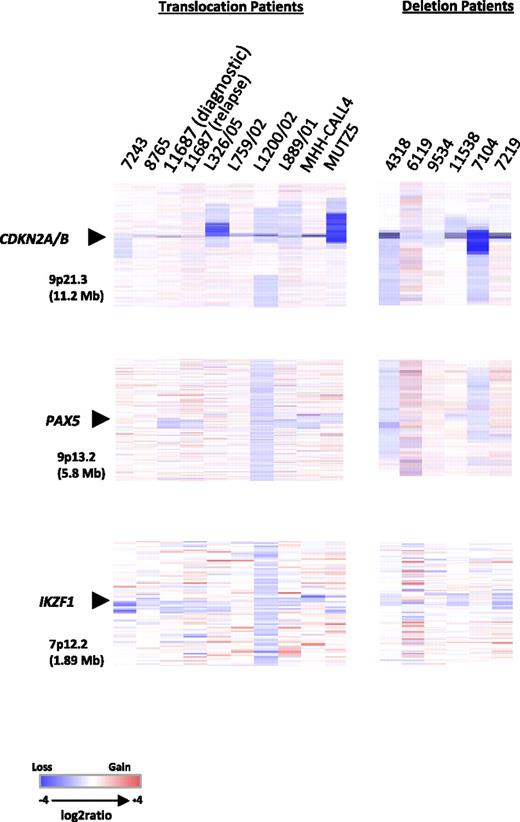
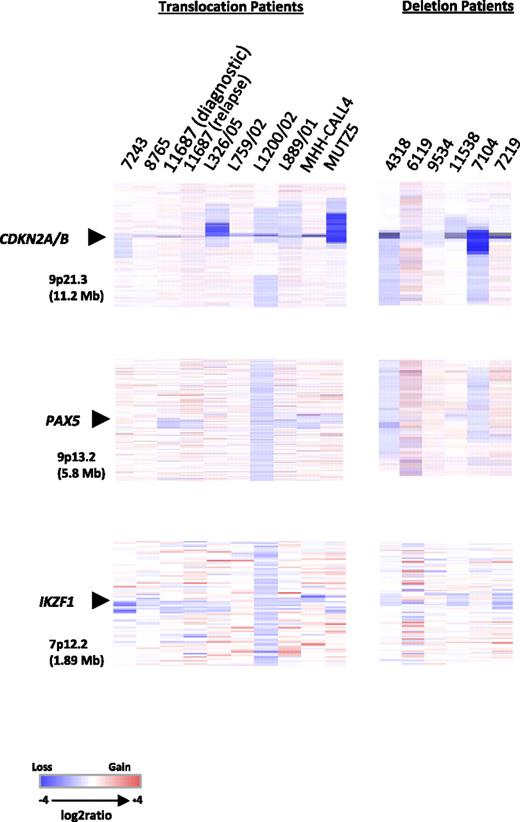
Heat maps of 13 diagnostic BCP-ALL samples, 1 relapse, and 2 cell lines. Focal deletions of CDKN2A/B, PAX5, and IKZF1. Data are divided by aberration: translocation, t(X;14)(p22;q32) and t(Y;14)(p11;q32), and deletion, del(X)(p22.33p22.33) and del(Y)(p11.32p11.32). For samples with the translocations (7 diagnostic, 1 relapse, and 2 cell lines), data were generated using the Human Genome CGH Microarray 244A platform and for samples with the deletion (6 diagnostic) the Human Genome CGH Microarray 105K platform was used. In all heat maps, each sample is represented by a single column, as indicated by the sample identifier at the head of the figure, and each row denotes the log2 ratio for each probe. The probes are plotted in genomic order (hg18) with losses and gains in blue and red, respectively. The size of the regions shown is given in parentheses. Note that the additional probes on the Human Genome CGH Microarray 105K platform for the PAR1 region failed.
Heat maps of 13 diagnostic BCP-ALL samples, 1 relapse, and 2 cell lines. Focal deletions of CDKN2A/B, PAX5, and IKZF1. Data are divided by aberration: translocation, t(X;14)(p22;q32) and t(Y;14)(p11;q32), and deletion, del(X)(p22.33p22.33) and del(Y)(p11.32p11.32). For samples with the translocations (7 diagnostic, 1 relapse, and 2 cell lines), data were generated using the Human Genome CGH Microarray 244A platform and for samples with the deletion (6 diagnostic) the Human Genome CGH Microarray 105K platform was used. In all heat maps, each sample is represented by a single column, as indicated by the sample identifier at the head of the figure, and each row denotes the log2 ratio for each probe. The probes are plotted in genomic order (hg18) with losses and gains in blue and red, respectively. The size of the regions shown is given in parentheses. Note that the additional probes on the Human Genome CGH Microarray 105K platform for the PAR1 region failed.
Copy number changes were observed in all samples. Four DS patients (4318, 6119, 9534, and 11538) clearly showed gain of chromosome 21 corresponding to their constitutional karyotypes. Patient 6119 had an additional acquired chromosome 21. None of the other patients or the 2 cell lines showed copy number changes involving chromosome 21. Recurrent focal and whole gene deletions of CDKN2A, PAX5, and IKZF1 were identified in both the translocation and deletion patients (Figure 4 and Table 1, with details of genomic breakpoints and summary of the extent of the deletions in supplemental Tables 3 and 4, respectively). CDKN2A was deleted in 100% (7/7) of translocation and 83% (5/6) of deletion patients. CDKN2A deletions detected by aCGH were confirmed by FISH in 5 cases, whereas focal deletions were seen in a further 4 patients by aCGH only as they were too small to be detected by FISH. In total, CDKN2A deletions were identified in 54% (14/26, 10 monoallelic and 4 biallelic deletions) of cases tested by FISH. In addition, the cell lines, MHH-CALL-4 and MUTZ5, were normal and showed a biallelic deletion, respectively, by FISH. In the translocation patients, PAX5 was deleted in 43% (3/7) and IKZF1, in 71% (5/7). Conversely, PAX5 deletions were more frequent in the deletion patients than IKZF1 deletions: 66% (4/6) and 50% (3/6), respectively. Deletions involving all 3 loci were observed in the 2 cell lines. Deletions of the known cancer genes, RB1 (2 translocation patients, 2 deletion patients, and MUTZ5) and FHIT (1 patient with the X chromosome deletion, diagnostic and relapse samples of translocation patient 11687), were also detected, albeit at low frequency. Overall a higher number of copy number alterations were seen in the diagnostic compared with the relapse sample from patient 11687, but CDKN2A, PAX5, and IKZF1 deletions were common to both samples. These results indicate that the subset of patients with deregulated CRLF2 shows a pattern of oncogenic events similar to other BCP-ALLs. Attempts to customize the standard 105K arrays with oligonucleotides targeting PAR1 were unsuccessful due to high background noise from these probes. Therefore, it was not possible to delineate the boundaries of the deletion.
Discussion
The involvement of cytokine receptors and JAK kinases is being increasingly reported to play a role in the pathogenesis of BCP-ALL.14,15,25 In this study, we have provided substantial support for this function and evidence of the involvement of the CRLF2 signaling pathway in a lymphoid malignancy from the identification of its deregulated expression. Its overexpression arises from a translocation juxtaposing CRLF2 to the IGH@ enhancer or an interstitial deletion. In cases with both the translocation and the deletion, the deletion is unlikely to have an additive effect on CRLF2 expression. The explanation is that, as a result of the translocation, the entire CRLF2 gene has relocated to the derived chromosome 14. Thus, the deletion, located to the derived sex chromosome, is no longer juxtaposed to CRLF2. Although we were unable to accurately delineate the deletion boundaries by aCGH, data from single nucleotide polymorphism arrays of a similar deletion involving CSF2RA and IL3RA indicated that the breakpoints were variable between patients.18 Nevertheless, one possible explanation for the deregulated expression of CRLF2 in these cases could be that, as a result of the deletion, CRLF2 may become juxtaposed within the region of the gene promoter of P2RY8, SFRS17A, or ASMT. The P2RY8 promoter has previously been described to be involved in promoter swapping with one of the Sry (sex-determining region Y)–box genes (SOX5) on chromosome 12 in a patient with primary splenic follicular lymphoma.35 Deletions of the PAR1 region, including CSF2RA and CRLF2, have been reported in mantle cell lymphoma.35 However, to our knowledge, there are no reports of an acquired, activating chromosomal abnormality within PAR1 in BCP-ALL to date.
In this study, overexpression of CRLF2 was found to occur at a high incidence in DS-ALL patients. Among the DS-ALL patients overexpressing CRLF2 who were tested, the majority had mutations targeting the JAK2 pseudokinase domain, JAK2R683.13-15 These observations suggest an oncogenic cooperation between the 2 events. Interestingly, this particular cooperation resembles the situation in human myeloproliferative syndromes involving the thrombopoietin receptor, MPL, one of several JAK2 receptors, and JAK2 mutations.36 The 2 cell lines, MHH-CALL-4 and MUTZ5, derived from non-DS BCP-ALL showed mutations within the JAK2 pseudokinase domain. These findings indicated that the occurrence of JAK2 mutations is not restricted to DS-ALL patients, as recently confirmed by others.37 Although CRLF2 protein expression was substantially knocked down in the cell lines, proliferation was decreased by only a small amount. The subsequent finding of JAK2 mutations in the cell lines may explain, in part, the reduced ability to decrease proliferation, as the JAK-STAT signaling may be protected from inactivation by, at least, this additional mechanism. There was no evidence of activating somatic mutations of CRLF2 in DS and non-DS patients with the translocation or deletion.
Our results add important information to the role of the IL7-TSLP receptor signaling pathway in lymphoid development. These 2 cytokine receptors are dimeric, share IL7R, and use IL2RG and CRLF2, respectively, to form heterodimers. Inactivation of JAK3, IL2RG, and IL7R has been described in patients with severe combined immunodeficiency.2 Here we demonstrate that CRLF2 signaling, normally involved in the control of the cellular response to inflammatory and allergic stimuli, is also involved in malignant lymphoid transformation. To what extent the intracellular signaling is similar in both situations is to be further investigated.
The majority of these BCP-ALL patients showed a relatively simple karyotype, in which the translocation represented a primary cytogenetic change with the frequent gain of a normal or derived X chromosome. The deletion showed evidence of association with iAMP21. However, aCGH analysis showed that both translocation and deletion patients shared cryptic deletions of the B-cell differentiation and cell cycle control genes in common with other BCP-ALLs.17 The high incidence of CDKN2A deletions implicates cooperation between deregulated CRLF2 and p16INK expression.
Interestingly, those patients with the translocation had a higher median age than those with the deletion. This is in agreement with the older age described for patients with other IGH@ translocations.21 A detailed survival analysis based on a large cohort treated on a single protocol is needed to determine the clinical relevance of these abnormalities.
In conclusion, we have shown that overexpression of CRLF2 is associated with activation of STAT5 in cell lines and transduced primary B-cell progenitors. CRLF2 expression also had the effect of increasing growth of immature B-cell precursors, when mouse fetal liver cells were used as a model for lymphoid progenitors. These factors indicate a causal role of CRLF2 overexpression in lymphoid transformation. These important observations pave the way for a systematic study of ALL for mutations of those genes encoding signaling molecules involved in this pathway. Thus patients with deregulated CRLF2 expression are emerging as a distinct subgroup of BCP-ALL, providing potential molecular targets for therapy.
The online version of this article contains a data supplement.
The publication costs of this article were defrayed in part by page charge payment. Therefore, and solely to indicate this fact, this article is hereby marked “advertisement” in accordance with 18 USC section 1734.
Acknowledgments
The authors thank all the clinicians for providing samples and clinical data, the members of the UK Cancer Cytogenetics Group for cytogenetic data, Clinical Trial Service Unit, University of Oxford, for clinical data, and UK Children's Cancer and Leukemia Group, Leukemia and Lymphoma Division, and Adult Leukemia Working Party members who designed and coordinated the clinical trials through which these patients were identified and treated. The authors are grateful to Dr T. Kitamura, University of Tokyo for providing the pMX-puro construct.
The laboratories of M.J.S.D., R.S., and C.J.H. contributed equally to this work.
This work was supported by Leukaemia Research, Medical Research Council, Hope Foundation for Cancer Research, Deutsche Krebshilfe, and Kinder-Krebs-Initiative Buchholz/Holm-Seppensen.
Authorship
Contribution: L.J.R., M.C., M.J.S.D., R.S., and C.J.H. designed the research and wrote the paper; A.V.M., O.A.B., J.C.S., and O.H. designed some aspects of the research; L.J.R., M.C., I.V., T.A., M.J.C., T.C., E.C., S.G., M.G., D.S.G., C.H., L.H., J.I., L.K., F.N.-K., L. Machado, L. Minto, A.M., H.M., V.R., C.S., and H.T. carried out the experiments and analyzed the data; and all authors critically reviewed the paper.
Conflict-of-interest disclosure: The authors declare no competing financial interests.
Correspondence: Prof Christine J. Harrison, Leukaemia Research Cytogenetics Group, Northern Institute for Cancer Research, Newcastle University, Level 5 Sir James Spence Institute, Royal Victoria Infirmary, Newcastle-upon-Tyne, NE1 4LP United Kingdom; e-mail: christine.harrison@ncl.ac.uk; or Prof Dr. Med Reiner Siebert, Institute of Human Genetics, University Hospital Schleswig-Holstein Campus, Kiel Schwanenweg 24, D-24105 Kiel, Germany; e-mail: rsiebert@medgen.uni-kiel.de; or Prof Martin J. S. Dyer, MRC Toxicology Unit, Hodgkin Bldg Rm 402, Lancaster Rd, Leicester LE1 9HN, United Kingdom; e-mail: mjsd1@le.ac.uk.
References
Author notes
*L.J.R., M.C., and I.V. contributed equally to this work.
†M.J.S.D., R.S., and C.J.H. share senior authorship.

