Abstract
As the expanding obese population grows older, their successful immunologic aging will be critical to enhancing the health span. Obesity increases risk of infections and cancer, suggesting adverse effects on immune surveillance. Here, we report that obesity compromises the mechanisms regulating T-cell generation by inducing premature thymic involution. Diet-induced obesity reduced thymocyte counts and significantly increased apoptosis of developing T-cell populations. Obesity accelerated the age-related reduction of T-cell receptor (TCR) excision circle bearing peripheral lymphocytes, an index of recently generated T cells from thymus. Consistent with reduced thymopoiesis, dietary obesity led to reduction in peripheral naive T cells with increased frequency of effector-memory cells. Defects in thymopoiesis in obese mice were related with decrease in the lymphoid-primed multipotent progenitor (Lin−Sca1+Kit+ Flt3+) as well as common lymphoid progenitor (Lin−Sca1+CD117loCD127+) pools. The TCR spectratyping analysis showed that obesity compromised V-β TCR repertoire diversity. Furthermore, the obesity induced by melanocortin 4 receptor deficiency also constricted the T-cell repertoire diversity, recapitulating the thymic defects observed with diet-induced obesity. In middle-aged humans, progressive adiposity with or without type 2 diabetes also compromised thymic output. Collectively, these findings establish that obesity constricts T-cell diversity by accelerating age-related thymic involution.
Introduction
It is well recognized that induction of negative energy balance by calorie restriction without malnutrition robustly enhances mean and maximal life span.1 The reduced calorie consumption in primates and mice also forestalls the aging of thymus and prevents immunosenescence.2,3 In contrast, obesity, associated with caloric excess, increases the risk of multiple comorbidities that adversely affect the health and life expectancy.4 Although excessive calories and obesity reduces health span, it is unclear whether this involves the mechanisms governing the generation of T cells in the thymus.4 The process of thymic aging is characterized by reduced production of naive T cells and replacement of lymphostromal thymic zones with adipose tissue.3-7 The reduction of thymus-derived naive T cells with age and homeostatic expansion of memory T cells restricts the T-cell repertoire diversity and leads to immunosenescence.8 Consequently, the process of age-related thymic involution contributes to increased susceptibility to infections and cancer and to a higher risk of vaccination failures in the elderly.8-11
Obesity is a multisystem disorder associated with aberrant neuroendocrine response to chronic calorie excess. In the United States alone, obesity is responsible for approximately 300 000 deaths per year.12-14 Type 2 diabetes (T2D), cardiovascular disease, and cancers constitute most the obesity-related rates of mortality and morbidity.14 However, the noncardiovascular disease and noncancer deaths, because of chronic and acute infection, also contribute to substantial adult mortality in obese persons.14 Furthermore, obese subjects are susceptible to postoperative and nosocomial infections and are more likely to develop serious complications from common infections.4,15 In addition, obesity compromises the innate immune responses to the bacterium Porphyromonas gingivalis.16 The obese mice infected with P gingivalis display increased periodontal disease and a blunted expression of proinflammatory cytokines.16 Therefore, a nonspecific low-grade “sterile” chronic inflammation seen during obesity17 is in some respects similar to age-related inflammation18 and does not impart an advantage to the host with regard to mounting a specific proinflammatory response against specific pathogens. Consistent with these data, obese dogs have a greater susceptibility and increased mortality to canine distemper virus infection.19 In addition to reduced vaccination response,20,21 obesity also leads to a 6-fold increase in mortality after influenza infection22 with impaired antigen-specific CD8 T-cell responses.23
The unique 3-dimensional thymic structure is composed of the cortex and the medulla which are composed mainly of distinct developing T-cell subsets and thymic stromal cells.24-26 The cortical and medullary thymic stromal cells provide a unique environment, cell–cell contact, and they produce growth factors required for various aspects of T-cell development.24,26 The cortical thymic epithelial cells (TECs) regulate the migration and expansion of T-cell progenitors, including the positive and negative selection of developing thymocytes.27 The medullary TECs along with antigen-presenting dendritic cells are responsible for deletion of self-reactive T cells and support the late stages of T-cell development.27-29 The thymopoietic potential is compromised with increasing age as a result of multiple causes, including loss of TEC populations,3,30 defects in hematopoietic stem cells (HSCs), and reduction in earliest thymocyte progenitors (ETPs)31,32 and alteration in growth factors and hormones.33
Whether obesity and prolonged nutrient excess affect the mechanisms of thymic involution process remains to be determined. However, previous studies examining immune function in extreme monogenic rodent models of obesity (Lepob/Lepob) have shown clear thymic involution34 and significant defects in T-cell responsiveness.35,36 However, leptin directly affects T cells by functional leptin receptors37-39 and can promote thymic function independently of obesity.33 The effects of diet and hyperphagia versus direct leptin signaling on immune system have not been delineated, and it is not certain whether obesity alone accounts for thymic deficits in the Lepob/Lepob mouse model. Furthermore, the loss-of-function leptin mutations in humans account for a minute fraction of current diet-induced obesity (DIO) “epidemic.”40
Whether obesity induced by hyperphagia affects thymic function has not been examined. Among the genetic causes of obesity, loss-of-function mutation in melanocortin 4-receptor (Mc4r) remains the most common form of monogenic human obesity, accounting for approximately 4% to 6% obesity prevalence.40,41 The activation of Mc4r in the hypothalamus and brainstem initiates an anorexigenic response and also stimulates energy expenditure through the sympathetic nervous system.42 Ablation of the Mc4r gene in mice results in hyperphagia and obesity which is associated with insulin resistance but not frank T2D in mice fed a standard chow diet.43,44
We tested the hypothesis that obesity induced by high-fat diet or chronic hyperphagia would accelerate age-related loss of thymic function. We therefore used ad libitum high-fat diet feeding to induce dietary obesity and tested the effect of resultant adiposity. To test whether chronic hyperphagia (on ad libitum intake of chow diets) induced caloric excess would recapitulate the high-fat DIO, we ablated the Mc4r-mediated satiety signals. The Mc4r knockout mouse model also allows the separation of defects induced by excess caloric intake versus direct effects of Mc4R signaling on lymphoid system because Mc4R is restricted to the CNS. We provide evidence that adiposity compromises the mechanisms regulating thymic function. This involves reduction in T-cell progenitors, increased apoptosis of thymocyte subsets, and lower thymopoiesis. We also demonstrate that, compared with lean and overweight humans, development of obesity with and without T2D significantly reduces the number of recent thymic emigrants (RTEs).
Methods
Materials and reagents
For fluorescence-activated cell sorting (FACS) analysis the following antibodies (from eBiosciences Inc) were used: CD8-allophycocyanin (APC), CD44–fluorescein isothiocyanate (FITC), CD4-phycoerythrin (PE), CD4-FITC, CD4–peridinin chlorophyll protein (PerCP), CD11b, Gr-1-PE, CD45R-PE, CD3-PE, CD8-PE, αβTCR-PE, γδTCR-PE, pan-NK-PE, NK1.1-PE, CD11c-PE, CD19-PE, Ter119-PE, CD127-PE, CD127-APC, Flt3-FITC, CD25-APC, C-kit–FITC, and Sca1-PE.
Subject population
The T-cell receptor (TCR) excision circle (TREC) assay was performed on subjects undergoing clinical testing at baseline from various clinical trials at the Pennington Biomedical Research Center (PBRC-cohort). The buffy coat cells from lean, overweight, obese, and morbidly obese subjects were frozen and archived. All analyses were performed under a protocol approved by the Pennington Biomedical Research Center Institutional Review Board, and informed consent was obtained in accordance with the Declaration of Helsinki. T2D was defined based on measurement of fasting serum glucose and insulin levels as described before.12-14
Mice and animal care
Male C57BL/6 mice were fed ad libitum high-fat diet consisting of 60% calories from fat (D12492i; Research Diets Inc) starting at 8 weeks of age, and control male mice were fed a standard chow diet consisting of 4.5% fat (5002; LabDiet; Purina). The Mc4r−/− mice have been described previously.41-44 The Mc4r−/− and Mc4r+/+ mice were provided with ad libitum chow diet. The animals were individually housed in specific pathogen-free barrier facility with a 12-hour-light/12-hour-dark cycle with free access to food and water. All animal use was in compliance with the Institute of Laboratory Animal Research Guide for the Care and Use of Laboratory Animals and approved by the Institutional Animal Use and Care Committee at Pennington Biomedical Research Center.
Isolation of organs and cell suspension
After animals were humanely killed, thymi and spleen were isolated and weighed. They were fixed with 20% sucrose solution and frozen for cryosectioning or RNA extraction and dispersed on nylon mesh for single-cell preparation. The dispersed cells were treated with ACK lysing buffer (Quality Biological Inc) and prepared as single-cell suspension purification of CD4 cells by using negative selection and magnetic bead–based methods. The Meyer hematoxylin and eosin (Dako) staining was performed on frozen thymic sections as described previously.33
FACS analysis
Thymic lobes were minced into small fragments and treated 3 times for 10 minutes at 37°C with an enzymatic mixture containing 0.125% collagenase D (Roche Diagnostics), 0.1% DNase type I (Roche Diagnostics) in RPMI 1640. The remaining thymic fragments were treated with 0.125% collagenase/Dispase (Roche Diagnostics), 0.1% DNase I in RPMI 1640. The collected cells were filtered through 100-μm mesh and spun at 1300 rpm for 5 minutes and used for cell counting and staining. Immunofluorescent staining was performed as previously reported.33 The ETPs were identified as described previously31,32 ; 5 × 10⁶ thymocytes were labeled for lineage-positive cells by using PE-conjugated anti-CD11b, Gr-1, CD45R, CD3, CD8, αβTCR, γδTCR, pan-NK, NK1.1, CD11c, CD19, Ter119, and CD127 antibodies but no CD4, followed by staining with CD25-APC and C-Kit–FITC. The apoptosis was determined with an Annexin V staining kit per the manufacturer's instructions. The multipotent progenitor (MPP) cells were stained as Lin-Sca1+Kit+ Flt3+ and common lymphoid progenitor (CLP) cells as Lin−Sca1+KitloCD127+. The Lin−Sca1−KithiCD127− myeloid progenitors were further stained with CD34 and CD16CD32 to resolve common myeloid progenitors (CMPs; CD34+CD16CD32lo), granulocyte-monocyte progenitors (GMPs; CD34+CD16CD32+), and megakaryocyte-erythrocyte progenitors (MEP; CD34−CD16CD32−). The splenocytes were stained with CD4-APC, CD8-PercP, CD62L-FITC, and CD44-PE to identify the naive (CD62L+CD44− and memory CD62L−CD44+) cells. All the FACS analyses were performed on a FACSCalibur (BD Biosciences) with up to 4 fluorescent channels, and all FACS data were analyzed by postcollection compensation with FlowJo (Tree Star Inc) software.
Real-time RT-PCR and signal joint-TREC analysis
The total RNA was prepared with RNAzol (IsoTex Diagnostics). The cDNA synthesis and real-time reverse transcription–polymerase chain reaction (RT-PCR; Bio-Rad) was performed as described previously.3,33 Real-time RT-PCR analyses were done in duplicate on the ABI PRISM 7900 Sequence Detector TaqMan system with the SYBR Green PCR kit as instructed by the manufacturer (Applied Biosystems). The list of real-time PCR primers is shown in supplemental Table 1 (available on the Blood website; see the Supplemental Materials link at the top of the online article). GAPDH or β-actin was used a housekeeping gene or internal standard for normalization. The cycle threshold (Ct) values of quantitative real-time PCR were calculated with a standard ΔΔCt = ΔCt (control) − ΔCt (test). A ΔCt value is calculated for each sample as the difference between the Ct values for the gene of interest and the housekeeping gene in each sample.
The CD4+ T-cell subsets were isolated from splenocytes by using mouse CD4 T cell–positive selection kit (Invitrogen). The sorted cells were lysed in 100 mg/L proteinase K (Sigma-Aldrich) for 1 hour at 56°C followed by 10 minutes at 95°C. The amount of TRECs in 5 × 10⁶ cells was determined by real-time quantitative PCR by using the ABI PRISM 7900 Sequence Detector TaqMan system (Applied Biosystems). The PCR performed with mδRec and ψJα specific primers and mδRec-ψJα fluorescent probe was as described previously.33,45 The standard curves for murine TRECs were generated by using δRec ψJα TREC PCR product cloned into a pCR-XL-TOPO plasmid, a generous gift from Dr Gregory D. Sempowski (Duke University Medical Center). The human TREC analysis was performed on frozen peripheral blood mononuclear cell (PBMC) samples derived from PBRC-cohort buffy coat samples in the clinical database repository. The human TREC plasmid was a generous gift from Dr Daniel Douek (National Cancer Institute, National Institutes of Health [NIH]).
Vβ TCR spectratyping analysis
The CD4 T cells were used to prepare total RNA, and cDNA was prepared as described previously.3,33 A FAM-labeled nested constant β-region primer was used in combination with 24 multiplexed forward murine Vβ-specific primers to measure the complementarity determining region 3 (CDR3) lengths as described previously.46,47 Each peak was analyzed and quantified with ABI PRISM GeneScan analysis software (Applied Biosystems), based on size and density. Data were used to calculate the area under the curve (AUC) for each Vβ family. Each peak, representing a distinct CDR3 of a certain length, was quantified with BioMed Immunotech software.
Statistical analyses
The results are expressed as the mean plus or minus SEM. The differences between means and the effects of treatments were determined by one-way ANOVA using the Tukey test (SigmaStat; Systat Software), which protects the significance (P < .05) of all pair combinations.
Results
DIO is associated with premature thymic involution
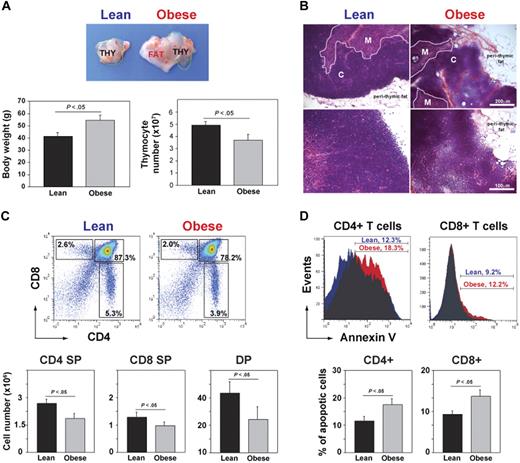
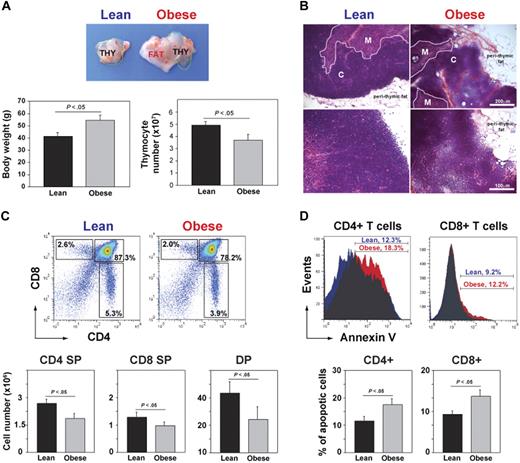
In mice, the involution of thymus and reduction in TRECs as a measure of RTEs is detectable within a year of age.45 To investigate whether obesity affects thymic involution, at 6 weeks of age, the control mice were placed on chow diet and DIO mice were given a high-fat diet (60% kcal fat). The control and DIO male mice fed ad libitum chow and high-fat diets were aged for 13 months. At 1 year of age, C57BL/6 mice fed the high-fat diet were significantly heavier that the chow-fed controls (Figure 1A). A gross examination of thymi from 13-month-old DIO mice showed a marked increase in perithymic adipose tissue, and the thymus appeared to morph into perithymic adipose tissue of the obese mice (Figure 1A-B). Compared with chow-fed control lean animals, the DIO animals had higher body weights, and the thymi had a significant reduction in total thymocyte counts (Figure 1A). Histologic examination of thymi from DIO mice showed reduced cortical and medullary cellularity and obliteration of cortico-medullary junctions (CMJs; Figure 1B). Analysis of thymocyte subsets showed that DIO mice had reduced frequency and numbers of single-positive (SP) CD4+ and CD8+ cells and of CD4+CD8+ double-positive cells (Figure 1C). In addition, compared with lean animals, obesity significantly increased the apoptosis of thymocyte subsets (Figure 1D). These findings suggest that obesity associated with consumption of a calorie-dense high-fat diet increases age-related thymic involution.
DIO induces thymic involution. (A) Compared with chow-fed control male mice, the thymus appeared “fatty” in age-matched 13-month-old DIO animals along with increased body weight and reduced total thymic cell numbers (n = 12 per group). (B) The hematoxylin and eosin–stained sections of 13-month-old control and DIO mice showed increased perithymic fat and obliteration of CMJ. (C) FACS analysis of CD4-FITC– and CD8-PE–stained thymocytes. The 13-month-old DIO mice had significant reduction in SP CD4 (bottom right quadrant) and CD8 (top left quadrant) and in double-positive cells (top right quadrant). (D) The annexin-V staining on CD4 SP and CD8 SP cells showed a statistically significant (P < .05) increase in the frequency of apoptosis. Data are expressed as mean ± SEM from 8 to 12 mice per group. Images were acquired using Zeiss Axioskope microscope (10× and 20× objectives) and Axiovision Rel 4.6 software.
DIO induces thymic involution. (A) Compared with chow-fed control male mice, the thymus appeared “fatty” in age-matched 13-month-old DIO animals along with increased body weight and reduced total thymic cell numbers (n = 12 per group). (B) The hematoxylin and eosin–stained sections of 13-month-old control and DIO mice showed increased perithymic fat and obliteration of CMJ. (C) FACS analysis of CD4-FITC– and CD8-PE–stained thymocytes. The 13-month-old DIO mice had significant reduction in SP CD4 (bottom right quadrant) and CD8 (top left quadrant) and in double-positive cells (top right quadrant). (D) The annexin-V staining on CD4 SP and CD8 SP cells showed a statistically significant (P < .05) increase in the frequency of apoptosis. Data are expressed as mean ± SEM from 8 to 12 mice per group. Images were acquired using Zeiss Axioskope microscope (10× and 20× objectives) and Axiovision Rel 4.6 software.
Progressive obesity inhibits thymopoiesis and restricts T-cell repertoire diversity
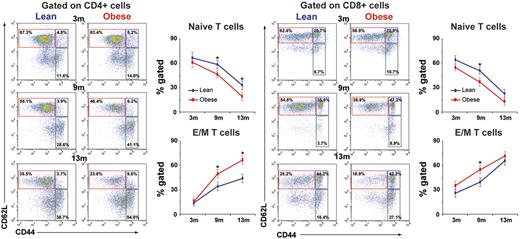
Reduction in the ability of thymus to produce naive T cells is reflected by a decrease in peripheral CD62L+CD44− naive cells.48 To determine whether DIO regulates thymic output, we next aged the mice fed a high-fat diet and control chow diet and analyzed the CD4 and CD8 naive and effector/memory (E/M) T cells in spleen at 3, 9, and 13 months of age. We found that at 3 month, DIO did not affect the naive and memory T-cell frequency (Figure 2). Interestingly, the age-related decline in naive CD4 and CD8 cells and homeostatic expansion of E/M cells were significantly accelerated with development and duration of DIO and adiposity (Figure 2).
Obesity decreases naive T cells and expands memory cells. Chow-fed control mice and mice fed a high-fat (60%) diet were evaluated for naive (CD62L+CD44−; red box) E/M (CD62L−CD44+) CD4 and CD8 T cells at 3 months (n = 10-12/group), 9 months (n = 8/group), and 13 months (n = 12/group) of age. Obesity significantly reduces naive cells (top left quadrant) and expands E/M splenic T cells (bottom right quadrant) in 9- and 13-month-old mice but not at 3 months of age.
Obesity decreases naive T cells and expands memory cells. Chow-fed control mice and mice fed a high-fat (60%) diet were evaluated for naive (CD62L+CD44−; red box) E/M (CD62L−CD44+) CD4 and CD8 T cells at 3 months (n = 10-12/group), 9 months (n = 8/group), and 13 months (n = 12/group) of age. Obesity significantly reduces naive cells (top left quadrant) and expands E/M splenic T cells (bottom right quadrant) in 9- and 13-month-old mice but not at 3 months of age.
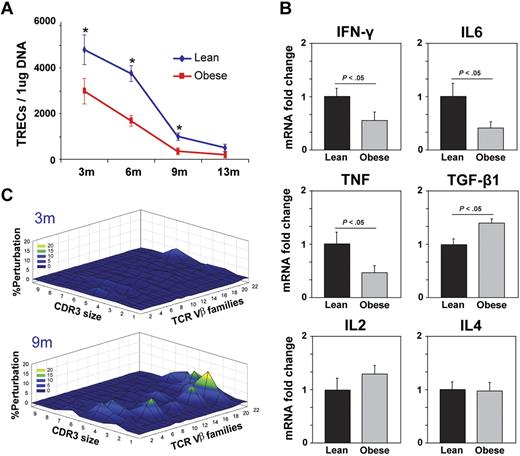
Because the presence of naive RTEs cannot yet be distinguished by specific surface markers, the quantitation of extrachromosomal DNA circles, termed TRECs, has been used to evaluate thymic output.33,45 Consistent with our findings that obesity accelerates age-related deterioration of thymic architecture and reduces thymocyte counts with increased thymocyte subset apoptosis, the TREC numbers in obese mice were significantly lower than in the age-matched chow-fed leaner controls (Figure 3A). Furthermore, compared with lean controls, the T cells isolated from 13-month-old DIO mice expressed significantly reduced expression of key cytokines, interferon γ (IFNγ), tumor necrosis factor α (TNFα), interleukin-6 (IL-6), and transforming growth factor-β1 (TGF-β1) without affecting IL-2 and IL-4 mRNA levels (Figure 3B). These data suggest that steady-state mRNA expression of proinflammatory cytokine expression in splenic T cells in obese mice is lower and is consistent with recent reports suggesting that on influenza infection the CD8 T cells have deficient IFNγ production and response.22,23
DIO reduces thymopoiesis and restricts TCR diversity. (A) The splenic CD4+ T cells were isolated to prepare the DNA, and signal-joint TREC levels were analyzed by using quantitative PCR analysis. A total of 6 to 10 mice per group were used for sjTREC assay, and the data are expressed as mean ± SEM. The obesity in mice significantly reduced TRECs at all ages examined. (B) Real-time PCR analysis of cytokine mRNA expression in purified CD4 cells from 13-month-old control and DIO mice (n = 6/group). (C) The TCR spectratyping analyses of CD4 T cells from 3- and 9-month-old mice on chow and high-fat diets are shown (n = 5). A polyclonal profile is Gaussian with 6 to 8 peaks, whereas alterations from Gaussian distributions are measure of oligoclonality. The Gaussian distribution profiles were translated into probability distributions as functions of the AUC for each CDR3 length. The average distribution of the CD4+ repertoire from 3- and 9-month-old ad libitum–fed chow diet controls is compared with the DIO mice. The statistical quantitation of the CDR3 size of all the TCR Vβ between control and DIO mice was performed by using CDR3QAssay software. The extent of the change in the CDR3 size distribution is defined as the percentage of improvement (distance from the mean value). (The percentage of improvement greater than 3 SDs in the fragment length of each family indicates that there are significant changes in the Vβ family, based on Gorochov et al.47 ) These improvements in TCR diversity are represented as landscape surfaces, in which smooth (blue) landscapes represent an unchanged TCR repertoire (diversity). The mountain (in green, yellow, and orange) depicts perturbation in amplified peaks of CDR3 lengths compared with control mice. Each line crossing on the y-axis of the landscape denotes perturbation for a specific CDR3 length or size (x-axis) of a particular Vβ family (z-axis).
DIO reduces thymopoiesis and restricts TCR diversity. (A) The splenic CD4+ T cells were isolated to prepare the DNA, and signal-joint TREC levels were analyzed by using quantitative PCR analysis. A total of 6 to 10 mice per group were used for sjTREC assay, and the data are expressed as mean ± SEM. The obesity in mice significantly reduced TRECs at all ages examined. (B) Real-time PCR analysis of cytokine mRNA expression in purified CD4 cells from 13-month-old control and DIO mice (n = 6/group). (C) The TCR spectratyping analyses of CD4 T cells from 3- and 9-month-old mice on chow and high-fat diets are shown (n = 5). A polyclonal profile is Gaussian with 6 to 8 peaks, whereas alterations from Gaussian distributions are measure of oligoclonality. The Gaussian distribution profiles were translated into probability distributions as functions of the AUC for each CDR3 length. The average distribution of the CD4+ repertoire from 3- and 9-month-old ad libitum–fed chow diet controls is compared with the DIO mice. The statistical quantitation of the CDR3 size of all the TCR Vβ between control and DIO mice was performed by using CDR3QAssay software. The extent of the change in the CDR3 size distribution is defined as the percentage of improvement (distance from the mean value). (The percentage of improvement greater than 3 SDs in the fragment length of each family indicates that there are significant changes in the Vβ family, based on Gorochov et al.47 ) These improvements in TCR diversity are represented as landscape surfaces, in which smooth (blue) landscapes represent an unchanged TCR repertoire (diversity). The mountain (in green, yellow, and orange) depicts perturbation in amplified peaks of CDR3 lengths compared with control mice. Each line crossing on the y-axis of the landscape denotes perturbation for a specific CDR3 length or size (x-axis) of a particular Vβ family (z-axis).
The reduction in naive T-cell output and expansion of memory T cells because of diminished thymopoiesis results in reduced TCR diversity and consequent functional deficits in adaptive immune responses.8,48,49 We therefore next studied the TCR diversity of peripheral CD4+ T cells by measuring the distribution of lengths of the CDR3, which, although a lower resolution approach, allows a global analysis of the TCRs of the sampled T-cell population.46,47 A polyclonal diverse TCR Vβ family is characterized by Gaussian distribution of peaks, whereas a skewed profile is distinguished by deviations from Gaussian distribution and aberrant amplification of peaks.46 The Gaussian distribution profiles were translated into probability distributions as functions of the AUC for each CDR3 length as described previously.47 By these methods, we demonstrate quantitatively that the progressive DIO restricted TCR diversity with little effect of high-fat diet–induced obesity in 3-month-old animals (Figure 3C).
DIO reduces lymphoid and increases myeloid progenitors
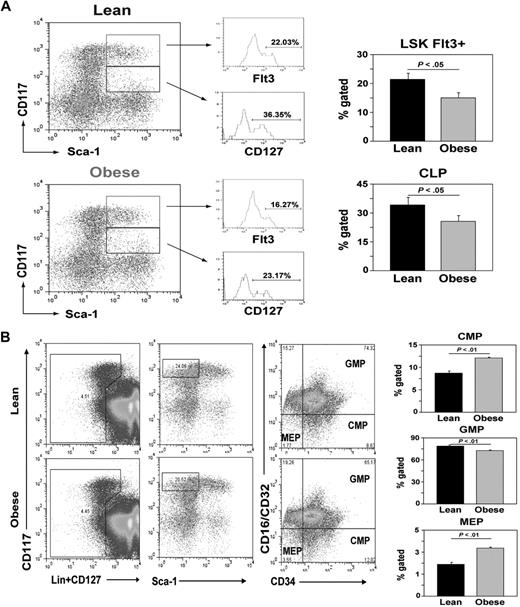
T-cell development in the thymus depends on periodic seeding of lymphoid progenitors from bone marrow.50 The multipotent self-renewing HSCs (Lin−Sca1+kit+Flt3− or Flt3−LSKs) in bone marrow differentiate into a nonrenewing population of lymphoid-primed MPPs (Flt3+LSKs).50 The MPPs further give rise to a more differentiated CLP (Lin−Sca1+KitloCD127+). Given that DIO increases thymic involution, we tested whether the obesity reduces the pool of MPP and CLP populations. We found that obesity did not alter the LSK number but, compared with 13-month-old lean controls, it significantly reduced the frequency of MPP and CLP populations (Figure 4A), suggesting that obesity decreases lymphoid progenitors in the BM.
Obesity reduces lymphoid pool and increases myeloid progenitors. (A) BM cells from femurs of control and DIO mice (13 months of age; n = 6/group) were stained for lineage markers, CD117, Sca1, and CD127. A representative dot plot show gating strategy (on Linlo cells) and Flt3 expression to define MPP (Flt3+LSK) and CLPs (Lin−Sca1+CD117loCD127+) with CD127 expression depicted as histogram. (B) Flow cytometry analyses of BM cells from 13-month-old control and DIO mice. Obesity increases the subsets of CMPs (Lin−CD127−CD117hiSca1 CD34+CD16CD32−) and MEPs (Lin−CD127−CD117hiSca1−CD34−CD16CD32−) and significantly reduced (P < .05) GMPs (Lin−CD127−CD117hiSca1−CD34+CD16CD32+).
Obesity reduces lymphoid pool and increases myeloid progenitors. (A) BM cells from femurs of control and DIO mice (13 months of age; n = 6/group) were stained for lineage markers, CD117, Sca1, and CD127. A representative dot plot show gating strategy (on Linlo cells) and Flt3 expression to define MPP (Flt3+LSK) and CLPs (Lin−Sca1+CD117loCD127+) with CD127 expression depicted as histogram. (B) Flow cytometry analyses of BM cells from 13-month-old control and DIO mice. Obesity increases the subsets of CMPs (Lin−CD127−CD117hiSca1 CD34+CD16CD32−) and MEPs (Lin−CD127−CD117hiSca1−CD34−CD16CD32−) and significantly reduced (P < .05) GMPs (Lin−CD127−CD117hiSca1−CD34+CD16CD32+).
Considering that LSKs can generate multiple hematopoietic lineages, we next sought to determine whether obesity-induced shrinkage of MPP and CLP pools also affected the nonlymphoid cell lineages. The myeloid progenitors are known to exist within the Lin−Sca1−KithiCD127− fraction of bone marrow cells.51 On the basis of the expression of CD34 and CD16CD32, the Lin−Sca1−KithiCD127− myeloid progenitors can be further resolved into CMPs (CD34+CD16CD32lo), GMPs (CD34+CD16CD32+), and MEPs (CD34−CD16CD32−). DIO significantly (P < .05) increases the frequency of CMP and MEP cells while reducing the GMP cells in BM (Figure 4B). These data suggest that obesity does not lead to a general defect in HSCs that nonspecifically reduces multiple hematopoietic lineages. Rather, obesity selectively compromises the lymphoid progenitor pool without decreasing the development of all hematopoietic lineages.
Adiposity induced by deficient MC4R signaling accelerates thymic involution
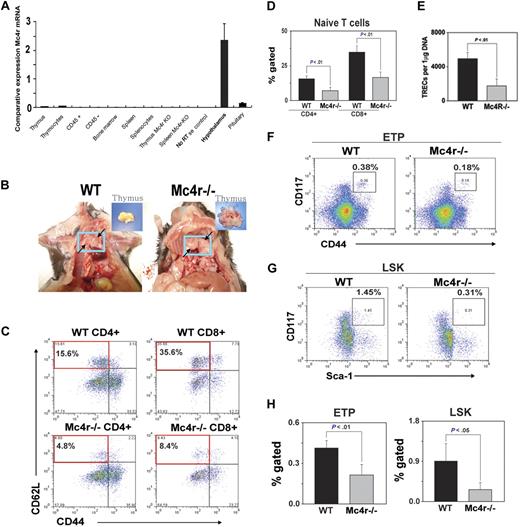
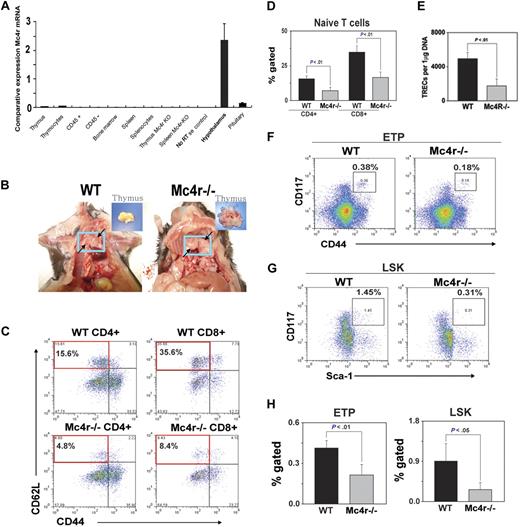
It is well known that deficient leptin signaling induces severe obesity and reduces thymic function.34,40 However, leptin also exerts direct effects on thymopoiesis by functional leptin-receptor expression on thymus and T cells.33,37-39 Thus, in the leptin-deficient genetic model of obesity, the hyperphagia and metabolic disturbance induced by the absence of leptin cannot be delineated from leptin's direct prothymic and immunomodulatory effects. Therefore, in an effort to understand the effect of obesity induced by hyperphagia (independent of a high-fat diet) through the ablation of primary anorexigenic neural signaling, we investigated the Mc4r-deficient mice maintained on an ad libitum chow diet. This genetic model of obesity offers an additional advantage because Mc4r mRNA expression is restricted to CNS and hypothalamus and is not expressed in thymic stromal cells, thymocytes, or mature T cells (Figure 5A). In addition, this model allowed us to determine whether adiposity independent of high-fat content of diet determines thymic function.
Deficient Mc4r signaling–driven obesity accelerates thymic involution. The WT and Mc4r knockout mice were maintained on an ad libitum chow diet and aged for 8 months. (A) The real-time PCR analysis of Mc4r mRNA in 2- to 3-month-old C57BL/6 mice (n = 3). The total RNA from cells and tissues was DNAse digested, and RT-PCR analysis shows the CNS-restricted expression of Mc4r. (B) Obesity mediated by Mc4r deficiency causes thymic adiposity. Thymus is highlighted in blue box and arrows, compared with control WT mice; inset shows malformed fatty thymus in Mc4r−/− animals. (C-D) Compared with WT mice, loss of Mc4r significantly (P < .05) reduces the frequency of CD4 and CD8 naive (CD62L+CD44−) T cells (top left quadrant) and (E) decreases sjTREC numbers in splenic CD4 cells. (F,H) Mc4r deficiency–driven obesity significantly reduces the ETP (LinloCD44+ckithi) cells in thymus and (G-H) LSK cells in BM (n = 5 per group; top right quadrant).
Deficient Mc4r signaling–driven obesity accelerates thymic involution. The WT and Mc4r knockout mice were maintained on an ad libitum chow diet and aged for 8 months. (A) The real-time PCR analysis of Mc4r mRNA in 2- to 3-month-old C57BL/6 mice (n = 3). The total RNA from cells and tissues was DNAse digested, and RT-PCR analysis shows the CNS-restricted expression of Mc4r. (B) Obesity mediated by Mc4r deficiency causes thymic adiposity. Thymus is highlighted in blue box and arrows, compared with control WT mice; inset shows malformed fatty thymus in Mc4r−/− animals. (C-D) Compared with WT mice, loss of Mc4r significantly (P < .05) reduces the frequency of CD4 and CD8 naive (CD62L+CD44−) T cells (top left quadrant) and (E) decreases sjTREC numbers in splenic CD4 cells. (F,H) Mc4r deficiency–driven obesity significantly reduces the ETP (LinloCD44+ckithi) cells in thymus and (G-H) LSK cells in BM (n = 5 per group; top right quadrant).
Mc4r mice (backcrossed to more than 12 generations on a C57BL/6 background) and control wild-type animals were maintained on chow diet and aged for 8 months. Mc4r−/− mice on ad libitum chow diet became progressively obese and weighed almost twice that of Mc4r+/+ animals at 8 months of age (supplemental Figure 1). Strikingly, the thymi of obese Mc4r−/− animals were grossly malformed and “fatty” along with adipose tissue deposition in the mediastinal region (Figure 5B). The histologic analyses of thymi showed disruption of CMJs (supplemental Figure 2).
We next investigated the effect of Mc4r-driven obesity on thymopoiesis, splenic T-cell subsets, and TCR repertoire diversity. We found a marked reduction in naive CD4+ and CD8+ cells in the spleen of Mc4r−/− mice (Figure 5C-D). In addition, Mc4r ablation resulted in the selective expansion of CD8 E/M population with no change in CD4 E/M cells (supplemental Figure 2). Consistent with reduced number of naive T cells, the analysis of TRECs in peripheral CD4 cells showed a significant reduction in thymic output in Mc4r-deficient animals (Figure 5E). Interestingly, the analysis of ETPs (Lin−CD117+CD44+; Figure 5F) and LSK cells in BM (Figure 5G) showed that obesity induced by Mc4r deficiency resulted in a significant decrease in lymphoid progenitors (Figure 5H).
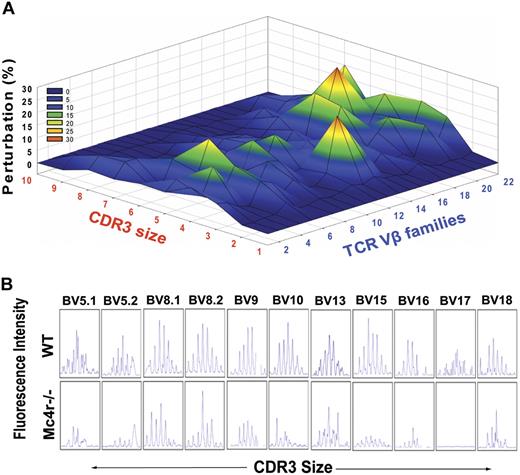
We also determined the TCR repertoire by measuring the length of CDR3 hypervariable region with the use of TCR spectratyping analysis. The PCR amplification of each Vβ allele by specific primer located in the Cβ region and to every Vβ segment allows detection of CDR3 length of each Vβ–Jβ combination.47 We found marked perturbation in the TCR repertoire of Mc4r−/− mice (Figure 6A). The significant disturbances were shown in Vβ 15 and Vβ 18-21. Compared with lean WT mice that exhibited polycloncal repertoire, represented as Gaussian distribution of 6 to 8 peaks of each Vβ family member, the obese Mc4r−/− animals exhibited more oligoclonal repertoire as evidenced by the reduction in number and distribution of CDR3 lengths (Figure 6B). Consistent with our hypothesis, these findings show that hyperphagia and obesity driven by ablation of Mc4r recapitulates the reduced thymopoiesis and restriction of T-cell diversity observed in DIO mice.
Mc4r-mediated adiposity induces premature restriction of TCR diversity. (A) The TCR spectratyping analysis of CD4 T cells from control and Mc4r-null mice is shown. The x-axis shows CDR3 lengths, and each line crossing on the y-axis of the landscape denotes perturbation for a specific CDR3 size (x-axis), whereas individual Vβ are shown on the z-axis. The mountain (in green, yellow, and orange) depicts perturbation in amplified peaks of CDR3 lengths of MC4R−/− animals in comparison to WT mice (n = 5). (B) Representative Vβ results of CDR3 size spectratyping in WT and Mc4r-null mice.
Mc4r-mediated adiposity induces premature restriction of TCR diversity. (A) The TCR spectratyping analysis of CD4 T cells from control and Mc4r-null mice is shown. The x-axis shows CDR3 lengths, and each line crossing on the y-axis of the landscape denotes perturbation for a specific CDR3 size (x-axis), whereas individual Vβ are shown on the z-axis. The mountain (in green, yellow, and orange) depicts perturbation in amplified peaks of CDR3 lengths of MC4R−/− animals in comparison to WT mice (n = 5). (B) Representative Vβ results of CDR3 size spectratyping in WT and Mc4r-null mice.
Obesity reduces thymic output in middle-aged humans
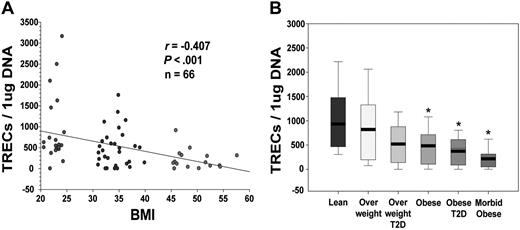
To understand the clinical implication of primary findings generated from mouse models, we next investigated the effect of adiposity on RTEs in middle-aged (30- to 45-year-old) humans. Quantitation of TRECs in PBMCs showed a strong negative correlation between the body mass index (BMI; in kg/m2) and thymic output (Figure 7A). Because obesity is typically associated with insulin resistance, it prompted us to study whether thymic involution observed in obese subjects is simply because of the disturbance in glucose homeostasis or because of the underlying T2D. We therefore compared thymic output in lean healthy subjects (BMI, 20-24.9) with overweight (BMI, 25-30), overweight with T2D, obese (BMI, 31-40) with no T2D, and obese with T2D as well as severely obese (BMI > 45) subjects. The frozen PBMCs from a total of 40 male and female subjects in each group with an age range of 30 to 40 years were used for the TREC analyses. Interestingly, we found that healthy overweight or overweight subjects with T2D had similar thymic output as did lean subjects (Figure 7B). However, compared with lean subjects, obese subjects with or without T2D had significant reduction in TREC numbers, which were further diminished in severely obese subjects (Figure 7B). These sets of data establish that progressive adiposity independent of T2D compromises thymopoiesis and that the development of insulin-resistance in subjects with BMI greater than 31 results in further reduction of recently generated thymic naive T cells.
Obesity in humans reduces thymopoiesis. (A) Obesity in humans reduces thymopoiesis, quantitative PCR analysis of human sjTRECs in PBMCs shows significant correlation between reduction in TRECs with increasing BMI (30-40 years old). (B) The frozen PBMCs from additional (male and female; n = 30-35; age, 30-45 years) lean subjects were analyzed for TRECs and compared with overweight and obese subjects with and without T2D. All morbid obese (BMI > 45) subjects were insulin resistant.
Obesity in humans reduces thymopoiesis. (A) Obesity in humans reduces thymopoiesis, quantitative PCR analysis of human sjTRECs in PBMCs shows significant correlation between reduction in TRECs with increasing BMI (30-40 years old). (B) The frozen PBMCs from additional (male and female; n = 30-35; age, 30-45 years) lean subjects were analyzed for TRECs and compared with overweight and obese subjects with and without T2D. All morbid obese (BMI > 45) subjects were insulin resistant.
Discussion
On the basis of data from the National Health and Nutrition Examination Survey study, it is predicted that by year 2012, the prevalence of obesity is expected to reach 55% in black women, 36% in white women, 35% in white men, and 33% in black men.52,53 The latest data show that by year 2010, there will 9.3 million more obese adults in the United States than in the past decade, and 8.3 million of this newly emerging obese population will be constituted by adults that would be older than 50 years.53 How “gerobesity” or prevalence of obesity in the elderly will interact with ongoing corrosion of age-related immunity and mechanisms regulating immunosenescence remains to be determined. Currently, stress is thought to be one of the players in accelerating immunosenescence.54 In this study, we demonstrate that obesity compromises immune-surveillance pathways with accelerated age-related thymic involution, reduced naive T-cell production, and restriction of TCR repertoire diversity.
Obesity is known to increase the risk of infections and certain cancers.13,14 This epidemiologic evidence gave rise to the hypothesis that chronic caloric excess may be responsible for an underlying immunodeficient state with defects in mechanisms regulating the T-cell generation in thymus.4 We found that DIO selectively compromises the lymphoid progenitor pool while increasing the myeloid progenitors. Obesity induced by ad libitum intake of high-fat diet in C57BL/6 male mice reduced thymopoiesis and restricted the TCR repertoire diversity. Furthermore, ablation of Mc4r-mediated anorexigenic signaling and resultant obesity caused by excess caloric intake because of hyperphagia of chow diet recapitulates the defects in thymic function caused by high-fat diet–induced obesity. Importantly, in humans, obesity reduced the thymopoiesis independent of frank T2D. We demonstrate that obesity-induced acceleration of thymic aging is related with defects at multiple levels which include increased apoptosis of developing thymocytes, decrease in T-cell precursor pool, and reduction in RTEs.
The ability to generate effective T-cell response to newly emerging pathogens depends on a broad T-cell repertoire8 of newly generated thymic emigrants. The restriction of TCR repertoire is typically seen in the elderly because of the inability of thymus to replenish the naive T-cell pool.9 Consequently, the risk of infections, cancer, and vaccination failures increases on aging.10,11 According to current estimates, approximately 3 × 10⁹ T cells have to be generated every day to replenish the total pool of existing 3 × 10¹¹ T cells in the human body.49 Because by 40 years of age, approximately 80% of thymic space is dysfunctional and composed of adipose tissue,55 maintenance of TCR repertoire and peripheral naive T-cell pool is largely thymic independent.49 The memory T cells have a greater homeostatic proliferation rate than naive cells, and, because of ongoing antigen exposures, the integrity of the naive T-cell niche is progressively eroded, which leads to restricted TCR repertoire and reduced immune surveillance.8,48,49 Recent studies in DIO mice, a relevant disease model to mimic human DIO, provide evidence that DIO animals are prone to mortality on influenza infection and exhibit defective immune response.16,19-23 Furthermore, obese persons have an increased risk of mortality and morbidity as a result of severe infections and are also prone to nosocomial infections.14,15 Therefore, restriction of TCR repertoire diversity as a result of obesity-induced thymic aging provides a mechanistic link to greater risk of infections and lower immune surveillance in obese persons. Consistent with possible defects in the T-cell compartment, it has been suggested that obese persons are lymphopenic, and their T cells exhibit reduced proliferation in response to mitogens which can be corrected by weight loss.56
Age-related thymic involution is known to be associated with significant decrease in TECs, increase in adipogenic fibroblasts, and deterioration of thymic stromal microenvironment.3,9,26,55 Our recent studies suggest that caloric restriction, antithesis of DIO, prevents age-related loss of TECs and increases in fibroblasts with reduction in epithelial-mesenchymal transition (type 2) regulators in the thymus.3,57 Therefore, further studies are necessary to determine whether obesity alters TECs or stromal cell microenvironment that regulates T-cell development and thymopoiesis. How DIO accelerates the thymic involution process is incompletely understood, and, considering the broad effects of obesity, it is probable that mechanisms involved are complex and multifactorial. Increased caloric intake because of hyperphagia is known to lead to obesity. Accordingly, deficient anorexigenic neural drive seen in leptin (ob/ob) and leptin-receptor mutant (db/db) mice as well as loss of Mc4r signaling are known to cause obesity.40 We have previously reported that leptin receptors are expressed on T cells and that leptin can directly promote thymic function in aging mice.33,37,38 Thus, the absence of leptin signaling may induce thymic involution independently of adiposity and hyperphagia. Interestingly, the ablation of Mc4r also increases food intake with rapid onset of obesity.42-44 However, unlike leptin receptors, Mc4r gene is not expressed in BM, thymus, thymic stromal cells, or T cells, and its expression is restricted to the CNS. Therefore, the observed effects on thymic function in obese Mc4r-null mice are probably mediated by the loss of the CNS anorexigenic drive and resultant adiposity. Consistent with our hypothesis, the data suggest that similar to DIO mice the reduction of thymopoiesis in obese Mc4r animals is linked with the diminished lymphoid progenitor pool. Furthermore, loss of Mc4r signaling mediated adiposity, and acceleration of thymic involution led to perturbation and premature restriction of the TCR repertoire diversity by middle age in mice. The Mc4r+/− mice did not display any thymic defects (data not shown), suggesting that homozygous and complete loss-of-function mutation and development of obesity is required for thymic involution. Given that the loss-of-function mutation in Mc4r is the most prevalent monogenic cause of human obesity,40 our findings from Mc4r-null mouse models may warrant a careful evaluation in humans to determine whether homozygosity of the Mc4r mutation accelerates thymic aging and immunosenescence.
Our findings describe a previously unrecognized relation between obesity, thymic aging, and immunosenescence with implications for mechanisms governing the health span. Consistent with our data from animal models, thymopoiesis in humans is inversely related to BMI. Therefore, reduced thymic function in middle-aged obese persons with and without T2D can potentially be an important mechanism of reduced immune surveillance. According to current predictions, by year 2030 approximately 1 in 8 people will be older than 65 years.9 Evidence suggests that within the next 5 years, 1 in 4 people older than 50 years in the United States will be obese.53 It is well known that age-dependent reactivation of herpes zoster infections, increased rates of morbidity and mortality from influenza and other infections, along with partial protection by vaccines significantly limit the health span.8,9 With the changing demographics of the aging US population and increasing obesity rates in the elderly, the reduced immune competence in this group is an emerging health concern. Presently, most of ongoing research efforts to ameliorate immunosenescence are directed toward rejuvenating the naive T-cell production from the thymus without significant consideration to adiposity and with the assumption that the elderly population will either be of normal BMI or frail with advanced aging. Our data suggest that obesity-induced accelerated thymic involution and restriction of T-cell repertoire diversity represents a potent modifier of immunosenescence mechanisms that may further increase the risk and severity of infections in the “gerobese” population with potentially greater predisposition to emerging diseases such as H1N1 influenza, West Nile virus, or severe acute respiratory syndrome. Understanding the basic mechanism of adipose–immune interactions of obesity and immunosenescence may lead to the development of approaches for successful immunologic aging and increased health span. Our data establish that obesity accelerates the aging of the T-cell compartment by inducing defects in thymic function.
The online version of this article contains a data supplement.
The publication costs of this article were defrayed in part by page charge payment. Therefore, and solely to indicate this fact, this article is hereby marked “advertisement” in accordance with 18 USC section 1734.
Acknowledgments
We thank Dr Eric Ravussin for helpful discussions and Drs Donna Ryan, Claude Bouchard, and Peter Katzmarzyk for providing us access to the PBRC-cohort clinical database repository for analyses.
This work was supported in part by Coypu and Pennington Foundation grants (V.D.D.). The present work used the facilities of the Genomics and Cell Biology & Cell Imaging Core facilities supported by National Institutes of Health (NIH) grant 1 P20 RR02/1945 and Cell Biology and Bioimaging Core Facility of the Pennington Center of Biomedical Research Excellence and Clinical Nutrition Research Unit (NIH P30 DK072476).
National Institutes of Health
Authorship
Contribution: H.Y. and Y.-H.Y. conducted the experiments, analyzed the data, and participated in study design and manuscript preparation; B.V. and K.G.K. conducted the experiments and analyzed the data; J.R. participated in study design and data analysis; A.A.B. contributed the knockout mouse model and participated in study design and data analysis; and V.D.D. planned the study, conducted experiments, and wrote the paper.
Conflict-of-interest disclosure: The authors declare no competing financial interests.
Correspondence: Vishwa Deep Dixit, Laboratory of Neuroendocrine-Immunology, Pennington Biomedical Research Center, 6400 Perkins Rd, Baton Rouge, LA 70808; e-mail: Vishwa.Dixit@pbrc.edu.

