Abstract
Abstract 2004
Poster Board I-1026
Non-invasive estimation of tissue iron concentration is being used increasingly to follow responses to chelation therapy. Magnetic resonance (MR) T2* was originally developed to estimate myocardial iron but the first description of the myocardial T2* method also demonstrated a clear relationship between liver T2* and liver iron concentration (LIC) measured by biopsy (Anderson, Eur Heart J 2001). The inclusion of liver analysis at this time was intended mainly to show the relationship of T2* to tissue iron rather than as a standard method for LIC measurement, particularly as the echo times used were too long to measure the high iron levels commonly found in the liver. Since this work, other MR methods such as the R2 technique (St. Pierre, Blood 2004) have been specifically validated to measure LIC. However, if T2* could be validated and calibrated appropriately for LIC, it may be convenient to measure liver and heart iron at the same time using this rapid technique. Since the initial calibration of the T2* method, there have been major improvements in scanner technology and hardware. In the original paper, eight different echo times were acquired (TE 2.2- 20.1ms), each of which required a separate breath-hold with important implications for image registration regarding the measurement of T2*. Much shorter, more closely spaced echo times are now possible in a single breath-hold which makes the calculation of T2* more accurate, especially at higher liver iron concentrations where T2* is short.
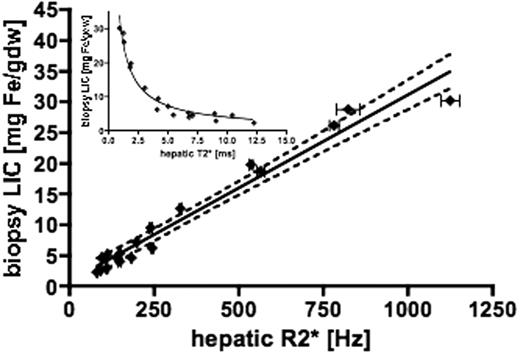
A large cohort of patients at UCLH have had liver biopsies as part of iron chelation studies on Deferasirox, while continuing to be monitored by T2* of both heart and liver. Data pairs for LIC calibration curve plots were chosen as nested values by shortest biopsy-to-MR time lapse criterion (±75 days) from all biopsy and hepatic T2* results. Liver biopsy iron was measured in a single central laboratory in Rennes, France (Clinique des Maladies du Foie [Clinic for Hepatic Illnesses], Center Hospitalier Universitaire) on paraffin embedded sections as previously described (Soriano-Cubells MJ, Atomic Spectrosc. 1984). All MR scans were performed on a 1.5T Sonata MR scanner (Siemens, Germany) using a 4-channel anterior phased array coil at Royal Brompton Hospital, London. A transverse slice through the centre of the liver was imaged using a multi-echo single breath-hold gradient echo T2* sequence with a range of echo times (TE 0.93-16.0ms). T2* decay was measured using Thalassaemia tools (Cardiovascular Imaging Solutions, London, UK) from a region of interest (ROI) in an area of homogeneous liver tissue, avoiding blood vessels and other sources of artefact. To account for background noise, a truncation method was used for curve-fitting (He, Magn Reson Med 2008). All T2* measurements were performed in triplicate by 2 independent observers choosing three separate ROIs to analyse. The ROIs were chosen to be as large as possible in three separate areas of the liver (anterior, mid/lateral and posterior). Spearman correlation method was used to estimate the degree of relationship between biopsy LIC and hepatic R2* (1/T2*) values, both of which showed positive skew.
61 patients had both liver biopsy and liver MR measurements undertaken. However, only 18 had biopsies within 75 days of MR T2* measurement and these are the patients included in the following analysis. There is a linear relationship between biopsy LIC and the reciprocal of T2* (R2*), given by: LIC = 0.03 x R2* + 0.74 (R2=0.96 p<0.0001, slope 95% CI 0.027-0.033, with y intercept CI -0.73 to 2.2). The 95% confidence intervals for the linear regression line were calculated from the SEM and are shown as the broken lines (Figure 1). Staging of fibrosis/cirrhosis provided in biopsy reports was not found to significantly affect regression analysis contrary to previous studies. The inset shows the relationship between T2* and biopsy LIC. The new calibration shows acceptable linearity and reproducibility over an LIC range up to 30mg/g dry weight and gives LIC values approximately 1.94 times higher than the original method reported by Anderson. Comparison of these values with those obtained by SQUID and Ferriscan would also be of interest.
Pennell:Cardiovascular Imaging SOlutions, London, UK: Director.
Author notes
Asterisk with author names denotes non-ASH members.


