Abstract
Abstract 893
Approximately 20% of pediatric immune thrombocytopenia (ITP) patients develop chronic disease (thrombocytopenic at 6 months) and may require prolonged immunosuppression or splenectomy. Previously, with microarray analysis and quantitative real-time PCR validation, we identified increased Vanin-1 (VNN1) and decreased Peroxisome proliferator-activated receptor gamma (PPARG) expression to be correlated with developing chronic ITP in children. VNN1 is an oxidative stress sensor and licenses proinflammatory signals in epithelial cells through inhibition of PPARG, the negative regulator of NF-κB activation; however, the expression pattern of VNN1 in peripheral blood cells has not been reported. We hypothesized that VNN1 also serves as an oxidative stress sensor in certain types of human blood cells and functions through indirect inhibition of PPARG to promote proinflammatory cytokines production, which may play a role in the development of chronic ITP.
1) Evaluate the relation between VNN1 and PPARG expression and outcome in an expanded cohort of ITP patients (n =16); 2) Define expression of VNN1 in human peripheral blood cells; 3) Define response of VNN1 and PPARG to oxidative stress inducers in human peripheral blood mononuclear cells (PBMC).
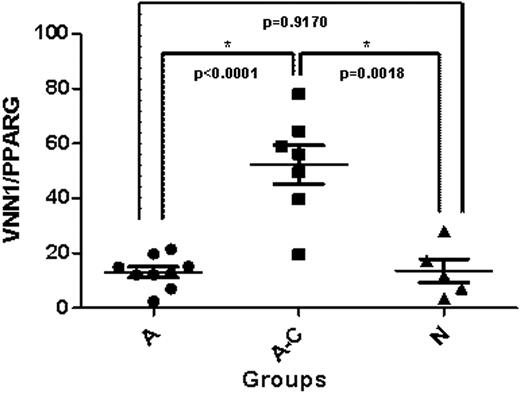
1) The VNN1/PPARG ratio showed a stronger correlation with disease outcome than either gene alone (Self-limited ITP group vs. Progression to chronic group: VNN1 alone p=0.007, PPARG alone p=0.027; VNN1/PPARG p<0.0001, Figure 1). 2) Peripheral blood cell subsets from healthy adults (CD3+CD4+ T cells, CD3+CD8+ T cells, CD20+ B cells, CD14+ monocytes, CD15+ granulocytes, platelets) were sorted by Fluorescence-activated cell sorting (FACS) or Magnetic-activated cell sorting (MACS), then VNN1 expression in each subset was determined by real-time PCR. We observed moderate to high expression level of VNN1 in granulocytes, monocytes, CD8+ T cells and platelets, and low level in CD4+ T cells and B cells. Based on this, PBMCs from 5 normal adults were isolated and treated with oxidative stress inducers LPS (10ng/ml) and Sodium Arsenite (5μM). Treated and untreated control cells were harvested 12h after treatment. RNA was extracted and reverse transcribed to cDNA, which was used for real-time PCR to measure VNN1 and PPARG transcripts level. After normalization to internal control gene GAPDH, VNN1/PPARG ratio was calculated for each sample. Table 1 shows the fold changes of VNN1, PPARG and VNN1/PPARG ratio in treated cells compared to control cells. VNN1 expression increased 5∼40 fold after LPS treatment and 2∼40 fold after Arsenite treatment; PPARG expression decreased 25∼76 fold after LPS treatment and 4∼7 fold after Arsenite treatment; VNN1/ PPARG expression ratio increased 267∼3360 fold after LPS treatment and 7∼351 fold after Arsenite treatment.
1) Increased VNN1/PPARG expression ratio during acute ITP phase significantly correlates with prolonged disease course in pediatric ITP patients; 2) In peripheral blood, VNN1 is expressed mainly on monocytes, granulocytes, CD8+ T cells and platelets; 3) In PBMCs, VNN1 and PPARG exhibit dramatic reciprocal changes in expression following exposure to well-defined oxidative stress inducers; 4) Oxidative stress challenges (e.g, infection, inflammation) and patient response could be a variable for susceptibility to chronic ITP.
A: Self-limited ITP group (Patients resolved within 6 months of diagnosis) A-C: Progression to chronic ITP group (Patients did not resolve by 6 months of diagnosis) N: Normal pediatric control group
A: Self-limited ITP group (Patients resolved within 6 months of diagnosis) A-C: Progression to chronic ITP group (Patients did not resolve by 6 months of diagnosis) N: Normal pediatric control group
| PBMC sample # . | Fold change in LPS treated cells compared to non-treated cells . | Fold change in Sodium Arsenite treated cells compared to non-treated cells . | ||||
|---|---|---|---|---|---|---|
| VNN1 . | PPARG . | VNN1/PPARG ratio . | VNN1 . | PPARG . | VNN1/PPARG ratio . | |
| 1 | 27 | -31 | 816 | 4 | -5 | 351 |
| 2 | 40 | -25 | 987 | 40 | -4 | 167 |
| 3 | 35 | -76 | 3360 | 15 | -7 | 131 |
| 4 | 21 | -28 | 587 | 15 | -7 | 116 |
| 5 | 5 | -72 | 267 | 2 | -5 | 7 |
No relevant conflicts of interest to declare.
Author notes
Asterisk with author names denotes non-ASH members.


