Abstract
To date, little evidence of miRNA expression/deregulation in multiple myeloma has been reported. To characterize miRNA in the context of the major multiple myeloma molecular types, we generated miRNA expression profiles of highly purified malignant plasma cells from 40 primary tumors. Furthermore, transcriptional profiles, available for all patients, were used to investigate the occurrence of miRNA/predicted target mRNA pair anticorrelations, and the miRNA and genome-wide DNA data were integrated in a subset of patients to evaluate the influence of allelic imbalances on miRNA expression. Differential miRNA expression patterns were identified, which were mainly associated with the major IGH translocations; particularly, t(4;14) patients showed specific overexpression of let-7e, miR-125a-5p, and miR-99b belonging to a cluster at 19q13.33. The occurrence of other lesions (ie, 1q gain, 13q and 17p deletions, and hyperdiploidy) was slightly characterized by specific miRNA signatures. Furthermore, the occurrence of several allelic imbalances or loss of heterozygosity was found significantly associated with the altered expression of miRNAs located in the involved regions, such as let-7b at 22q13.31 or miR-140-3p at 16q22. Finally, the integrative analysis based on computational target prediction and miRNA/mRNA profiling defined a network of putative functional miRNA-target regulatory relations supported by expression data.
Introduction
Multiple myeloma (MM) is a malignant proliferation of bone marrow (BM) plasma cells (PCs), characterized by a profound genomic instability involving both numerical and structural chromosomal aberrations of potential prognostic relevance.1 Nearly half of MM tumors are hyperdiploid (HD) with multiple trisomies of nonrandom odd-numbered chromosomes and a low prevalence of chromosomal translocations involving the immunoglobulin heavy chain (IGH) locus at 14q32 and chromosome 13 deletion1 ; the others are nonhyperdiploid (NHD) tumors often showing chromosome 13 deletion, 1q gain, and IGH translocations,2 with the most frequent partners being 11q13, 4p16, 16q23, 20q11, and 6p21. The deregulation of at least one of the cyclin D genes is observed in almost all MM cases and, in combination with recurrent IGH translocations, has been proposed for a molecular classification of MM called translocation/cyclin (TC) classification.3,4 The occurrence of specific transcriptional patterns associated with the molecular subgroups and major genetic lesions of MM has been extensively described in several studies by us and others.2-10
miRNAs are endogenous approximately 22 nt RNAs that play important regulatory roles in animals and plants by targeting mRNAs for cleavage or translational repression.11 It has been suggested that chromosomal abnormalities and other types of genetic or epigenetic alterations might contribute to miRNA deregulation in cancer.12,13
There are still few published data concerning miRNA expression in MM. Loffler et al have shown that interleukin-6 (IL-6) regulates miR-21 transcription in IL-6–dependent human myeloma cell lines (HMCLs) through a STAT-3–related mechanism, and that ectopic miR-21 expression can sustain their growth in the absence of IL-6.14 Pichiorri et al have reported a set of miRNAs that can be associated with neoplastic transformation and progression in MM.15 Our group has identified a set of deregulated miRNAs in HMCLs that correlate with copy number (CN) alterations or gene expression patterns.16,17 More recently, Roccaro et al reported the down-regulation of miR-15a and miR-16 in a small cohort of relapsed-refractory MM patients, showing that they may regulate the proliferation and growth of MM cells in vitro and in vivo.18
We here describe the miRNA expression profiling of MMs in the context of the major recurrent molecular alterations of the disease. Furthermore, in an attempt to define the consequences of differential miRNA expression, we searched for functional targeting relationships by the definition of a global miRNA/mRNA regulatory network.
Methods
Patient samples
BM aspirates were obtained during standard diagnostic procedures from 54 untreated patients (48 MMs and 6 plasma cell leukemias [PCLs]), most of whom have been included in our previous reports.5,17 All patients had given their informed consent in accordance with the Declaration of Helsinki, and all studies were approved by the Institutional Review Board of the Fondazione IRCCS Policlinico of Milan. Normal control samples (NCs) were obtained from 3 healthy donors. Patients had been diagnosed on the basis of previously described criteria.5 PCs were purified from BM biopsies using CD138 immunomagnetic microbeads (MidiMACS; Miltenyi Biotec).19 The purity of the positively selected PCs (≥ 90%) was assessed by flow cytometry. Patients have been stratified according to the previously described TC classification.3,4 Briefly, the TC1 group included patients characterized by the t(11;14) or t(6;14) translocation; TC2, those showing low to moderate levels of the CCND1 gene in the absence of any primary IGH translocation; TC3, tumors that do not fall into any of the other groups; TC4, cases that show t(4;14) translocation; and TC5, either the t(14;16) or t(14;20) translocations.
miRNA expression profiling
Thirty-eight MM, 2 PCL, and 3 NC samples were investigated for miRNA expression by microarray analysis. The patient samples were selected to be representative of the 5 TC groups, and the PCL samples with translocated MAF genes were included because of the relatively small number of TC5 MM patients. Fluorescence in situ hybridization information regarding the major numerical chromosomal alterations was already available (supplemental Table 1, available on the Blood website; see the Supplemental Materials link at the top of the online article). The total RNA extraction and quality assessment were performed as previously described.16 The samples were profiled on the Agilent Human miRNA Microarray V2 (Agilent Technologies), consisting of 60-mer DNA probes synthesized in situ that represent 723 human and 76 human viral miRNAs from the Sanger database (Version 10.1), using the one-color technique in accordance with the manufacturer's instructions.16 The human miRNAs data were reannotated on Sanger Release 12.0 and normalized using the Aroma Light package for Bioconductor. To overcome scaling biases resulting from background subtraction, the data were converted to obtain positive values throughout the dataset, at a minimum value of 1. The raw and normalized microRNA data are available through GEO accession number GSE17498. Hierarchical agglomerative clustering of the selected probe lists was performed using Pearson correlation coefficient and average linkage as distance and linkage metrics, respectively.19 Supervised analyses were carried out using Significant Analysis of Microarrays software, Version 3.02 as previously described.5 The significance threshold (at a q value = 0) was determined tuning the Δ parameter on the false discovery rate and controlling the q value of the selected probes. The cross-validation of the identified signatures was performed using the default options of lda package for Linear Discriminant Analysis in R software, choosing Leave-One-Out Cross-Validation method and applying a 1000-permutation model on a bootstrapped resampled dataset.
Quantitative RT-PCR
Selected mature miRNAs underwent quantitative reverse-transcribed polymerase chain reaction (RT-PCR) using TaqMan microRNA assays (Applied Biosystems) as previously described.16
Gene expression profiling
The transcriptional profiles of the patients have been generated using Affymetrix GeneChip HG-U133A arrays as previously described5,20 and are available through GEO accession number GSE13591. The raw intensity signals were extracted from CEL files and normalized using the RMA “function of affy” package for Bioconductor and custom GeneAnnot-based Chip Annotation Files, Version 2.0.1 (CDF)21 (available at http://www.xlab.unimo.it/GA_CDF), thus leading to the definition of 12 195 unique well-characterized genes.
Genome-wide profiling
Nineteen of the 40 MM/PCL samples profiled for miRNA expression underwent genome-wide DNA analysis using Affymetrix GeneChip Human Mapping 50K XbaI microarrays, and the CN values were generated as recently described.20 Briefly, raw CN values for individual SNPs and the probability of loss of heterozygosity (LOH) were extracted from CEL files and converted into signal intensities using Affymetrix GTYPE 4.1 and CNAT 4.0.1 software; robust estimate of genotype calling was performed using BRLMM distance classifier. Piecewise constant estimates of the underlying local DNA CN variation were calculated using the DNAcopy Bioconductor package, which looks for optimal breakpoints using circular binary segmentation, and the estimated profiles were normalized using the self-developed FBN package for R software. LOH was defined applying a 100-kb smoothing window (ie, 2-fold the mean intermarker distance on the arrays) on the CNAT-derived value with a probability higher than 0.95 for the detection of a monoallelic polymorphism.20 The CEL files are available through GEO accession number GSE16121.
miRNA target prediction
miRNA targets have been predicted applying miRanda algorithm22 on human miRNA and transcript sequences of miRBase Release 12.023 and ENSEMBL Release 52, respectively. The score threshold of miRanda, associated with each predicted miRNA-transcript targeting relationship and depending on the sequence alignment and thermodynamic stability of the RNA duplex, has been set at 160. Finally, the correspondence between ENSEMBL_transcript and EntrezGene_ID was defined.
Integrative analysis of miRNA and gene expression profiles to reconstruct a miRNA/gene regulatory network
The posttranscriptional regulatory network of miRNA and genes in MM has been defined as a directed, bipartite graph in which miRNA-mRNA relationships are supported by both targeting predictions and expression data. Specifically, the network has been reconstructed using the subset of miRNAs and genes characterized by (1) a regulatory relationship according to miRanda predictions and (2) expression profiles strongly anticorrelated. Indeed, because miRNAs tend to down-regulate target mRNAs, the expression profiles of genuinely interacting pairs are expected to be anticorrelated. Thus, for each miRNA/gene pair scored as potentially interacting on the basis of miRanda prediction, the Pearson correlation coefficient of the respective expression vectors in MM samples was calculated and used as an estimator of the functional activity of the miRNAs on the target genes. Genes were considered genuine miRNA targets when included within the top 3% of all pairs ordered on their anticorrelation score.24 This selection gave rise to the final adjacency matrix S of regulatory relations supported by MM expression data and the associated miRNAs/genes regulatory network. The matrix S defined a bipartite directed network with 2 types of nodes (miRNAs and mRNAs) connected by directed edges, each representing a probable functional regulatory effect of a miRNA on a target gene. The posttranscriptional network allows identifying groups of genes regulated by the same miRNA/s, and of miRNAs regulating specific groups of genes of functional relevance. The networks were drawn using Cytoscape,25 and the functional enrichment analysis was performed using Database for Annotation, Visualization and Integrated Discovery 2008 Tool (http://david.abcc.ncifcrf.gov/).
Statistical analysis
Conventional statistical procedures were applied using standard packages for R software (Kendall τ correlations, Wilcoxon rank-sum tests, t tests, and Fisher exact tests).
Results
Global miRNA expression profiling in MM patients
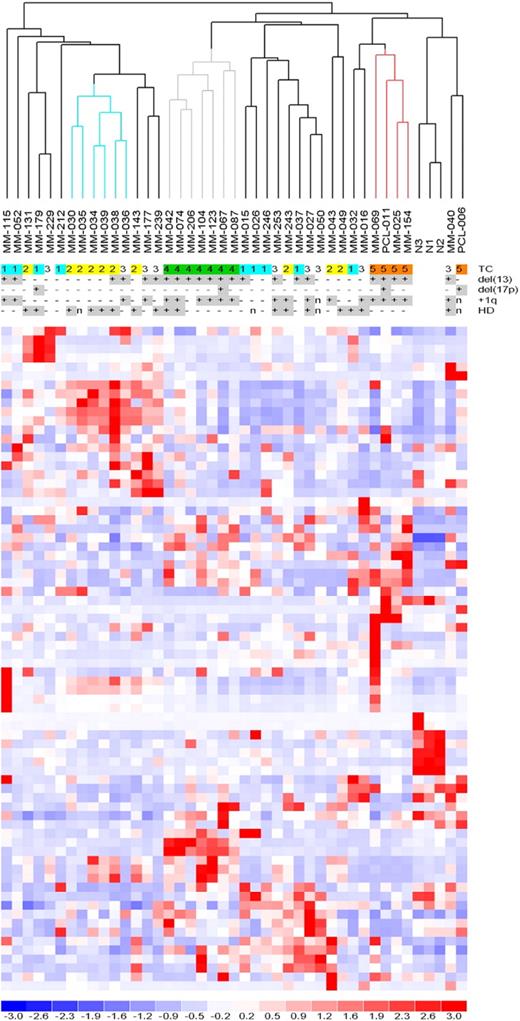
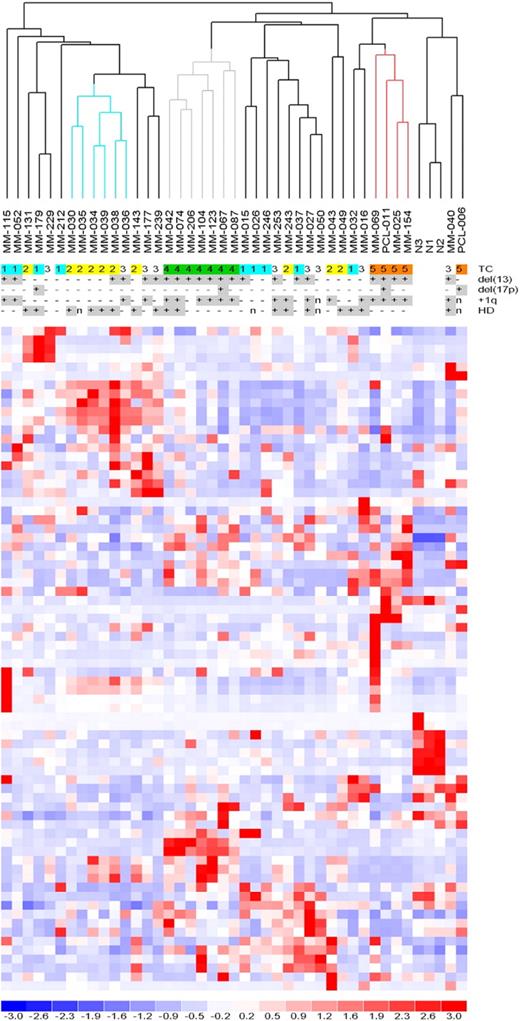
MiRNA profiles were analyzed by high-density microarrays, specific for 723 human miRNAs, in 40 patients representative of the 5 TC groups (supplemental Table 1), and in PCs from 3 NCs. To determine whether global miRNA profiling could distinguish the molecular groups, we performed an unsupervised analysis using conventional hierarchical agglomerative clustering: the 43 samples were described by 74 miRNAs whose average change in expression levels varied at least 2-fold from the mean across the dataset.19 The most striking finding was that all of the TC4 patients were tightly clustered (Figure 1, gray cluster, P < .001), as were 4 of 5 TC5 cases (red cluster, P < .001). The TC2 cases were partially grouped (blue cluster, P < .005), whereas the TC1 and TC3 samples were scattered along the dendrogram. The NCs were clearly grouped in a distinct sub-branch.
Unsupervised analysis of miRNA expression profiles. Hierarchical clustering of the samples using the 74 most variable miRNAs (patients in columns, miRNAs in rows). The color scale bar represents the relative miRNA expression changes normalized by the standard deviation. The patients' molecular characteristics are shown above the matrix; n indicates unavailable information. Specific characteristics are enriched in colored sub-branches.
Unsupervised analysis of miRNA expression profiles. Hierarchical clustering of the samples using the 74 most variable miRNAs (patients in columns, miRNAs in rows). The color scale bar represents the relative miRNA expression changes normalized by the standard deviation. The patients' molecular characteristics are shown above the matrix; n indicates unavailable information. Specific characteristics are enriched in colored sub-branches.
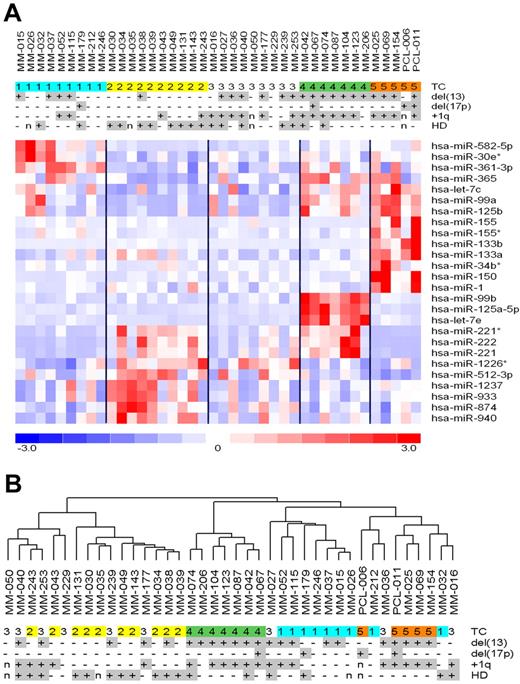
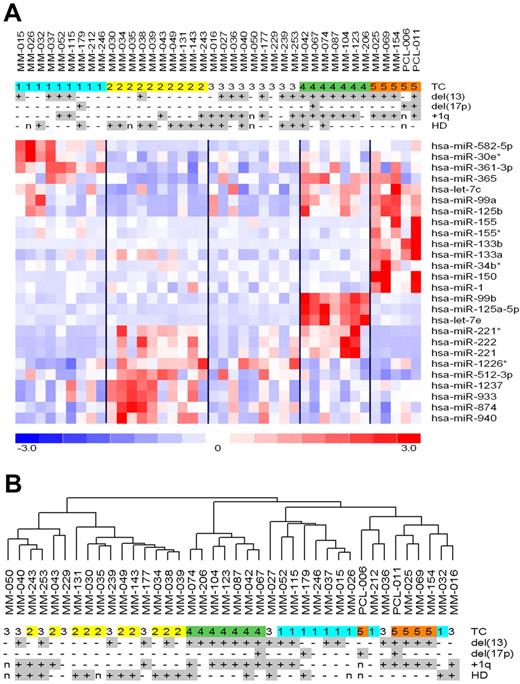
Next, multiclass analysis allowed identifying a set of 26 miRNAs showing highly significant differential expression (at q value = 0) across the 5 TC groups (supplemental Table 2). As shown in Figure 2A, all of the TC groups except TC3 were characterized by the up-regulation of specific miRNAs. In particular, 10 (38%) miRNAs (miR-150, miR-133b, miR-99a, miR-133a, miR-155, miR-125b, let-7c, miR-1, miR-155*, and miR-34b*) were expressed at higher levels in TC5 than in the other classes, 7 (27%) in TC4 (miR-125a-5p, let-7e, miR-99b, miR-222, miR-221, miR-221*, and miR-365), 6 (23%) in TC2 (miR-874, miR-1237, miR-512-3p, miR-940, miR-933, and miR-1226*), and 3 (11%) in TC1 (miR-361-3p, miR-582-5p, and miR-30e*). Notably, miR-125a-5p, let-7e, and miR-99b, which were associated with the highest scores in the supervised analysis and overexpressed specifically in the TC4 samples, belong to a cluster at 19q13.33, whereas mir-99a, let-7c, and mir-125b-2, highly expressed in the TC5 cases, belong to a paralogous cluster at 21q21.1. Figure 2B shows the 40 MM samples clustered according to the expression profiles of the 26 miRNAs, suggesting their capacity to drive TC distribution into separate branches. To test the correctness of the obtained signature and its capability to discriminate the 5 TC groups, we additionally tested the predictive power of the 26 miRNAs using linear discriminant analysis for classification of multivariate observations. The procedure led to confirm the accuracy of the identified signature, at a percentage of an overall classification rate of 89.3%: specifically, all TC1, TC4, and TC5 samples were classified correctly, whereas TC2 and TC3 cases showed a misclassification error of 32.8% and 11.1%, respectively.
Identification of miRNA signatures characterizing TC classes. (A) Heatmap of the differentially expressed miRNAs in MM patients stratified into the 5 TC groups. (B) Dendrogram of the 40 MM samples clustered according to the expression profiles of the 26 miRNAs.
Identification of miRNA signatures characterizing TC classes. (A) Heatmap of the differentially expressed miRNAs in MM patients stratified into the 5 TC groups. (B) Dendrogram of the 40 MM samples clustered according to the expression profiles of the 26 miRNAs.
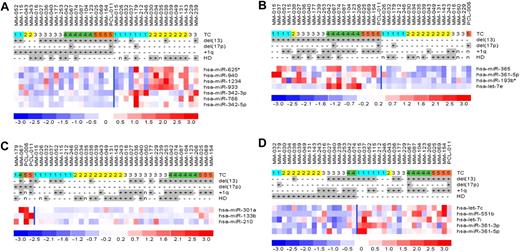
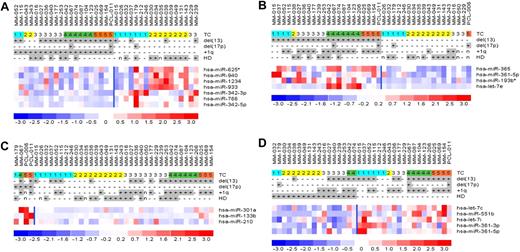
We also investigated the differential miRNA expression on the basis of the occurrence of other recurrent chromosomal alterations, such as 1q gain and 13q and 17p deletions, and identified several differentially expressed miRNAs, none of which was located in the involved chromosomal region. Similarly, comparison of the HD and NHD cases revealed a set of up-regulated miRNAs only in the latter. Some of the miRNAs identified in these analyses were the same as those found in IGH-translocated patients, in all likelihood because of their representativeness within 1q gain, del(13), del(17), and NHD cases (Figure 3).
Identification of miRNA signatures characterizing distinct MM genetic subgroups. Supervised analyses identifying the miRNAs that are differentially expressed in MM patients harboring: (A) gain/amplification of the 1q arm, (B) del(13q14), (C) deletion of 17p, and (D) hyperdiploidy.
Identification of miRNA signatures characterizing distinct MM genetic subgroups. Supervised analyses identifying the miRNAs that are differentially expressed in MM patients harboring: (A) gain/amplification of the 1q arm, (B) del(13q14), (C) deletion of 17p, and (D) hyperdiploidy.
Quantitative RT-PCR validation of differentially expressed miRNAs
To validate the microarray data, the levels of some miRNAs (miR-99b, miR-582-5p, miR-155, miR-30e*, miR-125b, miR-133b, miR-221, miR-222, miR-125a-5p, and miR-99a) were quantified by quantitative RT-PCR in all of the 43 samples. As shown in supplemental Table 3, linear correlation analysis indicated a very good correspondence between the 2 techniques.
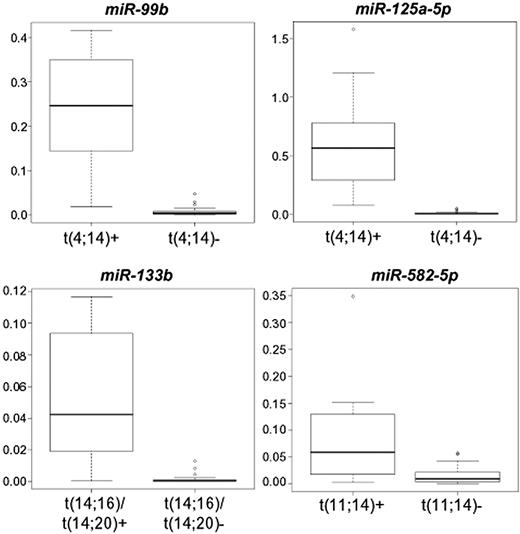
Furthermore, the expression of miR-99b, miR-582-5p, miR-133b, and miR-125a-5p was also evaluated in 14 additional cases, 4 cases of which carrying t(11;14), 7 t(4;14), and 3 t(14;16) or t(14;20). Overall, in the 54-sample panel, miR-99b and miR-125a-5p were confirmed as showing statistically significant and specific overexpression in the t(4;14) group; miR-133b in the t(14;16)/t(14;20) group; and miR-582-5p in the t(11;14) group (P < .001 for all miRNAs; Figure 4).
Quantitative RT-PCR validation of miRNA expression. Box plots of miRNAs quantified in quantitative RT-PCR in the broadened panel of 54 MM-PCL cases, whose expression significantly correlated with the presence of a specific IGH translocation. Expression levels are given as 2−ΔCt.
Quantitative RT-PCR validation of miRNA expression. Box plots of miRNAs quantified in quantitative RT-PCR in the broadened panel of 54 MM-PCL cases, whose expression significantly correlated with the presence of a specific IGH translocation. Expression levels are given as 2−ΔCt.
Integrative analysis of miRNA expression profiles with genome-wide copy number variations and occurrence of LOH
To evaluate the influence in miRNA expression of the allelic imbalances detected at a genome-wide level, we performed an integrative analysis of mature miRNA expression levels and their inferred DNA CN values, available in 19 of 40 cases (supplemental Table 1).20 The correlation analysis identified 49 mature miRNAs (P < .05; supplemental Table 4), mainly localized on chromosome 1 (8 of 49, 16%), followed by chromosome 19 (6 of 49, 12%), chromosome 17 (4 of 49, 8%), and chromosomes 3, 5, 11, 13, 14, and 15 (3 of 49 each, 6%). Notably, miR-520a-5p, miR-518d-5p, miR-498, and miR-520g belong to a cluster at 19q13.41, and miR-17, miR-20a, and miR-20a* belong to the mir-17∼92 cluster at 13q31.3.
Next, we tested the correlation between miRNA expression and the occurrence of LOH, as defined in our previous report.20 We identified the down-regulation of 14 miRNA genes in the presence of LOH (supplemental Table 5): let-7b, mapped to 22q13.31 (P = .017), and miR-662 (16p13.3, P < .012) were the most statistically significant. We also highlighted the intronic miRNA miR-140-3p (P = .022), which maps to 16q22.1; the miR-19b and miR-20a belonging to the mir-17∼92 cluster at 13q31.3 (P < .022 and .029, respectively); and miR-137 (P < .024), which maps to 1p21.3.
Integrative analysis of miRNA/mRNA expression and reconstruction of a regulatory network in MM
The integrative analysis of miRNA/mRNA expression profiles allows reconstructing a network of functional interactions occurring in MM from the panel of potential regulatory relationships predicted from sequence information. Our integrative approach assumes that the final effect of a truly functional interaction between a miRNA and its predicted mRNA targets can be seen as a pair of anticorrelated expression profiles. Thus, the set of MiRanda predicted targeting relationships was refined selecting those more strongly supported by the miRNA and mRNA expression data. The entire procedure led to the identification of 23 729 regulatory relationships, namely, anticorrelation, involving 628 miRNAs and 6435 predicted target genes, as approximately 47% of the genes associated with an expression profile were not targets of any of the considered miRNAs and 93 miRNAs (13%) were not significantly anticorrelated with any target gene. The data from the integrative analysis were used to reconstruct a bipartite direct miRNAs/mRNAs regulatory network. The number of target genes per miRNA ranged from 1 to 440 (average, 34; mean, 3.7 miRNAs per gene; supplemental Table 6).
Various subnetworks can be derived from the global identified network, as those accounting for the targeting relationships of specific miRNA signatures associated with distinct TC groups. supplemental Figure 1 reports the subnetwork of the t(4;14) miRNA signature, ie, one of the most consistent and specific subgroups of our dataset. The network of t(4;14) consists of 7 miRNAs and 289 anticorrelated targets, with the number of targets per miRNA ranging from 1 to 113, and approximately 29% of the genes being targeted by at least 2 miRNAs. Interestingly, 3 genes are commonly regulated by 5 miRNAs (CBFA2T2, core-binding factor, runt domain, α subunit 2, translocated to, 2; PPP1R16B, protein phosphatase 1, regulatory inhibitor subunit 16B; and GOSR2, Golgi SNAP receptor complex member 2). Functional enrichment analysis of anticorrelated targets revealed various overrepresented biologic processes, including chromosome segregation, protein polyubiquitination, cell cycle regulation, and unfolded protein response (supplemental Table 7). Interestingly, a comparison between the identified supported miRNA target genes and mRNAs down-regulated in the t(4;14) cases (as identified in a larger proprietary dataset of 132 MMs, data not shown) highlighted that the miRNA targets were significantly enriched in down-regulated genes (P < .001; supplemental Table 8). Similarly, subnetworks were derived considering the sets of miRNAs differentially expressed in TC5 and TC1 groups (supplemental Table 9).
Discussion
In this study, the integrative analysis of the different types of genomic data (ie, miRNA and mRNA expression levels and genome-wide CN profiles) allowed the definition of distinct patterns of miRNA deregulation and the prediction of the miRNA/mRNA regulatory networks in molecular subtypes of MM.
Particularly, our results highlighted that specific patterns of miRNA expression may differentiate MMs with distinct and well-known genetic alterations. Specific signatures were found to be associated with t(4;14) or translocated MAF genes and, to a lesser extent, with t(11;14) and TC2 group (expressing moderate levels of CCND1 in the absence of IGH translocation). This scenario is reminiscent of that previously described at mRNA level in the context of the TC classification.4 Other chromosomal abnormalities recurrently observed in MM samples (ie, 13q deletion, 1q gain/amplification, 17p deletion, and the HD status) appeared to be associated with less strong miRNA signatures, a finding that needs to be clarified in larger series.
Most of the 26 miRNAs significantly discriminating the TC groups have previously been found to be involved in solid and hematologic tumors. The most extensively investigated are miR-155, miR-221 and miR-222, and the let-7 family. MiR-155 is involved in many biologic processes, including hematopoiesis, inflammation, and immunity, and its deregulation has been found to be associated with certain types of solid and hematologic tumors, in which it is predominantly overexpressed and acts as an oncomir.26 Notably, miR-155 has been very recently found deregulated in Waldenström macroglobulinemia (WM), suggesting a role in the proliferation and growth of WM cells acting on signaling cascades, including MAPK/ERK, PI3/AKT, and nuclear factor-κB pathways.27 In addition, miR-155 knockdown leads to significant increase of WM cells in G1 phase and to the down-regulation of cyclin-dependent kinases and cyclins D and the simultaneous up-regulation of p53 expression, suggesting a critical role in the regulation of cell-cycle proteins responsible for G1 arrest.27 MiR-221 and miR-222 have also been found to be up-modulated in many tumors and described to target the C-KIT, p27, and p57 genes.28,29 Finally, many human let-7 genes, which are known to target RAS genes and oncogenes involved in the cell cycle, such as HMGA2, MYC, CDK6, and CDC25,30 map to regions frequently deleted in human tumors, indicating that they may function as tumor suppressors. The most striking finding was the very specific expression of 3 miRNAs (miR-99b, let-7e, and miR-125a-5p), encoded in a conserved genomic cluster, in the t(4;14) cases. They are coordinately up-regulated during metamorphosis in Drosophila, where they are cotranscribed as a single polycistronic transcript.31,32 Although their involvement has been suggested in various tumors, to our knowledge, this is the first evidence of their coordinated deregulation in cancer.
The differential miRNA expression associated with distinct genetic subgroups is a novel finding in MM. Of note, it has already been reported in other hematologic malignancies, such as acute myeloid leukemia33 and chronic lymphocytic leukemia. As regards this latter neoplasia, in which the role of miRNA has been extensively investigated,34 the presence of miRNA signatures associated with the major specific genetic lesions (trisomy 12 and 13q14, 11q23, and 17p13 deletions) has been reported very recently.35 Interestingly, as found in our study, the discriminating miRNAs were not localized in the chromosomal regions specific for the corresponding cytogenetic abnormalities. Overall, the identification of specific miRNA patterns may help not only to distinguish distinct MM genetic subgroups known to show differences in term of response to therapy and survival, but also to provide a better understanding of their pathogenesis.
We also evaluated the impact in miRNA expression of allelic imbalances occurring in MM. Our integrative analysis identified the occurrence of a gene dosage effect on the expression of several miRNAs, as has previously been reported in HMCLs.16 Interestingly, some of the miRNA genes map to hotspot-altered regions in MM: for example, mir-17 and mir-20a, which belong to a cluster at 13q31, which was deleted in almost 40% of our patients; furthermore, a number are located in odd-numbered chromosomes involved in hyperdiploidy, particularly chromosomes 3, 5, 7, 9, 11, and 19; and 3 (mir-1231, mir-205, and mir-215) belong to the long arm of chromosome 1, which was gained at a frequency of more than 30%. Using the analog integrative approach, we evaluated the impact of LOH on miRNA expression, based on the data described in our recently published study.20 Among the identified miRNA whose expression correlated with the occurrence of LOH, let-7b has been previously reported as the most discriminatory miRNA between acute lymphoid leukemia cases compared with acute myeloid leukemia cases (significantly down-regulated in acute lymphoid leukemia).36 Moreover, it has been demonstrated that let-7b correlated with the cytogenetic prognostic risk associated with the samples, being low in the favorable groups and high in intermediate and adverse acute myeloid leukemia cases.37 Of note, we also identified a significant correlation between miR-140-3p expression and the occurrence of LOH at 16q22.1-q23.1, which has been described as recurrent in MM by others and us.20,38 We have also demonstrated that LOH at 16q22.1 significantly correlated with the expression of WWP2,20 host gene of miR-140-3p involved in ubiquitination processes, suggesting that LOH (associated with monoallelic loss or other mechanisms, such as uniparental disomy) may also represent an important mechanism in the coordinated control of miRNA and gene expression in MM.
The computational prediction of miRNA targets currently presents several significant challenges because all of the most widely used tools (miRanda, TargetScan, PicTar, PITA, and RNAhybrid) are characterized by a significant proportion of false-positive interactions39,40 that are partly because posttranscriptional regulation is context-dependent. On the basis of increasing experimental evidence supporting the hypothesis that miRNAs can act through target degradation, it has been proposed that target predictions could be integrated with miRNA and gene expression profiles to select functional miRNA/mRNA relationships. This can be done by adopting a variational Bayesian model and software,41,42 or simply using a nonheuristic method based on miRNA/mRNA anticorrelations. We applied the latter to our dataset, which allowed the reconstruction of a general miRNA/mRNA regulatory network that represents the putative functional regulatory effects (as supported by expression data) of all of these miRNAs on their targets in MM.
On the basis of the target genes identified here, several the miRNAs differentially expressed in IGH translocated cases may play important roles in the biology of MM PCs. With regard to the t(4;14) miRNA signature, 5 miRNAs target CBFA2T2, a nuclear repressor homologous to ETO that binds to the AML1-ETO complex and may play a role in hematopoietic differentiation.43,44 Furthermore, let-7e targets PTPRE, a positive regulator of osteoclast function45 and a selective inhibitor of IL-6– and IL-10–induced JAK-STAT signaling.46 Interestingly, the expression of the tumor suppressor gene PDCD4 (programmed cell death 4),47 a supported target of miR-221 based on our analysis, has recently been found to depend on the levels of MMSET, which is deregulated by the t(4;14).48 ING4, a tumor suppressor frequently mutated or down-regulated in human cancers, which was recently described to exert an inhibitory effect on MM-induced angiogenesis,49,50 is a supported target of miR-365. Concerning the TC5 signature, miR-133a targets DMTF1, a putative tumor suppressor that activates the ARF-p53 pathway, leading to cell growth arrest or apoptosis; notably, it maps at 7q21, often deleted in human malignancies.51 Finally, among the miRNAs up-regulated in t(11;14), miR-361-3p and miR-30e* target PPP2R4, an activator subunit of PP2A, which plays an important role in the survival and growth of MM cells because it dephosphorylates the GP130 subunit of the IL-6 receptor, thus preventing its degradation and allowing the activation of IL-6 signaling.52,53
Taken together, our findings strongly suggest that understanding the molecular biology of myeloma requires considering the miRNome in the context of the genomic and transcriptomic features of malignant PCs. Based on this integrated approach, our data may provide an important contribution to future investigations aimed at characterizing the role of specific miRNAs in MM pathogenesis.
The online version of this article contains a data supplement.
Acknowledgments
This work was supported by Associazione Italiana Ricerca sul Cancro (A.N.), Associazione Italiana contro le Leucemie Milano, Fondazione CARIPARO (Progetti Eccellenza 2006 and PhD 2008), MIUR (PRIN2007Y84HTJ and PRIN2007CHSMEB), University of Padova (CPDR074285/07), University of Modena (Finanziamento 2008), and Fondazione Cassa di Risparmio di Modena (Bando ricerca 2007). L.A. and K.T. are supported by Fellowships from Fondazione Italiana Ricerca sul Cancro.
Authorship
Contribution: M.L. performed the research, performed miRNA profiling and quantitative RT-PCR, analyzed the data, and wrote the manuscript; M.B. and G.S. generated and analyzed the microRNA/mRNA network data; L.A. performed transcriptional, genotyping, statistical, and integrative analyses and wrote the manuscript; K.T. generated gene expression profiling data; L.M. generated genotyping data; S.F. and G.L.D. collected patient samples; L.L. designed research and revised the manuscript; and S. Bicciato, S. Bortoluzzi, and A.N. designed research and wrote the manuscript.
Conflict-of-interest disclosure: The authors declare no competing financial interests.
Correspondence: Antonino Neri, Department of Medical Sciences, University of Milan, F. Sforza 35, 20122 Milano, Italy; e-mail: antonino.neri@unimi.it.
References
Author notes
M.L. and M.B. contributed equally to this study.

