Abstract
Precursor T-cell acute lymphoblastic leukemia (T-ALL) in children represents a clinical challenge, because relapses are usually fatal. It is thus necessary to identify high-risk patients as early as possible to effectively individualize treatment. We aimed to define novel molecular risk markers in T-ALL and performed array-based comparative genomic hybridization (array-CGH) and expression analyses in 73 patients. We show that DNA copy-number changes are common in T-ALL and affect 70 of 73 (96%) patients. Notably, genomic imbalances predicted to down-regulate the TGF-β or up-regulate the PI3K-AKT pathways are identified in 25 of 73 (34%) and 21 of 73 (29%) patients, suggesting that these pathways play key roles in T-ALL leukemogenesis. Furthermore, we identified a deletion at 6q15-16.1 in 9 of 73 (12%) of the patients, which predicts poor early treatment response. This deletion includes the CASP8AP2 gene, whose expression is shown to be down-regulated. The interaction of CASP8AP2 with CASP8 plays a crucial role in apoptotic regulation, suggesting a functional link between the clinical effect of the deletion and the molecular mode of action. The data presented here implicate the TGF-β and PI3K-AKT pathways in T-ALL leukemogenesis and identify a subgroup of patients with CASP8AP2 deletions and poor early treatment response.
Introduction
Precursor T-cell acute lymphoblastic leukemia (T-ALL) affects about 15% of children with ALL, the most frequent malignancy in childhood.1 Patient outcome has profoundly improved over the last decades leading to cure in approximately 80% of children and adolescents with T-ALL.2,3 However, approximately 20% of patients experience recurrent disease, and the prognosis of relapsed T-ALL remains poor.4 Therefore, stringent risk assessment has become an important issue to both improve survival of patients at high risk and decrease treatment-related toxicity and long-term sequelae in standard-risk patients. Depending on the patients' response to induction therapy, risk groups ranging from standard to very high risk have been defined.3,5
Minimal residual disease (MRD) assays are used to directly measure treatment response in vivo and have become an integral part of patient stratification in current ALL treatment protocols.3,6,7 In response to induction treatment, a large proportion of T-ALL patients show a prognostically favorable reduction of leukemia cell counts (to less than 1 leukemic cell among 104 normal bone marrow [BM] cells), while detectable MRD in 104 normal cells even after completed remission induction is associated with an unfavorable prognosis.2,5 Thus, MRD assays have become the single most powerful tool to predict long-term patient outcome.8,9 However, measurement of MRD kinetics allows risk assessment and treatment stratification only after the induction phase of therapy. It would be conceptually preferable to identify risk markers at the time of diagnosis, thus allowing stratification before induction treatment.
The heterogeneity in response to therapy in childhood T-ALL likely depends on the activation of different leukemogenic pathways defining their susceptibility to current treatment protocols. In a small number of patients, genome-wide expression profiling revealed that T-ALL can be grouped according to the overexpression of specific oncogenes, namely HOX11, HOX11L2, TAL1 plus LMO1/2, LYL1 plus LMO2, and MLL-ENL.10 Favorable prognosis was reported for patients with the HOX11 or MLL-ENL subtypes,10 whereas outcome was particularly unfavorable in leukemias showing down-regulation of caspase 8–associated protein 2 (CASP8AP2) mRNA expression.11
Even though RNA-based risk markers may prove to be useful in the future, quantification of mRNA in clinical samples is technically demanding and has been shown to strongly depend on preanalytic handling of the bone marrow.12,13 In principle, DNA-based markers are more robust and may thus be more applicable in practice. Therefore, we aimed at the identification of novel genomic aberrations that could serve both, as prognostic biomarkers and to discover biologically relevant pathways in leukemogenesis and treatment response. In this study, we examined 73 primary pediatric T-ALL for DNA copy-number aberrations by using array-based comparative genomic hybridization (array-CGH). We discovered several small novel genomic aberrations that affect key regulators and downstream intermediates of transforming growth factor-β (TGF-β) and phospatidylinositol 3-kinase-AKT (PI3K-AKT) signaling. Furthermore, deletions at chromosome band 6q15-16.1 including the CASP8AP2 gene identified a subgroup of patients with poor treatment response.
Methods
Patient samples
Leukemia samples were obtained from patients enrolled into the multicenter ALL- Berlin-Frankfurt-Munster (BFM) 1990, ALL-BFM 1995, and ALL-BFM 2000 protocols.5,14,15 The Institutional Review Boards of the Hannover Medical School and all participating centers approved these studies. Informed consent was obtained in accordance with the Declaration of Helsinki. Isolation of mononuclear cells (MNCs) from BM was followed by DNA extraction. A blast percentage of 80% or more was detected in all BM samples.
A total of 73 patients with T-ALL were included in this study, 52 were male and 21 female. This group of patients showed a partial overlap with those who had previously been reported in the context of the prognostic impact of NOTCH1 mutations (31/73).2 The median age was 9 years (Table 1). Patients enrolled in the ALL-BFM 1990, ALL-BFM 1995, and ALL-BFM 2000 studies were selected depending on the availability of sufficient amounts of DNA for molecular analysis, data on prednisone response, and NOTCH1 mutation status. Patient characteristics were comparable between the different studies (supplemental Table 1, available on the Blood website; see the Supplemental Materials link at the top of the online article). Comparison of clinical and hematological characteristics of the patients included in this study and those of the entire BFM-ALL study population revealed that the patients analyzed here were representative for the entire BFM-study population, apart from a slight overrepresentation of the cortical T-cell immunophenotype (supplemental Table 2). Subclassification of T-ALL was performed by immunophenotyping according to the guidelines of the European Group for Immunological Characterization of Leukemias (EGIL).16 BCR/ABL-positive patients were excluded.17,18 Early in vivo response to prednisone, defined as the cytoreduction (peripheral blood blast count on day 8) upon a 7-day prednisone treatment prephase and a single intrathecal dose of methotrexate on day 1, served as an early indicator for treatment efficiency.19 This data point was available for 68 of 73 patients. According to prednisone response, patients were stratified as good responders (< 1000 blasts/μL at day 8, prednisone good responder [PGR]) or poor responders (≥ 1000 blasts/μL at day 8, prednisone poor responder [PPR]).19 Treatment response was further defined by determination of MRD kinetics on day 78 of treatment (available for 47 of 73 patients).6,7,20 The presence or the absence of detectable leukemic cells in 104 cells at this time point defined unfavorable or favorable MRD status, respectively.2
Nucleic acid isolation
Extraction of high molecular weight DNA from BM samples (2-5 mL) of patients with primary T-ALL and from peripheral blood MNCs of healthy donors (pool of 10 donors for each sex, age 25-40 years) was carried out with the QIAmp DNA blood Midi kit (QIAGEN).
Total RNA from BM samples was isolated with the TRIzol reagent (Invitrogen) and subsequently passed over a QIAGEN RNeasy column for the removal of small fragments. Total RNA was quantified and validated for integrity using the Bioanalyzer 2100 (Agilent).
As a tissue-specific control, T cells from the peripheral blood of 5 healthy donors (age 16-28 years) were purified using immunomagnetic beads (human Pan T Cell Isolation kit II; Miltenyi Biotec). Purity of the recovered subpopulations was checked by flow cytometry (FACSCalibur; BD Biosystems) and was greater than 90% for all individual samples.
Array-CGH
Array-CGH (or matrix-CGH)21 was carried out as previously described.22,23 Selection of genomic clones, isolation of BAC-DNA, performance of degenerate oligonucleotide-primed polymerase chain reaction (PCR), preparation of microarrays, labeling, hybridization, and washing procedures were performed as previously outlined.22,23 Normalized log2 ratios as well as raw data sets of this study have been deposited in the National Center for Biotechnology Information (NCBI) Gene Expression Omnibus (accession nos. GPL5713, GSE8738; http://www.ncbi.nlm.nih.gov/geo/).
Array-CGH data analysis
Microarray image analysis was performed as previously reported.23 The extracted raw data were preprocessed and normalized with the R software24 using the in-house-developed ChipYard microarray analysis software (http://www.dkfz.de/genetics/ChipYard/). To eliminate low-quality spots, 3 different quality criteria were applied: (1) the standard deviation of replicated spots had to be less than 0.2 (log2); (2) the foreground signal of a spot was required to be above 1.5 times the background signal in at least 1 channel; and (3) inhomogeneous spots were removed if their mean-to-median ratio exceeded a cutoff defined by the 75th quartile plus 3 times the interquartile range of all spots. For each hybridization, raw fluorescence intensity values were normalized by applying print-tip LOWESS normalization.25
A k-state hidden Markov model was fitted to the normalized data to identify genomic breakpoints. The median absolute deviation (MAD) of balanced regions was used to define the sample experimental variation (SDa) per array. Genomic alterations were defined as log2-ratios larger than 3 times SDa (gains) or smaller than 3 times SDa (losses). Clones with incomplete mapping information missing data in more than 20% of all cases or known to harbor copy-number polymorphisms according to the Database of Genomic Variants (February 2007, http://projects.tcag.ca/variation/project.html) were excluded from further analyses.26
This resulted in a total of 7456 evaluable clones. Remaining missing values were imputed using the LOWESS scatterplot smoother.27,28 To identify the genomic aberrations best distinguishing between clinical and biological subgroups, the nearest shrunken centroid method with 100-fold bootstrap resampling was used.29
NOTCH1 and CDKN1B mutation analysis
Control samples, primers, and PCR conditions to amplify the N-terminal region of the heterodimerization domain (HD-N; exon 26), the C-terminal region of the heterodimerization domain (HD-C; exon 27), the transcriptional activation domain (TAD; exon 34), and the PEST domain (exon 34) of NOTCH1 and exon 3 of CDKN1B have been reported.30,31 In all experiments, controls were included in the absence of DNA to rule out contamination by PCR products. All mutations were confirmed by analyzing the products of a second independent PCR as well as by sequencing of both strands of the PCR products with the ABI PRISM 3100 DNA Analyzer (Applied Biosystems).
Quantitative reverse transcription PCR (RT-PCR)
To correlate the DNA copy-number status of candidate genes with their mRNA expression, 5 μg of total RNA from leukemia cells and a reference from normal T lymphocytes (pool of 5 individuals, age 16-28 years) were used as a template for reverse transcription with Superscript II First Strand Synthesis kit (Invitrogen), respectively. Each cDNA sample was analyzed in triplicate using ABI PRISM 7700 (Applied Biosystems) with Absolute SYBR Green ROX Mix (ABgene) according to the manufacturer's instructions. Two endogenous housekeeping genes (NOM1, LNPEP) were used for internal normalization. All primers were tested to exclude amplification from genomic DNA. Quantification of the transcript of interest relative to the housekeeping genes was calculated according to a previously published algorithm, with the exception that we used 2 housekeeping genes.32 Oligonucleotide sequences for all primer pairs are shown in supplemental Table 3.
Statistical analysis
The means of CASP8AP2 mRNA expression in unfavorable and favorable MRD groups were compared using the Welch modification of 2 sample test. Subgroup specific expression of BIM mRNA was compared using Wilcoxon test of 2 samples. Whenever, samples showed unequal variances, Welch modification of 2-sample test was applied, and if samples had the same distribution, Wilcoxon test of 2 samples was used. Fisher exact test was used to compare the frequencies of DNA copy-number changes of minimally overlapping regions in clinical and molecular subgroups. Deletion at chromosomal band 6q15-16.1, NOTCH1 mutation status and T-cell immunophenotype were included in the multivariate logistic regression model as possible prognostic factors for MRD kinetics on day 78. T-cell immunophenotype was categorized into 2 groups: cortical versus noncortical immunophenotypes. Due to the small sample size and the small number of events, the Firth penalized-likelihood logistic regression was used. P values of .05 or below were considered to be significant. Statistical analyses were performed with the R software environment, Version 2.6.1.24 using the R package logistf, version 1.06.33
Results
Array-CGH analysis
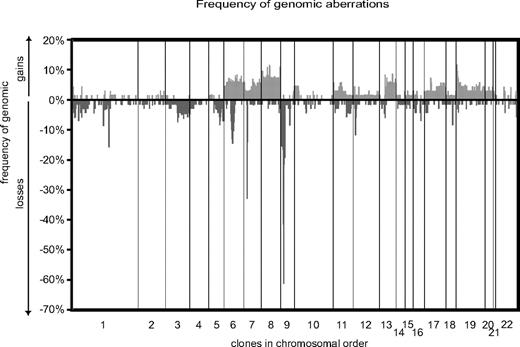
In this study, samples from 73 children and adolescents with T-ALL were analyzed for DNA copy-number aberrations by using high-resolution array-CGH (Figure 1). A total of 626 genomic imbalances were identified in 70 patients. In 3 patients, no aberration was found. The median number of aberrations was 8 (range, 0-47), and genomic deletions (n = 412) were generally more frequent than copy-number gains (n = 214). Recurrent DNA copy-number aberrations observed in 4 or more patients and corresponding candidate genes, which were selected based on their reported and putative cancer-related functions, are summarized in Table 2.
Summary of DNA copy-number aberrations in pediatric T-ALL. Frequencies of DNA copy-number imbalances of 73 pediatric T-ALL were plotted against their chromosome position.
Summary of DNA copy-number aberrations in pediatric T-ALL. Frequencies of DNA copy-number imbalances of 73 pediatric T-ALL were plotted against their chromosome position.
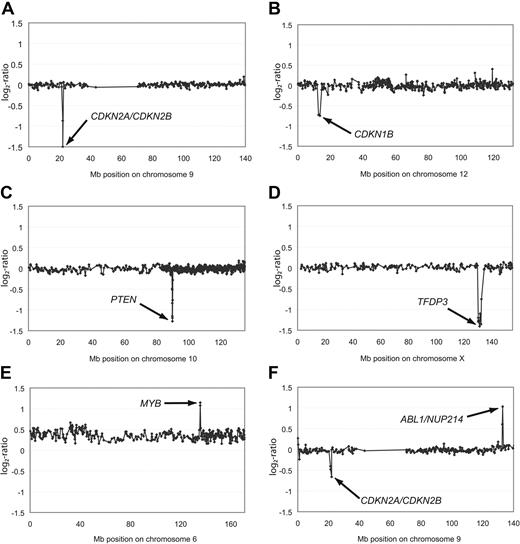
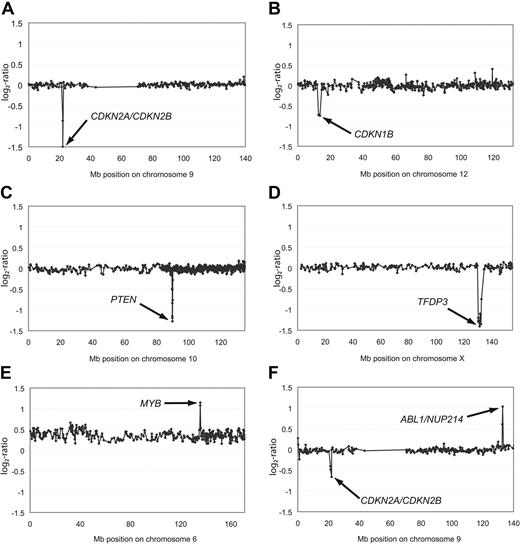
The most common deletions found in this patient cohort involve the CDKN2A, CDKN2B (Figure 2A), and CDKN1B (Figure 2B) loci (Table 2). CDKN1B was only altered by heterozygous deletions (8/69; 12%). Additional mutations in exon 3 of CDKN1B, which have previously been shown to lead to reduced mRNA stability of this tumor suppressor gene,30 were not observed in any leukemia analyzed here (0/73). Thus, mutations in the 3′ untranslated region of CDKN1B are not a common component of T-ALL leukemogenesis. By contrast, the leukemia genomes were frequently affected by homozygous deletions haboring the CDKN2A and the CDKN2B genes (22/72; 31%) and also by heterozygous deletions (21/72; 29%; Figure 2A and Tables 2–3). These findings thus confirm previous reports that showed deletions of the CDKN2A/B locus to be the most frequent genetic alteration in T-ALL and strengthen the hypothesis that 9p21.3 deletions are a crucial “hit” in T-ALL leukemogenesis.34 Interestingly, when compared with patients with 9q21.3 balanced leukemias, neither heterozygous nor homozygous deletions of the CDKN2A gene locus were associated with a differential treatment response in our cohort (P = .76).
Aberrations of single chromosomes affecting genes in leukemogenic pathways. Representative array-CGH profiles of single chromosomes from T-ALL with homozygous deletions of CDKN2A/CDKN2B (A), heterozygous deletion of CDKN1B (B), homozygous deletions of PTEN (C) or TFDP3 (D), amplification of MYB (E), as well as an amplification of ABL1/NUP214 and a heterozygous deletion of CDKN2A/CDKN2B (F). Aberrations are indicated by arrows. All data points are shown as log2-ratios comparing T-ALL DNA with a pool of normal blood DNA from 10 donors. Clones are plotted in chromosome order.
Aberrations of single chromosomes affecting genes in leukemogenic pathways. Representative array-CGH profiles of single chromosomes from T-ALL with homozygous deletions of CDKN2A/CDKN2B (A), heterozygous deletion of CDKN1B (B), homozygous deletions of PTEN (C) or TFDP3 (D), amplification of MYB (E), as well as an amplification of ABL1/NUP214 and a heterozygous deletion of CDKN2A/CDKN2B (F). Aberrations are indicated by arrows. All data points are shown as log2-ratios comparing T-ALL DNA with a pool of normal blood DNA from 10 donors. Clones are plotted in chromosome order.
In addition to these common deletions, we identified several less common DNA copy-number alterations. One of these mutations was a homozygous 0.18-Mb deletion observed in 1 patient at 10q23.31, spanning the tumor suppressor gene PTEN (Figure 2C and Table 3). In addition to this homozygous deletion, 3 patients were identified to carry heterozygous deletions of this locus (Table 2) adding up to a frequency of 6% (4/72). Palomero and colleagues had reported frameshift/truncating mutations of PTEN in 9 of 111 (8%) T-ALL patients,35 thus indicating that PTEN inactivation either by deletion or by point mutation represents a common leukemogenic event in T-ALL. Interestingly, inactivation of PTEN appears to have a cooperative effect with PI3K-AKT induction in T-ALL leukemogenesis, rendering the blast independent of NOTCH1 activation.35 A novel homozygous deletion of 2.16 Mb at Xq26.2 affected the TFDP3 locus (Figure 2D). This deletion is of particular interest, because TFDP3 was recently shown to inhibit E2F1-induced p53-mediated apoptosis.36
High-level amplifications (≥ 4 copies of the locus on average) were detected in 2 samples (Table 3). A small high-level amplification of 0.24 Mb in size was identified in 1 patient and mapped to 6q23.3 harboring the candidate genes MYB and AHI1 as well as miRNA hsa-mir-548a-2 (Figure 2E and Table 3), further underlining the role of DNA copy-number gains for MYB-driven leukemogenesis.37 Furthermore, an amplicon was detected at 9q34.13 spanning the genes ABL1 and NUP214 in 2 patients (Figure 2F). This finding is of particular interest, because duplications in close proximity to this locus at 9q34 have recently been reported with an overall frequency of 33% in children with T-ALL.38 In both cases, ABL1 was affected either by amplification or by copy-number gain, further strengthening the evidence of extrachromosomal amplification of ABL1 in T-ALL.39
Genomic imbalances frequently affect TGF-β and AKT signaling
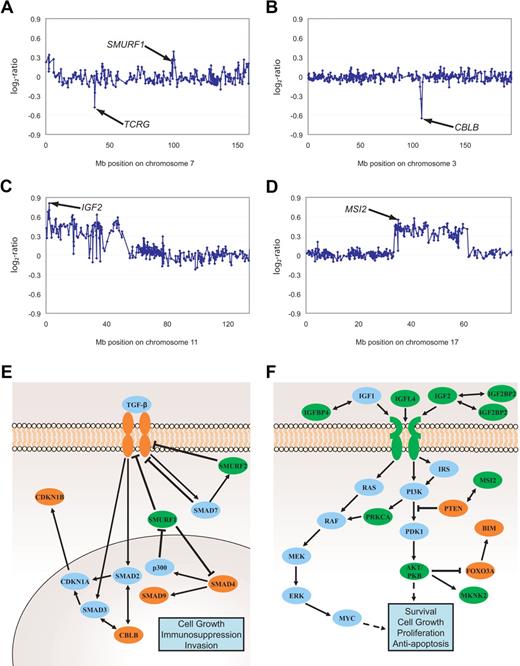
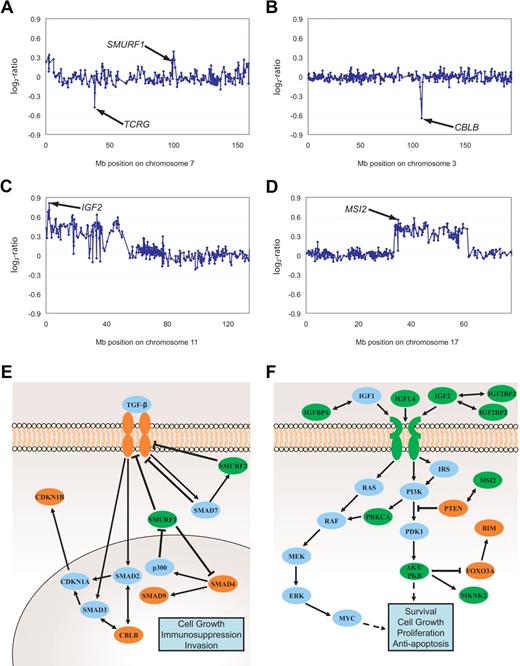
Functional annotation and analysis of gene groups affected by gains and deletions demonstrated that DNA copy-number aberrations harboring genes implicated in TGF-β signaling and PI3K-AKT pathway occurred in 25 of 73 and 21 of 73 patients, respectively, and were thus significantly overrepresented (http://babelomics.bioinfo.cipf.es/). In 36 of 73 leukemias, there were genomic alterations in both pathways thus documenting a partial overlap. As listed in Table 2 (gene symbols marked *) and exemplified in Figure 3A through D, several minimally overlapping regions harbored genes involved in TGF-β and PI3K-AKT signaling (Figure 3A-B and C-D, respectively). Interestingly, copy-number gains frequently affected genomic loci harboring inhibitors, while deletions frequently targeted activating effectors of TGF-β signaling (Figure 3E and Table 4). Furthermore, annotation analysis revealed minimally overlapping regions containing downstream intermediates of the PI3K-AKT pathway (Figure 3F and Table 4), with positive regulators coded in gained regions, and negative regulators coded in deleted regions. To confirm the functional effects of genomic imbalances, mRNA expression of representative candidates was analyzed by quantitative RT-PCR in a subset of samples of which both RNA and DNA was available in sufficient technical quality. With this limitation, we could compare the RNA abundance of 3 CDKN1B deleted and 7 balanced samples, and 3 CBLB deleted and 8 balanced samples (supplemental Figure 1A-B). Although the small number of samples that were available for this integrative genomics analysis precluded a meaningful statistical analysis, the data shown in supplemental Figure 1A and B suggest a gene dosage effect. However, the overlap between the 2 groups also suggests that the expression of these 2 genes can also be down-modulated by other mechanisms. Interestingly, in 3 of 5 leukemias with balanced CDKN1B genes but low mRNA expression, deletions of genes could be identified whose products function further upstream in the TGF-β pathway (SMAD4, TGFBR1, CBLB).
Genomic imbalances affecting TGF-β and PI3K-AKT signaling pathways. Gain of SMURF1 and deletion of TCRG (A), deletion of CBLB (B), gains of IGF2 (C) as well as MSI2 (D). Aberrations are indicated by arrows. All data points are shown as log2-ratios comparing T-ALL DNA with a pool of normal blood DNA from 10 donors. Clones are plotted in chromosome order. Effectors and inhibitors of TGF-β (E) and PI3K-AKT (F) signaling targeted by DNA copy-number changes are marked in green (gains) and red (deletions). SMURF1, Smad ubiquitination regulatory factor 1; SMURF2, SMAD-specific E3 ubiquitin protein ligase 2; SMAD, mothers against DPP homolog; P300, E1A binding protein p300; CDKN1A, cyclin-dependent kinase inhibitor 1A; CDKN1B, cyclin-dependent kinase inhibitor 1B; IGF, insulin-like growth factor; IGFBP, insulin-like growth factor binding protein; IRS1-4, IRS; PTEN, phosphatase and tensin homolog deleted on chromosome 10; PDK1, phosphoinositide-dependent kinase 1; PKB, protein kinase B also named AKT; FOXO3A, forkhead box O3A; BIM, BCL2-like 11 (apoptosis facilitator); MAPK, MAP kinases; MEK, MAP kinase-mitogen activated protein kinase; ERK, MAP kinases Erk1 and 2; MKNK2, MAP kinase interacting serine/threonine kinase 2; MSI2, musashi homolog 2; RAS, RAF kinases; c-myc, oncogene; PRKCA, protein kinase Cα.
Genomic imbalances affecting TGF-β and PI3K-AKT signaling pathways. Gain of SMURF1 and deletion of TCRG (A), deletion of CBLB (B), gains of IGF2 (C) as well as MSI2 (D). Aberrations are indicated by arrows. All data points are shown as log2-ratios comparing T-ALL DNA with a pool of normal blood DNA from 10 donors. Clones are plotted in chromosome order. Effectors and inhibitors of TGF-β (E) and PI3K-AKT (F) signaling targeted by DNA copy-number changes are marked in green (gains) and red (deletions). SMURF1, Smad ubiquitination regulatory factor 1; SMURF2, SMAD-specific E3 ubiquitin protein ligase 2; SMAD, mothers against DPP homolog; P300, E1A binding protein p300; CDKN1A, cyclin-dependent kinase inhibitor 1A; CDKN1B, cyclin-dependent kinase inhibitor 1B; IGF, insulin-like growth factor; IGFBP, insulin-like growth factor binding protein; IRS1-4, IRS; PTEN, phosphatase and tensin homolog deleted on chromosome 10; PDK1, phosphoinositide-dependent kinase 1; PKB, protein kinase B also named AKT; FOXO3A, forkhead box O3A; BIM, BCL2-like 11 (apoptosis facilitator); MAPK, MAP kinases; MEK, MAP kinase-mitogen activated protein kinase; ERK, MAP kinases Erk1 and 2; MKNK2, MAP kinase interacting serine/threonine kinase 2; MSI2, musashi homolog 2; RAS, RAF kinases; c-myc, oncogene; PRKCA, protein kinase Cα.
In a similar analysis of the PI3K-AKT pathway, the mRNA abundance in 2 FOXO3A deleted and 8 balanced leukemias suggested a gene dosage effect. Notably, an analysis of BIM, which is known to be down-regulated upon PI3K-AKT pathway activation40 (Figure 3F) showed significantly reduced mRNA abundance in 5 leukemias with deletions of an inhibitor (PTEN) and gains of activators (IGF2, IGFL4, MKNK2, AKT1) when compared with 19 samples without detectable PI3K-AKT pathway genomic alterations (supplemental Figure 1D; P = .002). These findings indicate that an inhibition of TGF-β and an activation of PI3K-AKT signaling play an important role in the biology of T-ALL.
Deletion at 6q15-16.1 is associated with poor treatment response
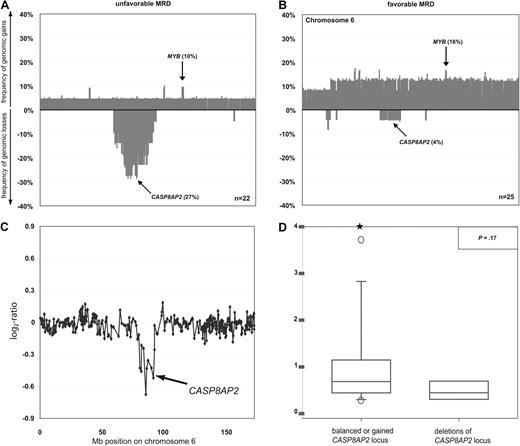
We next aimed to identify specific genomic aberrations that could serve as predictors for treatment response. It is well established that MRD kinetics correlate with long-term outcome.8,9 We thus stratified the 47 of 73 patients in whom MRD data were available into those with a favorable (< 10−4 positive cells) and an unfavorable (≥ 10−4 positive cells) response on day 78 of treatment (Table 1). MRD at this time point in the course of treatment has been shown previously to predict with a high degree of accuracy the long-term outcome of T-ALL in children and adolescents.2,7 The common deletions of regions 9q21.3, including CDKN2A and CDKN2B genes, and 12p13.2, including the CDKN1B locus, or of the other genes linked to the TGF-β and PI3K-AKT pathways occurred in comparable frequency in the favorable and the unfavorable groups and thus did not appear to be of prognostic value. By contrast, deletions of chromosome 6q occurred significantly more commonly in the unfavorable MRD group (Figure 4A), whereas chromosome 6 gains were enriched in the favorable group (Figure 4B). By specifying minimally overlapping regions of deletions in patients with unfavorable MRD, we fine-mapped 2 commonly deleted regions at 6q14.1-14.3 (27%) and 6q15-16.1 (27%), with a size of 7.42 and 2.54 Mb, respectively. Both deletions were equally associated with unfavorable MRD (P = .04). Univariate application of Firth penalized-likelihood logistic regression confirmed the prognostic value of these deletions (P = .03). In multivariate analyses including variables known to be most strongly associated with early treatment response (cortical T-cell immunophenotype, NOTCH1 mutational status), deletion at chromosomal bands 6q14.1v14.3 and 6q15-16.1 showed a strong trend to be an independent predictor of early treatment response (P = .06; Table 5).
DNA copy-number changes and mRNA expression of the CASP8AP2 gene in T-ALL. Frequencies of DNA copy-number imbalances on chromosome 6 in leukemias with favorable (A) and unfavorable (B) MRD kinetics. Clones are plotted in chromosome order. Representative array-CGH profile of chromosome 6 from a T-ALL with deletion of CASP8AP2 (C). Aberrations are indicated by arrows. All data points are shown as log2-ratios comparing leukemia DNA with a pool of normal blood DNA from 10 donors. Expression of CASP8AP2 transcripts as assessed by quantitative RT-PCR in primary T-ALL with balanced (n = 48; left box plot) and deleted chromosome band 6q15-16.1 (n = 6; right box plot). Stars indicate measurement outliers beyond the 5th and 95th percentile (D).
DNA copy-number changes and mRNA expression of the CASP8AP2 gene in T-ALL. Frequencies of DNA copy-number imbalances on chromosome 6 in leukemias with favorable (A) and unfavorable (B) MRD kinetics. Clones are plotted in chromosome order. Representative array-CGH profile of chromosome 6 from a T-ALL with deletion of CASP8AP2 (C). Aberrations are indicated by arrows. All data points are shown as log2-ratios comparing leukemia DNA with a pool of normal blood DNA from 10 donors. Expression of CASP8AP2 transcripts as assessed by quantitative RT-PCR in primary T-ALL with balanced (n = 48; left box plot) and deleted chromosome band 6q15-16.1 (n = 6; right box plot). Stars indicate measurement outliers beyond the 5th and 95th percentile (D).
We next compared the results obtained by mRNA expression profiling of samples from patients with (n = 5) or without (n = 32) deletions at 6q14.1-14.3 and 6q15-16.1 in order to identify the functional target gene of this deletion. This analysis revealed that CASP8AP2 mRNA expression was the single most down-regulated gene of all 7 genes located in the deleted region at 6q15-16.1 (supplemental Table 4). Based on this strong gene dosage effect of CASP8AP2 and its reported role as a predictor of persistent MRD,11 we focused on 6q15-16.1 deletions for subsequent analyses. Therefore, we analyzed the abundance of CASP8AP2 mRNA by quantitative RT-PCR in a subset of 54 patients from whom mRNA of sufficient quality for quantitative RT-PCR was available. Six of these 54 leukemias carried deletions at 6q15-16.1 (Figure 4C) and showed a down-regulation of CASP8AP2 mRNA compared with patients with balanced DNA copy-number status (n = 48; Figure 4D; P = .17). These data indicate that (1) 6q15-16.1 deletions represent a potential risk factor for poor treatment response in T-ALL and (2) that the reduction of the expression of CASP8AP2 represents the likely functional link between this deletion and less efficient induction of apoptosis by chemotherapy.
Discussion
This high-resolution array-CGH analysis of pediatric and adolescent T-ALL demonstrates that genomic alterations are common in this entity affecting 70 of 73 patients. In comparison to a previously reported array-CGH study, the frequency of aberrations found here is approximately twice as high, which can probably be explained by the high technical resolution of the study reported here.41 Next, our array-CGH results were compared with single nucleotide polymorphism (SNP) analyses previously performed in T-ALL. While our method is based on the analysis of normalized intensities between a control and the leukemic samples, SNP analysis uses a combination of 2 genotyping parameters: a normalized intensity measurement and an allelic ratio. When comparing our data to previously published SNP analyses investigating sets of 50 or 7 T-ALL samples, respectively,42,43 we find that frequencies of the most common genomic alterations identified by all 3 studies were largely similar. However, the analysis presented here documents a large number of additional alterations with likely functional significance (Tables 2,Table 3–4). Intriguingly, when comparing the minimally overlapping regions reported here to results from an array-CGH study using the identical profiling platform to analyze 50 childhood precursor B-cell ALL (pre–B-ALL) samples,44 only 2 DNA copy-number alterations, namely deletions of 9p21.2 and 12p13.2, were identified in both T-ALL and pre-B-ALL. This finding indicates that these deletions harboring the tumor suppressor genes CDKN2A/B and CDKN1B could be functionally important in both types of leukemia. Deletions or mutations of these tumor suppressor genes have been reported in a multitude of malignant tumors. Under physiological circumstances, they arrest normal diploid cells late in G145 and maintain quiescent cells in G0,46 respectively. It is likely, therefore, that the overexpression of the D-cyclins, which is caused by the loss of CDKN2A/B or CDKN1B, plays a major role in T-cell leukemogenesis. However, based on the large number of genomic copy-number alterations that do not overlap between T-ALL and pre-B-ALL, we propose that pre-B-ALL and T-ALL require specific molecular alterations and involve distinct leukemogenic pathways. Specifically, alterations of 6q15-16.1 were not observed in any pre-B-ALL sample and thus appear to be a hallmark of T-ALL. However, down-regulation of CASP8AP2 mRNA expression by unknown mechanisms has been reported in pre-B-ALL patients with unfavorable MRD response,11 and future studies will be warranted to investigate the role of inactivating mutations or epigenetic silencing of CASP8AP2 in pre-B-ALL.
The first important novel finding reported here relates to the biological clustering of 9 of the 31 distinctive aberrant loci that could be specified by overlapping deleted or gained regions to the TGF-β and the PI3K-AKT signaling pathways. It is known that the TGF-β pathway acts in a tumor suppressing fashion in many human malignancies.47 Specifically, inactivation of the TGF-β pathway effector SMAD3 has been reported as a typical feature of pediatric T-ALL.48 The important role of the TGF-β pathway in counteracting T-ALL leukemogenesis is documented here by gains of 2 TGF-β pathway inhibitors and deletions of 5 TGF-β pathway activators in 9 of 73 and 18 of 73 patients, respectively (Figure 3 and Table 4).
Similarly, the PI3K-AKT pathway has previously been reported to be constitutively activated in some T-ALL.35 The data reported here demonstrate that aberrant up-regulation of the PI3K-AKT pathway by genomic gains of activators, occurring in 17 of 73 or genomic deletions of inhibitors, occurring in 9 of 73 patients is a common mechanism of T-ALL leukemogenesis (Figure 3 and Table 4). This finding is of particular interest, because of the previously reported addiction of PTEN-null T-ALL cells to PI3K-AKT activation, rendering these blasts independent of NOTCH signaling.35 Treatment efficacy with small molecule inhibitors of γ-secretase blocking NOTCH activation, may thus be limited in this particular subset of T-ALL.49,50
Interestingly, these pathway-specific alterations were not linked to prognostic subgroups. Genomic aberrations affecting genes of the PI3K-AKT and the TGF-β pathways overlapped in 8 of 73 patients. Thus, activation of PI3K-AKT, inactivation of TGF-β, or simultaneous deregulation of both pathways appear to potently promote leukemogenesis. In total, aberrations of the 2 pathways either separately or in combination affect the majority of pediatric and adolescent T-ALL (36/73).
The identification of 6q15-16.1 as a risk factor predicting an unfavorable MRD response represents the second important novel finding reported here. This may be clinically most significant, because persistent MRD on day 78 is the single most important clinical predictor for poor patient outcome,8,9 which contrasts with the favorable risk profile of patients with NOTCH1 activating mutations, who show an overall survival of greater than 90%.2 Therefore, the identification of 6q15-16.1 deletions and of the CASP8AP2 gene in particular may contribute to the definition of a molecularly defined high risk group. Patients with CASP8AP2 deletions show no association with poor prednisone response and only begin to show a trend toward unfavorable treatment response on day 33. Therefore, this alteration does not appear to interfere with the glucocorticoid-induced apoptosis as might have been expected from the known role of CASP8AP2 in glucocorticoid signaling.51 Rather, the deletion of CASP8AP2 appears to interfere with apoptotic pathway(s)52 that are targeted by the other drugs that are included in the induction phase of the BFM-ALL protocol. It is known that early treatment intensification in high-risk patients is more effective than escalating treatment later.4 Therefore, the identification of a refined molecular risk profile, including markers such as CASP8AP2 deletions and activating NOTCH1 mutations, which can be determined at the time of diagnosis may favorably complement existing strategies that aim to individualize treatment and may enable an early, potentially more effective intervention.
The online version of this article contains a data supplement.
The publication costs of this article were defrayed in part by page charge payment. Therefore, and solely to indicate this fact, this article is hereby marked “advertisement” in accordance with 18 USC section 1734.
Acknowledgments
We acknowledge all participants of the ALL-BFM 1995 and ALL-BFM 2000 studies. Stefanie Hofmann and Laura Puccio are acknowledged for excellent technical assistance.
This study was supported by National Genome Research Network (NGFN-2) grants 01GR0417 to B.R. and 01GS0444 to A.E.K. We also gratefully acknowledge the provision of funds by Tour der Hoffnung.
Authorship
Contribution: M.R. designed and performed research, analyzed data, and wrote the paper; S.P. designed research, analyzed data, and wrote the paper; C.K. performed research, analyzed data, and wrote the paper; G.T. analyzed data and contributed analytical tools; N.B., A.B., W.W., F.E., and M.Z. analyzed data; S.B. performed research and analyzed data; S.L. contributed vital new reagents; A.W. performed research; M.S. wrote the paper, is the clinical chair of the ALL- BFM 2000 study, and revised the paper; W.-D.L. and C.R.B. revised the paper; B.R. contributed analytical tools and designed the research; M.M. and A.E.K. designed the research and wrote the paper; and P.L. designed the research, contributed analytical tools, and wrote the paper.
Conflict-of-interest disclosure: The authors declare no competing financial interests.
Correspondence: Andreas E. Kulozik, Department of Pediatric Oncology, Hematology and Immunology, Children's Hospital, University of Heidelberg, Im Neuenheimer Feld 430, 69120 Heidelberg, Germany; e-mail: andreas.kulozik@med.uni-heidelberg.de.
References
Author notes
*M.R. and S.P. contributed equally to this work.
†P.L. and A.E.K. share senior authorship.


