Abstract
Abstract 1352
The Arkansas program has emphasized high hematopoietic progenitor cell (HPC) yields since its inception in 1989, in order to enable further high-dose therapy for relapse, rescue patients from hematopoietic compromise due to extensive cumulative genotoxic or novel agent dosing, and provide a fall-back option in the case MDS develops. Here we are examining the overall outcome data among 3888 patients undergoing HPC-supported therapy since 1989.
Patients were grouped according to whether they received front-line Total Therapy (TT) protocols (TT-P, n=1452), non-TT protocols for previously treated MM (non-TT-P, n= 1155) or non-protocol therapies (non-P, n=1281). Overall survival (OS) and event free survival (EFS) were measured from the 1st high-dose therapy (Tx-1) intervention and examined in the context of baseline variables present prior to Tx-1, the aforementioned 3 treatment groups, and intervals between successive Tx interventions.
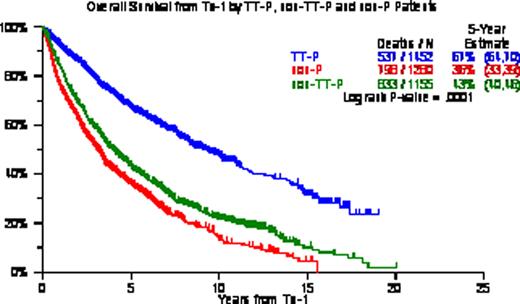
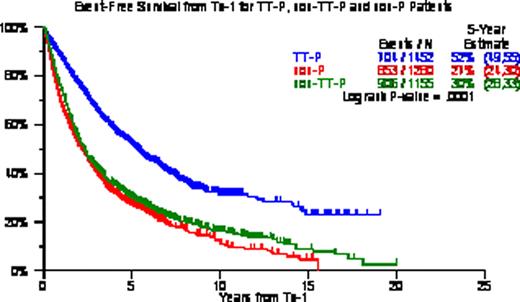
OS/EFS from Tx-1 was longest with TT-P (5-yr estimates, 67%/52%) followed by non-TT-P (5-yr estimates, 43%/30%) and non-P (5-yr estimates, 36%/27%) (p<0.0001, p<0.0001). Among all 3888 patients, 2773 (71%) received Tx-2 including 2385 (86%) within 6 months of Tx-1; 405 (10%) received Tx-3 including 140 (35%) within 2yr of Tx-2; 58 (1.5%) received Tx-4 including 44 (76%) within 2yr form Tx-3; 12 (0.3%) received Tx-5 all within 2yr from Tx-4; and 3 patients had Tx-6. When examined in the context of the 3 different treatment groups, 1157/1231 (94%) of the TT-P group had Tx-2 within 6mo, 51/169 (30%) had Tx-3 within 2yr of Tx-2, 51/169 (30%) had Tx-4 within 2yr of Tx-3, and 7/7 (100%) had a Tx-5 within 2 yr of Tx-4. Among 1155 non-TT-P patients, 646/822 (79%) had Tx-2 within 6mo of Tx-1, 37/129 (29%) had Tx-3 within 2yr of Tx-2, 14/18 (78%) had Tx-4 within 3yr of Tx-3, and all 4 (100%) receiving Tx-5 had done so within 2yr of Tx-4. Among 1281 non-P patients, 582/720 (81%) had received Tx-2 within 6mo of Tx-1, 52/107 (49%) had received Tx-3 within 2yr of Tx-2, 7/10 (70%) had received Tx-4 within 2yr of Tx-3, and 1 patient received Tx-5 within 2yr of Tx-4. KM plots from Tx-3 were similar among the 3 treatment groups with median OS of 16mo for TT-P, 14mo for non-TT-P and 11mo for non-P (p=0.13); median EFS were 7, 8, and 6 months (P=0.17). Timely application within 6mo resulted in superior OS and EFS from Tx-2 (OS: 79 v 23 months, EFS: 48 v 14 months; both P<0.0001). Multivariate Cox analyses examining post-Tx EFS and OS revealed TT-P superiority from Tx-1 and Tx-2 over non-TT-P and non-P; Tx-2 within 6mo of Tx-1 provided superior post-Tx-2 EFS and OS; while benefit from Tx-3 was not apparent until at least 2yr had elapsed since Tx-2. CA within 1 year of Tx-1 adversely affected EFS and OS from Tx-1, Tx-2 and Tx-3. Other adverse baseline parameters included low albumin for EFS and OS post-Tx-1; and B2M >=3.5mg/L for EFS and OS post-Tx-1 and post-Tx-2.
We confirm that front-line TT-P provides superior clinical outcomes in comparison with back-up/salvage non-TT-P and non-P Tx, emphasizing the benefit from planned upfront protocol therapy. Timely application of Tx-2 within 6 months of Tx-1 extended both EFS and OS from Tx-2, validating our concept of maximum tumor cyto-reduction and avoiding MM re-growth. Tx-3 was useful when applied beyond 2yr from Tx-2, in support of the notion that longer disease control prior to relapse favorably impacts subsequent salvage Tx.
Multivariate analysis of variables linked to OS
| OS from Tx-1 . | OS from Tx-2 . | OS from Tx-3 . | |||||||
|---|---|---|---|---|---|---|---|---|---|
| Variable . | n/N (%) . | HR (95% CI) . | P-value . | n/N (%) . | HR (95% CI) . | P-value . | n/N (%) . | HR (95% CI) . | P-value . |
| Age >= 65 yr | 854/3362(25%) | 1.25(1.12,1.39) | <.001 | NA | NA | NA | NA | NA | NA |
| Albumin < 3.5 g/dL | 1121/3362(33%) | 1.27(1.15,1.41) | <.001 | 684/2440(28%) | 1.18(1.04,1.35) | 0.011 | 79/354(22%) | 1.44(1.09,1.90) | 0.009 |
| B2M >= 3.5 mg/L | 940/3362(28%) | 1.48(1.33,1.64) | <.001 | 542/2440(22%) | 1.28(1.12,1.47) | <.001 | NA | NA | NA |
| CA(within 1 yr of tx1) | 1201/3362(36%) | 1.88(1.71,2.07) | <.001 | 842/2440(35%) | 1.84(1.63,2.07) | <.001 | NA | NA | NA |
| TT-P | 1365/3362(41%) | 0.55(0.49,0.62) | <.001 | 1160/2440(48%) | 0.60(0.52,0.69) | <.001 | NA | NA | NA |
| non-TT-P | 1069/3362(32%) | 1.20(1.07,1.34) | 0.002 | 628/2440(26%) | 1.28(1.10,1.48) | <.001 | NA | NA | NA |
| Tx-2/=<6mo | NA | NA | NA | 2136/2440(88%) | 0.52(0.45,0.61) | <.001 | NA | NA | NA |
| Tx-3/>2yr | NA | NA | NA | NA | NA | NA | 233/354(66%) | 0.52(0.41,0.67) | <.001 |
OS/EFS according to TT-P, non-TT-P and non-P
No relevant conflicts of interest to declare.
Author notes
Asterisk with author names denotes non-ASH members.


