Abstract
Abstract 1784
The outcome of MCL is unfavourable, with continuous relapses. The MIPI, a clinical score, defined performance status, age, LDH and leucocyte counts as predictors of MCL outcome. Ki-67 as cell proliferation index was evaluated in biological-MIPI (MIPI-b). Aim of the study was to tested MIPI on a retrospective group of MCL patients treated with Rituximab-chemotherapy with or without High Dose Chemotherapy and autologous stem cell transplantation (R-HDC); secondary endpoints were: to evaluate the feasibility of MIPI-b on a retrospective population and to quantify the predictive discrimination of IPI, MIPI, MIPI-b on the outcome of MCL in the Rituximab era.
Between 1999 and 2009, 206 MCL >18 years at diagnosis consecutively treated in seven Italian institutions were included into the study. Histology was centrally reviewed and, if possible, Ki-67 evaluation was performed. Overall survival (OS) and failure-free survival (FFS) curves were estimated both overall and stratified by MIPI, MIPI-b and IPI score. Differences between curves were tested using the 2-tailed log-rank test. In order to quantify the predictive discrimination of MIPI, MIPI-b and IPI scores, a Cox's model analysis and univariate logistic models (with death and failure event as binary outcomes) were fitted and the area under the receiver operating characteristic (ROC) curves (c-index) was estimated in a subgroup of 120 patients that fulfilled MIPI, MIPI-b and IPI scores.
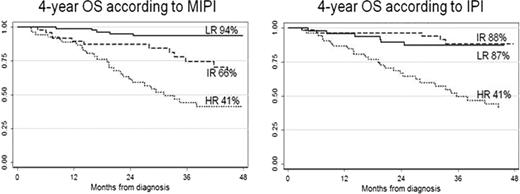
Clinical characteristics were: median age 61 (34-85) years, 78% stage IV, 73% with bone marrow involvement, 16% with blastoid variant; median leucocyte counts at diagnosis was 7.53×10³ (2.38-175). First-line treatments were: R-HDC in 51%, Rituximab-Fludarabine based chemotherapy in 12%, Rituximab-CHOP in 32% and other Rituximab containing regimens in 5%. Ki-67 evaluation was performed in 135 patients; median Ki-67 value was 30%. Patients at high-risk (HR) were 29% according to MIPI, 18% according to MIPI-b and 33% to IPI. With a median follow-up of 48 months, 4-year OS was 72% (95% CI:65-78) and 4-year FFS was 49% (95%CI: 41–56). Four-year OS according to MIPI by risk groups was: LR 94% (95%CI: 85–97), IR 66% (95%CI: 47–80), HR 41% (95%CI: 26–55) and according to IPI: LR 87% (95%CI: 73–94), IR 88% (95%CI: 74–95), HR 41% (95%CI: 26–55) (Figure 1). In the subgroup of 120 patients that fulfilled MIPI, MIPI-b and IP scores an univariate logistic model and a Cox's model analysis were fitted. The c-index and Cox-index for death event were 76% and 75% for MIPI, 69% and 69% for MIPIb, 76% and 71% for IPI respectively; the c-index and Cox-index for failure event were 61% and 68% for MIPI, 59% and 64% for MIPIb, 68% and 66% for IPI respectively. A sub-analysis was conducted to validate the role of MIPI in R-HDC group; an univariate logistic model and a Cox's model analysis were fitted and the c-index and Cox-index for death event and for failure event were calculated (Table 1).
MIPI score was confirmed as a good predictor of death event in MCL retrospective patients treated with Rituximab-chemotherapy regimens. MIPI score should be a good predictor of death event also in patients treated with R-HDC. The impact of MIPI-b score should be tested in prospective trials, with central histology review. New therapeutic strategies are warranted to improve the outcome of MCL namely in MIPI-HR group.
| C INDEX . | OS . | OS . | FFS . | FFS . | |
|---|---|---|---|---|---|
| R-HDC . | R-chemotherapy . | R-HDC . | R-chemotherapy . | ||
| MIPI | Logistic c-index | 71.2% | 76.4% | 63.1% | 58.5% |
| Cox index | 73.2% | 70.5% | 68.7% | 60% | |
| MIPI-b | Logistic c-index | 62.2% | 73.1% | 59.5% | 56.3% |
| Cox index | 66.8% | 70.7% | 64.5% | 61% | |
| IPI | Logistic c-index | 72.4% | 73.8% | 68.8% | 62.9% |
| Cox index | 71.7% | 63.3% | 66.7% | 60% | |
No relevant conflicts of interest to declare.
Author notes
Asterisk with author names denotes non-ASH members.


