Abstract
T-cell acute lymphoblastic leukemia (T-ALL) is associated with a significant risk of disease relapse, but the biological basis for relapse is poorly understood. Here, we identify leukemiainitiating cells (L-ICs) on the basis of functional assays and prospective isolation and report a role for L-ICs in T-ALL disease and relapse. Long-term proliferation in response to NOTCH1 activating signals in OP9-DL1 coculture system or capacity to initiate leukemia in xenografts by the CD7+CD1a− subset of primary T-ALL samples was superior to other subsets, refining the identity of T-ALL L-ICs. T-ALL engraftment was improved in nonobese diabetic/severe combined immunodeficiency (NOD/scid)IL2Rγnull (NSG) mice compared with NOD/scid with anti-CD122 treatment (NS122), but both showed changes in leukemia immunophenotype. Clonal analysis of xenografts using the TCRG locus revealed the presence of subclones of T-ALL L-ICs, some of which possess a selective growth advantage and correlated with the capacity of CD7+CD1a+ xenograft cells to engraft secondary NSG mice. Treatment of high-risk T-ALL xenografts eliminated CD1a+ T-ALL cells, but CD1a− cells were resistant and their number was increased. Our results establish that primary CD1a− T-ALL cells are functionally distinct from CD1a+ cells and that the CD7+CD1a− subset is enriched for L-IC activity that may be involved in mediating disease relapse after therapy.
Introduction
T-cell acute lymphoblastic leukemia (T-ALL) is characterized by the infiltration of immature lymphoblasts bearing T-cell lineage markers into the bone marrow (BM) and peripheral blood (PB). T-ALL accounts for 15% of childhood and 25% of adult acute lymphoblastic leukemias (ALLs)1 and clinical outcomes associated with T-ALL relapse are poor with a 5-year survival of less than 30%.2 One of the challenges in T-ALL treatment is addressing the problem of disease relapse, because there are no markers to reliably predict which patients will relapse at diagnosis, and relapsed patients have very few treatment options. Therefore, understanding the biological and molecular bases of T-ALL relapse can provide prognostic predictors to improve treatments and outcomes.
Cancer pathogenesis is complex, but one theory suggests that a subset of cancer cells with the ability to initiate cancer in xenografts or genetically engineered mouse models, termed cancer stem cells (CSCs), may be responsible for the initiation and propagation of many cancers. The CSC model suggests that a hierarchy of cells exists within a cancer that represents a caricature of the cellular hierarchies that exist for some normal tissues. CSCs possess self-renewal potential and form the apex of the cancer hierarchy to give rise to all of the cellular subsets comprising the cancer, making CSCs functionally distinct from other cancer cells.3 The CSC model of tumor biology also suggests that treatments eliminating bulk tumor cells without eradicating CSCs will result in relapse as CSCs reemerge.4 The role for CSCs in human acute myeloblastic leukemia (AML), brain, breast, colon, and other cancers has been reported5-10 and CSC resistance to conventional cytotoxic treatments contributes to tumor metastases and relapse.10-14 Collectively, these reports provide evidence for CSCs in cancer pathogenesis, treatment resistance, and disease relapse, and therapies need to be developed to ensure that CSCs are targeted.
The presence, identity, and function of CSCs in human cancers have been defined by biological assays that assess the cancer-initiating potential of prospectively purified cancer cell subsets. For T-ALL, there is still uncertainty in the immunophenotype of cell fractions that are capable of recapitulating the leukemia in leukemia-initiating cell (L-IC) assays. One group recently used 2 assays to characterize L-ICs for pediatric T-ALL.15 First, they showed that CD34+CD4− and CD34+CD7− T-ALL cells proliferated in suspension cultures in excess of other leukemia subsets. They found that the same subfractions possessed unique leukemia-initiating potential in nonobese diabetic/severe combined immunodeficiency (NOD/scid; NS) xenografts. However, others have reported on difficulties to reliably and reproducibly maintain or expand T-ALL subsets under similar in vitro conditions16-18 or even in xenografts,19,20 suggesting that assays used for the functional characterization of putative T-ALL L-ICs may play a critical role in defining their identity. Therefore, studies to identify L-ICs in human T-ALL will require the use of reliable functional assays that will more consistently measure L-IC potential.
In this report, we have developed functional assay systems to determine whether there is a CSC-basis for human T-ALL, and more importantly, whether CSCs are involved in T-ALL relapse. We used a stromal coculture assay and NOD/scidIL2Rγnull (NSG) xenograft model using intrafemoral injection to identify a subset enriched for T-ALL L-ICs. We show that the CD7+CD1a− subset from primary patient samples was uniquely responsive to proliferation signals in vitro and was able to initiate leukemia in xenografts. However, clonal selection in xenografts may contribute to expansion of the L-ICs, because CD7+CD1a+ cells from T-ALL xenografts can initiate T-ALL in secondary NSG recipients. Contrary to previously published results, CD34 was not a universal marker for T-ALL L-ICs, although it was a reliable marker for some samples. Finally, we show that CD1a− cells were resistant to treatment for poor outcome T-ALL. Collectively, these results suggest that primary CD1a− T-ALL cells may be functionally distinct from other T-ALL cell subsets, whereby CD1a− L-ICs may possess unique biological and molecular properties that resist conventional treatment and for which novel and specific therapies will be required to prevent disease relapse.
Methods
Human T-ALL samples
Human T-ALL samples (supplemental Tables 1-2, available on the Blood Web site; see the Supplemental Materials link at the top of the online article) were obtained after informed consent in accordance with the Declaration of Helsinki and with approval from the University Health Network and the Hospital for Sick Children Research Ethics Board human experimentation committees. Leukemia cells were enriched by Ficoll-density gradient centrifugation and washed in media containing 10% fetal calf serum (FCS). Cells were frozen in FCS containing 10% dimethyl sulfoxide (DMSO) or α-minimum essential medium with 10% DMSO and 40% FCS. Frozen cells were thawed in X-Vivo medium (Biowhittaker) containing 50% calf serum (CS; HyClone) by slow thaw with gentle agitation and washed with phosphate-buffered saline (PBS) containing 5% CS. Before injection, leukemia cells were counted with trypan blue for dead cell exclusion and then resuspended in PBS.
Antibodies and flow cytometry
Antibodies (Abs) directed against the following human cell surface proteins were obtained from commercial sources: CD1a, CD3, CD4, CD5, CD7, CD8, CD10, CD19, CD33, CD34 (class I), CD38, CD45, CD45RA, T-cell receptor (TCR)αβ, TCRγδ, human leukocyte antigen (HLA)-DR and immunoglobulin M. The Abs were conjugated to the following fluorochromes: fluorescein isothiocyanate, phycoerythrin (PE), PC5, PC7, Alexa-Fluor 700, allophycocyanin, or Pacific Blue. Mouse immunoglobulin G1 with the above conjugates was used for isotype control. Anti-mouse CD45 Ab were fluorescein isothiocyanate– or PE-conjugated (Caltag Invitrogen). Flow cytometric analyses were performed on the FACSCalibur and LSRII (BD Biosciences). All analyses of leukemia cells were gated on human CD45+ cells as previously described21 using FlowJo software Version 9.0.1 (TreeStar). High-speed sorting of leukemic blasts was performed on the MoFlo cell sorter (Dako Cytomation) with yields greater than or equal to 90% purity for the selected markers.
Coculture with OP9 stromal cells
The murine stromal cell line, OP9, overexpressing murine Delta-like 1 (DL1) or green fluorescent protein (GFP)22 was provided by Dr J. C. Zuniga-Pflucker (Sunnybrook Research Institute). Stromal cells were cultured in α-minimum essential media containing 20% FCS, IL-7 (5 ng/mL) and Flt3L (5 ng/mL; Amgen) before seeding with T-ALL cells. Media and cytokines were refreshed every 2-3 days. Cocultured cells were counted with trypan blue for dead cell exclusion and analyzed by flow cytometry weekly.
Xenografts and statistical analysis
NOD/LtSz−.scidPrkc (NS) and NSG23 mice were housed in pathogen-free facility at University Health Network vivarium. Before cell transplantation, 8- to 10-week-old NS mice were injected with intraperitoneal anti-CD122 antibody24 and irradiated (350 cGy) using a 137Cs irradiator. NSG mice were pretreated with 200 cGy irradiation only. Cells were injected by intrafemoral or intravenous route. Mice were killed when they showed signs of illness or at 20 weeks after injection. For secondary and tertiary recipients, leukemia cells were harvested from xenografts with more than 90% leukemia engraftment. PB, BM, spleen, thymus, and lymph nodes (LNs) were harvested and processed separately for analysis. Cells were isolated using standard cell dissociation technique, washed, passed through 40-μm strainer, and then counted. Cells were resuspended in staining medium (SM; PBS plus 2% CS) and Ab, washed, and resuspended in SM with propidium iodide (Sigma-Aldrich) for dead cell exclusion. Threshold for engraftment was considered to be more than 2% human CD45+ cells isolated from the right femur (RF; for intrafemoral recipients) or BM (for intravenous recipients). Linear regression analysis was performed using Prism software Version 5 (GraphPad Software). Limiting dilution analysis (LDA) was completed by using L-Calc software Version 1.1 (StemSoft).
TCR clonality analysis
Detection of TCR gene rearrangement at the TCRG locus was performed as previously described25 using a commercial kit (Invivoscribe). Briefly, DNA isolated from leukemia and control cells were amplified according to manufacturer's guidelines and separated on 2% NuSieve 3:1 agarose/TBE gel (Lonza). The manufacturer-supplied control DNA was used to demonstrate monoclonal and polyclonal TCRG rearrangements. Negative control was performed using water in lieu of DNA template. Products were isolated and sequenced to confirm clonality. Sequence analysis of human TCRG V-J junctional region was performed using online IMGT software (http://www.imgt.org:80/IMGT_vquest/share/textes).
Treatment of T-ALL xenografts
Irradiated NSG mice were injected with 1-5 × 10⁵ T-ALL cells intrafemorally. The contralateral femur was aspirated 12 weeks after injection to confirm engraftment. Each recipient received either daily intraperitoneal injections of dexamethasone (DEX; Sigma-Aldrich) at 15 mg/kg or DMSO alone for 14 days. One cohort of xenografts remained as nontreated controls. Xenograft BM and spleen cells were recovered from recipients 7 days after treatment for analysis.
Results
T-ALL in vitro proliferation requires NOTCH1 activation
Multiple reports have concluded that NOTCH1 is a critical pathway in T-ALL pathogenesis, because NOTCH1-activating mutations have been found in human T-ALL,26 and NOTCH1-activating signals are thought to drive T-ALL cell proliferation in vitro.27 Therefore, we used a coculture assay, the OP9 stroma overexpressing the murine NOTCH1 ligand, Delta-like-1 (DL1),22 to provide proliferation signals to identify and functionally characterize L-IC activity in human adult and pediatric T-ALL.
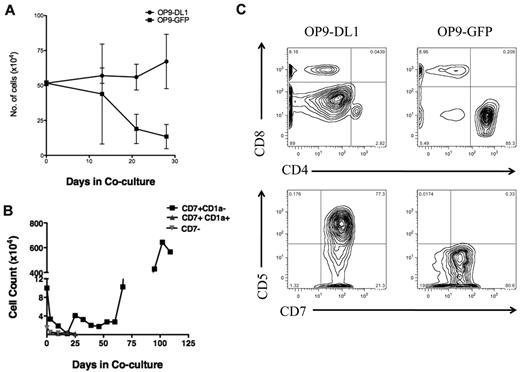
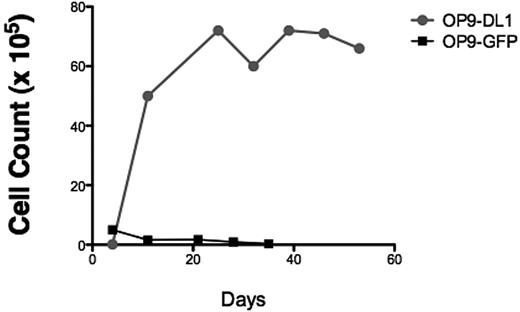
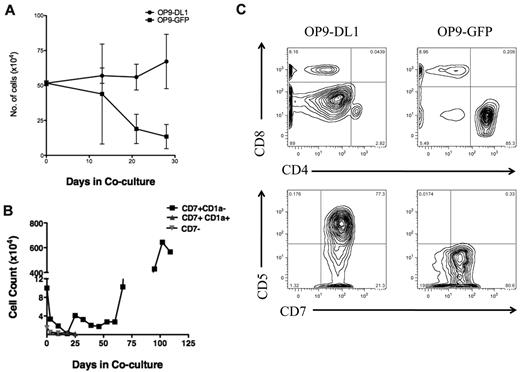
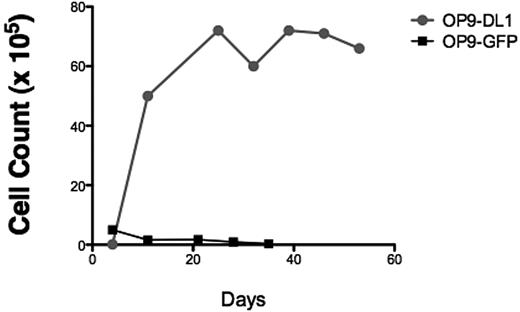
To verify that our T-ALL samples responded to NOTCH1 activating signals, bulk T-ALL lymphoblasts were added to the coculture system. We found that T-ALL cells expanded in response to sustained NOTCH1 activation (Figure 1A), but T-ALL cells cocultured on control OP9 stroma expressing GFP died rapidly (Figure 1A), showing that T-ALL cell survival and expansion were specific to the NOTCH1 pathway. Therefore, we concluded that the OP9-DL1 stroma was a simple and reliable in vitro assay to detect T-ALL cell proliferation capacity.
OP9 overexpressing the murine NOTCH1 ligand DL1 drives bulk and T-ALL L-IC proliferation. (A) To determine whether T-ALL cells proliferate in response to NOTCH1 activating signals, 5.5 × 10⁵ primary 7021 T-ALL cells were added to coculture on OP9-DL1 or OP9-GFP. Cocultures were performed in triplicates. Cells were counted weekly with graph showing the mean cell counts plus or minus the standard error. Cocultured cells were analyzed by flow cytometry weekly to evaluate immunophenotype to confirm leukemia cell expansion. OP9 coculture showed progressive expansion of bulk leukemia cells in coculture with OP9-DL1 but not with OP9-GFP. (B) Sorted 7021 T-ALL cells were added to OP9-DL1 stroma. CD7+CD1a− (1 × 10⁵), CD7+CD1a+ (4 × 10⁴), and CD7− (4 × 10⁴) cells were cocultured, and cells were counted weekly. (C) To confirm that cells remaining after 28 days of OP9-DL1 coculture were T-ALL cells, flow cytometric analysis was performed. The figure shows the results for T-ALL 0549 cocultured with OP9-DL1 (left column) and OP9-GFP (right column). T-ALL 0549 is positive for CD7 and CD5 surface expression but negative for surface CD4 and CD8. Analysis of CD4/CD8 (upper panels) and CD7/CD5 expression (lower panels) on cocultured cells revealed that T-ALL 0549 CD7+CD5+CD4−CD8− cells persisted after 28 days of OP9-DL1 coculture (left panels) whereas almost no CD7+CD5+CD4−CD8− cells were found after 28 days of OP9-GFP coculture (right panels).
OP9 overexpressing the murine NOTCH1 ligand DL1 drives bulk and T-ALL L-IC proliferation. (A) To determine whether T-ALL cells proliferate in response to NOTCH1 activating signals, 5.5 × 10⁵ primary 7021 T-ALL cells were added to coculture on OP9-DL1 or OP9-GFP. Cocultures were performed in triplicates. Cells were counted weekly with graph showing the mean cell counts plus or minus the standard error. Cocultured cells were analyzed by flow cytometry weekly to evaluate immunophenotype to confirm leukemia cell expansion. OP9 coculture showed progressive expansion of bulk leukemia cells in coculture with OP9-DL1 but not with OP9-GFP. (B) Sorted 7021 T-ALL cells were added to OP9-DL1 stroma. CD7+CD1a− (1 × 10⁵), CD7+CD1a+ (4 × 10⁴), and CD7− (4 × 10⁴) cells were cocultured, and cells were counted weekly. (C) To confirm that cells remaining after 28 days of OP9-DL1 coculture were T-ALL cells, flow cytometric analysis was performed. The figure shows the results for T-ALL 0549 cocultured with OP9-DL1 (left column) and OP9-GFP (right column). T-ALL 0549 is positive for CD7 and CD5 surface expression but negative for surface CD4 and CD8. Analysis of CD4/CD8 (upper panels) and CD7/CD5 expression (lower panels) on cocultured cells revealed that T-ALL 0549 CD7+CD5+CD4−CD8− cells persisted after 28 days of OP9-DL1 coculture (left panels) whereas almost no CD7+CD5+CD4−CD8− cells were found after 28 days of OP9-GFP coculture (right panels).
To refine the identity of L-ICs in human T-ALL, we sorted T-ALL cells based on cell surface expression of 2 T-cell precursor markers. Previously, CD7 had been used to distinguish T-ALL L-ICs.15 Expression of CD7 is up-regulated as BM progenitors migrate and enter the thymus.28 We chose CD1a as an additional marker to refine L-IC identity. CD1a expression correlates with distinct stages of thymocyte development, with the most immature thymocytes being CD34+CD1a−. Thymocytes up-regulate CD1a surface expression and lose CD34 expression as they mature into CD4+CD8+ (or double-positive; DP) thymocytes. Later, thymocytes down-regulate CD1a expression to become mature single positive T cells.28 All of the T-ALL samples had high percentages of CD7+ cells, but the percentages of CD1a+ cells were variable (supplemental Table 2).
To investigate whether there is functional heterogeneity among subsets of human T-ALL cells, distinguished on the basis of CD7 and CD1a expression, in response to NOTCH1 activating signals, we performed flow cytometric-based cell sorting using CD7 and CD1a to subfractionate T-ALL cells before coculture with OP9-DL1. We found that CD7+CD1a− T-ALL subset expanded for more than 100 days in OP9-DL1 coculture, whereas CD7+CD1a+ and CD7− subsets decreased in cell numbers and viability (Figure 1B). These results confirm that activating signals through the NOTCH1 pathway drives T-ALL cell expansion. Importantly, the CD7+CD1a− T-ALL proliferated in response to those signals in contrast to other T-ALL subsets, suggesting that T-ALL subpopulations differ in their responsiveness to NOTCH1-mediated proliferation signals.
Purification of human T-ALL L-ICs assayed in NS xenograft models
As the only reliable means to functionally identify T-ALL L-IC involves the use of in vivo xenograft assays, we modified previous T-ALL NS xenograft models to improve the proportion of samples that can be engrafted.15,19,29 These include direct cell inoculation into the RF by intrafemoral injection and pretreatment of NS recipients with anti-CD122 antibody to deplete natural killer cells (termed NS122).24 Because only low levels of T-ALL engraftment are detected at 8 weeks,15,20,30 NS122 recipients were checked for engraftment 20 weeks after injection.
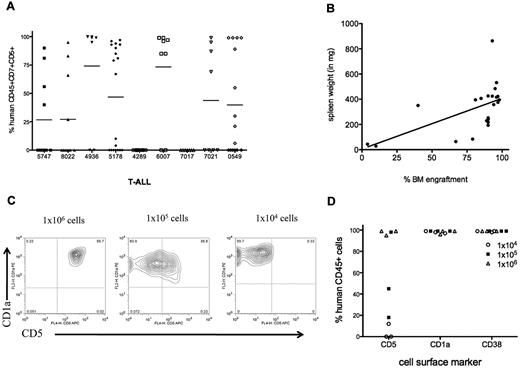
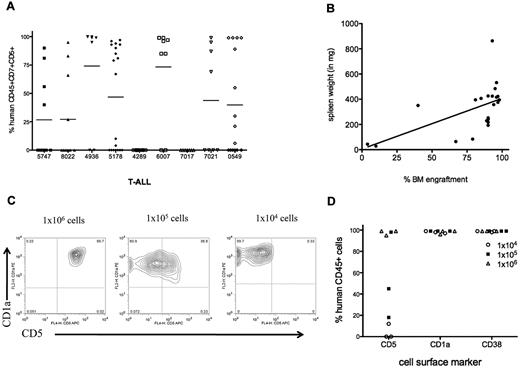
T-ALL samples (6 of 9) consistently engrafted in NS122 mice (Figure 2A) and LDA determined that the frequency of L-ICs averaged 1 L-IC in 4.2 × 10⁵ cells over a dose range from 1 × 10³ to 1 × 10⁷ cells (Table 1). T-ALL engraftment in NS122 mice was demonstrated in the PB, BM, spleen, and occasionally in the thymus and LNs. Furthermore, leukemia infiltration into the spleen correlated with the level of leukemia engraftment in the RF (Figure 2B).
T-ALL engraftment in NS122 recipients. (A) NS122 mice were injected intrafemorally with 1 × 10³ to 1 × 10⁷ T-ALL cells from 9 patient samples. Xenografts were assessed 20 weeks after injection by flow cytometry for the percentage of human CD45+CD7+CD5+ cells in the BM with each symbol representing one recipient. The bar represents the mean percentage for each T-ALL sample. (B) Spleens from engrafted NS122 xenografts were weighed. Graph depicts spleen weight (y-axis) with percentage of human CD45+CD7+CD5+ leukemia cells in the BM (x-axis) from engrafted recipients, with each dot representing one recipient. Linear regression analysis revealed correlation between level of RF engraftment and spleen weight (P = .0058). (C) BM cells from engrafted NS122 xenografts injected with 1 × 10⁴ (left panel), 1 × 10⁵ (middle panel), or 1 × 10⁶ (right panel) 5178 T-ALL cells were analyzed by flow cytometry. The figure represents results gated on human CD45+ cells that coexpress CD1a and CD5. (D) The percentages of CD45+ T-ALL cells coexpressing surface CD5, CD1a, and CD38 from NS122 recipients injected with 1 × 10⁴ to 1 × 10⁶ 5178 T-ALL cells are shown, with each dot representing one NS122 recipient.
T-ALL engraftment in NS122 recipients. (A) NS122 mice were injected intrafemorally with 1 × 10³ to 1 × 10⁷ T-ALL cells from 9 patient samples. Xenografts were assessed 20 weeks after injection by flow cytometry for the percentage of human CD45+CD7+CD5+ cells in the BM with each symbol representing one recipient. The bar represents the mean percentage for each T-ALL sample. (B) Spleens from engrafted NS122 xenografts were weighed. Graph depicts spleen weight (y-axis) with percentage of human CD45+CD7+CD5+ leukemia cells in the BM (x-axis) from engrafted recipients, with each dot representing one recipient. Linear regression analysis revealed correlation between level of RF engraftment and spleen weight (P = .0058). (C) BM cells from engrafted NS122 xenografts injected with 1 × 10⁴ (left panel), 1 × 10⁵ (middle panel), or 1 × 10⁶ (right panel) 5178 T-ALL cells were analyzed by flow cytometry. The figure represents results gated on human CD45+ cells that coexpress CD1a and CD5. (D) The percentages of CD45+ T-ALL cells coexpressing surface CD5, CD1a, and CD38 from NS122 recipients injected with 1 × 10⁴ to 1 × 10⁶ 5178 T-ALL cells are shown, with each dot representing one NS122 recipient.
One measure of stem cell function is self-renewal capacity as demonstrated by serial transplantation in xenografts. We found that secondary and tertiary NS122 recipients were successfully engrafted with leukemia cells, indicating long-term self-renewal potential of T-ALL L-ICs. We also found that T-ALL cells from xenografts injected intrafemorally and intravenously into secondary recipients had levels of engraftment at 12 weeks comparable with primary xenografts at 20 weeks (supplemental Table 3), suggesting acceleration of leukemia repopulation. Consistent with previous reports,27,30 the immunophenotype profiles for 6 T-ALL samples changed after NS122 engraftment. In 2 informative samples, the changes occurred in a dose-dependent fashion (Figure 2C-D) and were maintained in secondary recipients (supplemental Table 4). These results suggest that T-ALL may undergo changes to adapt to the xenograft environment. However, it is more likely that multiple subclones exist in the primary patient sample, with some clones possessing a competitive repopulation advantage and are selected in the NS122 xenografts.
Clonality analysis reveals selection of T-ALL clones in NS122 recipients
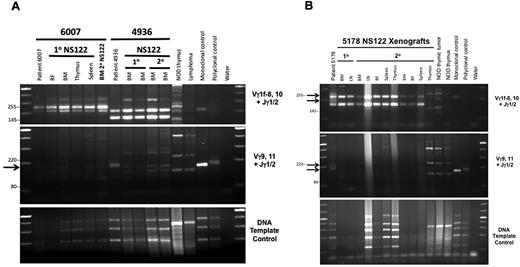
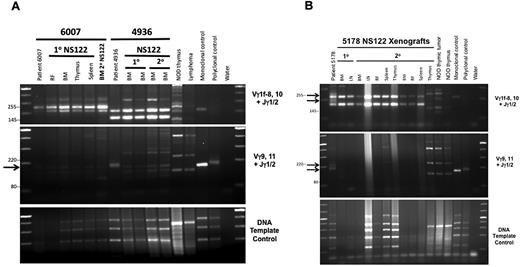
To determine whether the changes in leukemic growth and immunophenotype that occurred after serial transplant were caused by changes in clonal composition between the patient and xenograft cells, clonal analysis by TCRG gene rearrangement was performed. The 2 T-ALL samples that underwent phenotype change were compared with a T-ALL sample for which no immunophenotype changes were detected. Clonal analysis revealed that NS122 xenografts contained only a subset of the patient T-ALL clones (Figure 3), suggesting loss of some clonal subsets and proliferative advantage for other clones in xenografts. The same clones were maintained in primary and secondary NS122 xenografts, providing evidence that selected T-ALL clones repopulated the NS122 environment. Consistent with previous findings,27 we found no new clones in primary or secondary xenografts compared with the patient samples (supplemental Table 5). The clonal variation between leukemia cells from patient and xenograft may explain the immunophenotype changes, because clones with differing immunophenotype profiles engraft to become dominant clones in xenografts. Therefore, these results suggest that immunophenotype change in xenografts may result from the selection of clonal subsets from the human T-ALL.
Polymerase chain reaction (PCR)-based analyses of TCRG gene rearrangement reveal loss of patient T-ALL clones in NS122 xenografts associated with T-ALL immunophenotype change. (A) PCR analysis of TCRG gene rearrangement was performed on T-ALL 6007, which maintained the same immunophenotype in NS122 xenografts (lanes 2-7) and T-ALL 4936 (lanes 8-12), which exhibited immunophenotype change from less than 5% CD1a+ cells in the patient sample to more than 95% CD1a+ cells in xenografts. DNA from NOD thymus and NS endogenous lymphoid tumor (lymphoma) were used to detect amplified products from murine TCR rearrangement. Monoclonal and polyclonal DNA templates provided by the manufacturer and water were used as controls. The arrow indicates a Vγ9,11+Jγ1/2 PCR product found in the 4936 patient sample (lane 8) not found in primary (lanes 9-10) or secondary (lanes 11-12) NS122 xenografts. RF, right femur; BM, bone marrow. (B) T-ALL 5178 patient sample had 5% CD5+ cells but some NS122 xenografts had more than 90% CD5+ cells. PCR analysis of TCRG rearrangement was performed on the patient sample (lane 2), 1 primary (lanes 3-4), and 2 secondary (lanes 5-13) NS122 xenografts that had greater than 90% CD5+ cells. The arrows indicate Vγ1f-8,10+Jγ1/2 and Vγ9,11+Jγ1/2 PCR products found in the patient T-ALL sample not found in the primary and secondary NS122 xenografts. RF, right femur; BM, bone marrow; LN, lymph node.
Polymerase chain reaction (PCR)-based analyses of TCRG gene rearrangement reveal loss of patient T-ALL clones in NS122 xenografts associated with T-ALL immunophenotype change. (A) PCR analysis of TCRG gene rearrangement was performed on T-ALL 6007, which maintained the same immunophenotype in NS122 xenografts (lanes 2-7) and T-ALL 4936 (lanes 8-12), which exhibited immunophenotype change from less than 5% CD1a+ cells in the patient sample to more than 95% CD1a+ cells in xenografts. DNA from NOD thymus and NS endogenous lymphoid tumor (lymphoma) were used to detect amplified products from murine TCR rearrangement. Monoclonal and polyclonal DNA templates provided by the manufacturer and water were used as controls. The arrow indicates a Vγ9,11+Jγ1/2 PCR product found in the 4936 patient sample (lane 8) not found in primary (lanes 9-10) or secondary (lanes 11-12) NS122 xenografts. RF, right femur; BM, bone marrow. (B) T-ALL 5178 patient sample had 5% CD5+ cells but some NS122 xenografts had more than 90% CD5+ cells. PCR analysis of TCRG rearrangement was performed on the patient sample (lane 2), 1 primary (lanes 3-4), and 2 secondary (lanes 5-13) NS122 xenografts that had greater than 90% CD5+ cells. The arrows indicate Vγ1f-8,10+Jγ1/2 and Vγ9,11+Jγ1/2 PCR products found in the patient T-ALL sample not found in the primary and secondary NS122 xenografts. RF, right femur; BM, bone marrow; LN, lymph node.
L-ICs in T-ALL are in the CD7+CD1a− subset
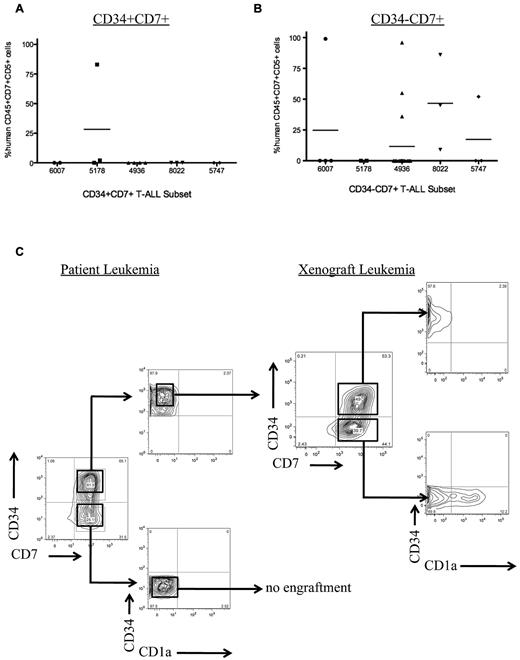
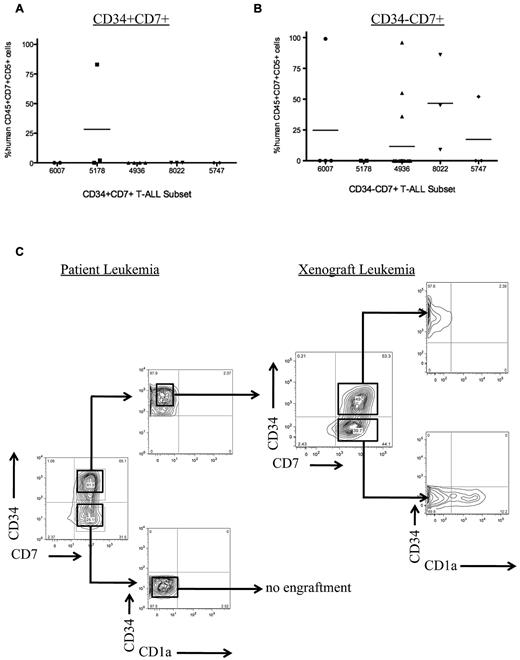
CD34 has been reported to be a marker for L-ICs in human AML,31 B-ALL,32 and pediatric T-ALL xenografts.15 To determine whether CD34 is a marker for L-ICs in adult T-ALL, we sorted T-ALL from 5 adult patients into subsets based on CD34 expression. We found that CD34 was not a universal marker for L-ICs in adult T-ALL (Table 2). In some patients, L-IC activity was found in the CD34+ subset, whereas in others only the CD34− subset possessed L-IC activity in NS122 xenografts (Figure 4A-B). Thus, in contrast to previously published results for pediatric T-ALL, our results indicate that CD34 can be used in some but not all samples to purify L-ICs.
Sorted T-ALL subsets engraft in NS122 xenografts. (A) Five primary T-ALL samples were sorted for CD34 and CD7 expression, then injected intrafemorally into NS122 recipients. Cell dose for each subset ranged from 3 × 10⁴ to 2.5 × 10⁶ cells with the cell dose determined previously by limiting dilution analysis. At least 2 recipients were injected for each T-ALL subset from each T-ALL sample. Engraftment was determined by flow cytometric analysis to detect human CD45+CD7+CD5+ cells in recipient RF. Each dot represents the percentage of human CD45+CD7+CD5+ cells from 1 recipient. The bar represents the mean percentage of CD45+CD7+CD5+ cells for each T-ALL sample. The CD34+CD7+ subset from 1 of 5 T-ALL samples engrafted in NS122 mice. (B) The CD34−CD7+ subset from 4 of 5 T-ALL samples engrafted in NS122 recipients. (C) T-ALL 0549 did not have any immunophenotype changes after engraftment in NS122 mice. Sorted CD34+CD7+CD1a− cells from T-ALL 0549 engrafted in NS122 recipients with both CD34+CD7+CD1a− and CD34−CD7+CD1a− cells, reconstituting the original immunophenotype of the patient T-ALL.
Sorted T-ALL subsets engraft in NS122 xenografts. (A) Five primary T-ALL samples were sorted for CD34 and CD7 expression, then injected intrafemorally into NS122 recipients. Cell dose for each subset ranged from 3 × 10⁴ to 2.5 × 10⁶ cells with the cell dose determined previously by limiting dilution analysis. At least 2 recipients were injected for each T-ALL subset from each T-ALL sample. Engraftment was determined by flow cytometric analysis to detect human CD45+CD7+CD5+ cells in recipient RF. Each dot represents the percentage of human CD45+CD7+CD5+ cells from 1 recipient. The bar represents the mean percentage of CD45+CD7+CD5+ cells for each T-ALL sample. The CD34+CD7+ subset from 1 of 5 T-ALL samples engrafted in NS122 mice. (B) The CD34−CD7+ subset from 4 of 5 T-ALL samples engrafted in NS122 recipients. (C) T-ALL 0549 did not have any immunophenotype changes after engraftment in NS122 mice. Sorted CD34+CD7+CD1a− cells from T-ALL 0549 engrafted in NS122 recipients with both CD34+CD7+CD1a− and CD34−CD7+CD1a− cells, reconstituting the original immunophenotype of the patient T-ALL.
To further refine the identity of L-ICs using xenograft assays, we sorted T-ALL from 3 adult patients based on CD34, CD7, and CD1a expression. Similar to the results in the OP9-DL1 cocultures, we found that only CD7+CD1a− leukemia cells engraft in NS122 recipients whereas CD7− or CD7+CD1a+ cells completely failed to engraft (Table 2). As previously shown, we found that CD34 expression did not always correlate with the T-ALL L-ICs, because the CD34+CD7+CD1a− subset engrafted for T-ALL samples 7017 and 0549, whereas only the CD34−CD7+CD1a− subset engrafted for T-ALL sample 7021 and the percentage of the engrafting subset varied widely between samples (Table 3). Of note, the L-IC subset recapitulated the original patient leukemia immunophenotype profile for those T-ALL samples that did not exhibit phenotype change in xenografts (Figure 4C), further demonstrating that the L-ICs can reconstitute the complete T-ALL. The prospective purification of functionally defined L-ICs within the CD7+CD1a− subset suggests that T-ALL is organized as a cellular hierarchy and follows a CSC model.
T-ALL engraftment and L-ICs in NSG mice
The NS xenograft model has been the standard functional assay for leukemia-initiating properties, but there are clear limitations to its use for the evaluation of the L-ICs for human T-ALL. Previous reports have shown that NS mice have limited capability to support the development and expansion of normal human T cells derived from hematopoietic stem cells (HSCs) or progenitor cells23 as well as T-ALL engraftment except at high cell doses.15,33 However, NS mice lacking the cytokine receptor common γ chain, or NSG, demonstrated improved efficiency and increased T-lineage derivation for human hematopoietic precursors23,34 and cancer xenografts35,36 compared with NS and NS122 recipients.37 In addition, NSG mice are less susceptible to endogenous lymphoma development after sublethal irradiation,23 suggesting that this may be a favorable xenograft host for long-term repopulation assays.
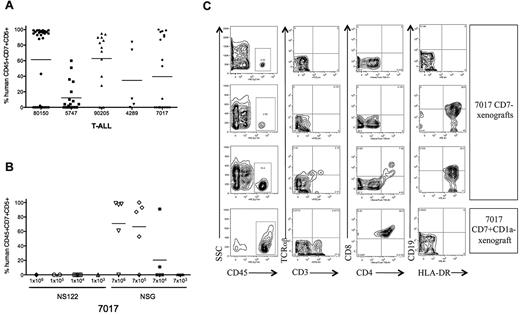
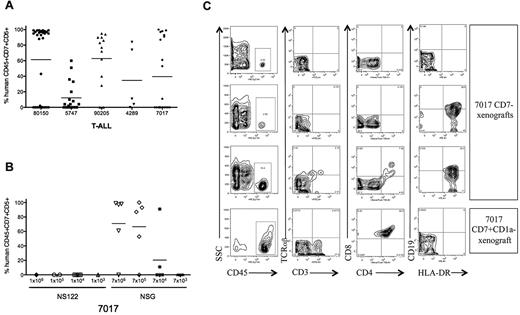
To determine whether human T-ALL cells engraft in NSG recipients, we transplanted T-ALL cells from 5 patients into irradiated NSG mice (Table 4 and Figure 5A). For T-ALL 7017 and 5747, NSG recipients were transplanted across a dose range that failed to engraft in NS122 mice (Figure 5B). We found that T-ALL engraftment was significantly improved in NSG compared with NS122 mice (supplemental Table 6), particularly at limiting doses, revealing that NSG may provide improved detection of L-IC activity than the NS122 xenograft model.
Improved T-ALL engraftment in NSG compared with NS122 recipients. (A) Irradiated NSG mice were injected intrafemorally with 1 × 10⁴ to 1 × 10⁷ T-ALL cells from 5 patients. RF cells from xenografts were analyzed by flow cytometry to determine engraftment and the percentage of human CD45+CD7+CD5+ cells. Each dot represents the percentage of CD45+CD7+CD5+ cells for each NSG recipient, with the bar representing the mean percentage for the T-ALL sample. (B) NS122 and NSG mice were injected intrafemorally with T-ALL 7017 at the cell doses indicated. RF cells from xenografts were analyzed by flow cytometry to determine engraftment and the percentage of human CD45+CD7+CD5+ cells. Each dot represents the percentage of human CD45+CD7+CD5+ cells for one recipient, with the bar representing the mean percentage for the cell dose. T-ALL 7017 did not engraft in NS122 mice but engrafted in NSG recipients. (C) T-ALL cells (7017) were sorted for CD7 and CD1a expression. Irradiated NSG mice were injected intrafemorally with 1 × 10⁵ to 2 × 10⁵ CD7−, CD7+CD1a−, or CD7+CD1a+ cells. Flow cytometric analyses of RF cells recovered from 3 NSG mice injected with 7017 T-ALL CD7− cells are shown in the top 3 rows, and one NSG recipient of 7017 CD7+CD1a− cells is shown in the bottom row. The panels show RF human CD45+ cells (left column) from xenografts coexpressing surface CD3 and TCRαβ (middle left column), CD4 and CD8 (middle right column), and HLA-DR and CD19 (right column). Human CD45+ cells in CD7− recipients did not express surface CD3, TCRαβ, CD4, or CD8, indicating that these are not mature T cells. Some cells expressed surface CD19 and HLA-DR (right column, second, and third panels), suggesting that these cells are derived from the B cell lineage. RF cells from engrafted CD7+CD1a− NSG recipient (bottom row) are CD4+CD8+ DP, consistent with the immunophenotype of the 7017 patient leukemia.
Improved T-ALL engraftment in NSG compared with NS122 recipients. (A) Irradiated NSG mice were injected intrafemorally with 1 × 10⁴ to 1 × 10⁷ T-ALL cells from 5 patients. RF cells from xenografts were analyzed by flow cytometry to determine engraftment and the percentage of human CD45+CD7+CD5+ cells. Each dot represents the percentage of CD45+CD7+CD5+ cells for each NSG recipient, with the bar representing the mean percentage for the T-ALL sample. (B) NS122 and NSG mice were injected intrafemorally with T-ALL 7017 at the cell doses indicated. RF cells from xenografts were analyzed by flow cytometry to determine engraftment and the percentage of human CD45+CD7+CD5+ cells. Each dot represents the percentage of human CD45+CD7+CD5+ cells for one recipient, with the bar representing the mean percentage for the cell dose. T-ALL 7017 did not engraft in NS122 mice but engrafted in NSG recipients. (C) T-ALL cells (7017) were sorted for CD7 and CD1a expression. Irradiated NSG mice were injected intrafemorally with 1 × 10⁵ to 2 × 10⁵ CD7−, CD7+CD1a−, or CD7+CD1a+ cells. Flow cytometric analyses of RF cells recovered from 3 NSG mice injected with 7017 T-ALL CD7− cells are shown in the top 3 rows, and one NSG recipient of 7017 CD7+CD1a− cells is shown in the bottom row. The panels show RF human CD45+ cells (left column) from xenografts coexpressing surface CD3 and TCRαβ (middle left column), CD4 and CD8 (middle right column), and HLA-DR and CD19 (right column). Human CD45+ cells in CD7− recipients did not express surface CD3, TCRαβ, CD4, or CD8, indicating that these are not mature T cells. Some cells expressed surface CD19 and HLA-DR (right column, second, and third panels), suggesting that these cells are derived from the B cell lineage. RF cells from engrafted CD7+CD1a− NSG recipient (bottom row) are CD4+CD8+ DP, consistent with the immunophenotype of the 7017 patient leukemia.
To determine whether the L-IC subset identified in NS122 xenografts is maintained in the NSG model, we transplanted sorted T-ALL cells from 5 patients into NSG recipients. As seen in NS122 recipients, transplanted CD7+CD1a− cells generated leukemia engraftment in NSG recipients (Table 2). However, the more immune-deficient NSG also yielded a small but detectable rate of T-ALL engraftment in 2 of 8 CD7+CD1a+ recipients, with both engrafted recipients coming from the same T-ALL patient sample. Therefore, the use of NSG strain provided improved T-ALL engraftment compared with NS122 mice and uncovered L-ICs within the CD7+CD1a+ subset in one T-ALL sample.
Human cell engraftment was also detected in the BM of NSG mice transplanted with CD7− cells, but detailed flow cytometric analysis indicated that the engrafted cells were nonleukemic cells (Figure 5C). The engrafted cells lacked surface expression of CD4, CD8, CD3, or TCRαβ, indicating that these cells were not mature T cells that were cotransferred and expanded in NSG mice after graft-versus-host response.38 The CD45+ cells in 2 CD7− NSG xenografts expressed HLA-DR with low CD19 expression, indicating that these human cells are derived from the B-cell lineage. The engraftment of normal hematopoietic lineages in the CD7− NSG xenografts is consistent with reports showing the superiority of the NSG strain for the engraftment of normal human HSCs compared with NS and NS122 mice.23,34
To determine whether the L-IC immunophenotype is maintained in long-term xenografts, leukemia cells from primary NS122 or NSG xenografts were resorted for CD7 and CD1a expression. We found both CD7+ CD1a− and CD7+CD1a+ leukemia cells recovered from xenografts resulted in engraftment in NSG mice (supplemental Table 7), suggesting that the CD7+CD1a+ subset from xenografts also have leukemia-initiating ability after selection in the NS122 environment. Therefore, the L-IC phenotype may change over time after competition and selection within the NS122 environment. Consistent with this result, CD7+CD1a+ leukemia cells from NS122 xenografts now proliferated in response to NOTCH1 activation in OP9-DL1 coculture (Figure 6) compared with the absence of expansion when sorted patient T-ALL cells were directly cocultured (Figure 1B). Collectively, these results provide evidence that T-ALL L-ICs may change either through adaptation to the xenograft environment or if subclones are present then by their selective outgrowth, particularly after engraftment in NS122 recipients.
T-ALL 5178 CD7+CD1a+ cells from NS122 xenograft proliferated in OP9-DL1 coculture. T-ALL 5178 cells recovered from the BM of engrafted NS122 recipients were sorted for the CD7+CD1a+ subset using flow cytometry-based cell sorting. 5 × 10⁴ Cells (5 × 10⁴) were placed into OP9-DL1 or OP9-GFP stroma for coculture. Cells were counted weekly with trypan blue for dead cell exclusion. CD7+CD1a+ cells from NS122 xenografts proliferated in excess of 50 days in OP9-DL1 coculture, but cell numbers declined rapidly in control OP9-GFP coculture.
T-ALL 5178 CD7+CD1a+ cells from NS122 xenograft proliferated in OP9-DL1 coculture. T-ALL 5178 cells recovered from the BM of engrafted NS122 recipients were sorted for the CD7+CD1a+ subset using flow cytometry-based cell sorting. 5 × 10⁴ Cells (5 × 10⁴) were placed into OP9-DL1 or OP9-GFP stroma for coculture. Cells were counted weekly with trypan blue for dead cell exclusion. CD7+CD1a+ cells from NS122 xenografts proliferated in excess of 50 days in OP9-DL1 coculture, but cell numbers declined rapidly in control OP9-GFP coculture.
CD1a− cells exhibit DEX resistance in vivo
It has been shown that treatment-resistant clones present at diagnosis mediate T-ALL relapse.39 Furthermore, reports suggest that CSCs exhibit treatment resistance.10-14 To determine whether CD7+CD1a− T-ALL cells are treatment-resistant, we injected NSG recipients with T-ALL cells from a diagnostic sample of a patient who later relapsed (sample 90205). Thus, we considered this sample to represent poor outcome T-ALL. We generated another cohort of xenografts transplanted with T-ALL cells of a patient without clinical relapse (sample 5178) to represent low-risk T-ALL. Both samples were associated with a high percentage of CD7+CD1a+ cells in the patient sample (supplemental Table 2) and in xenografts.
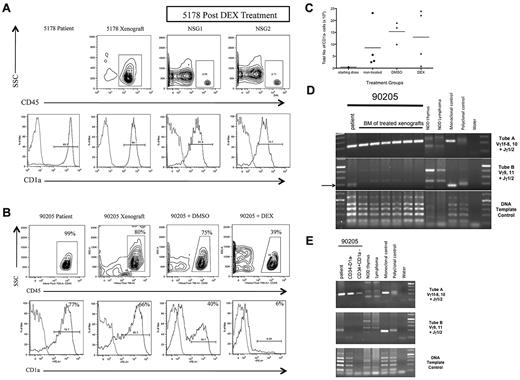
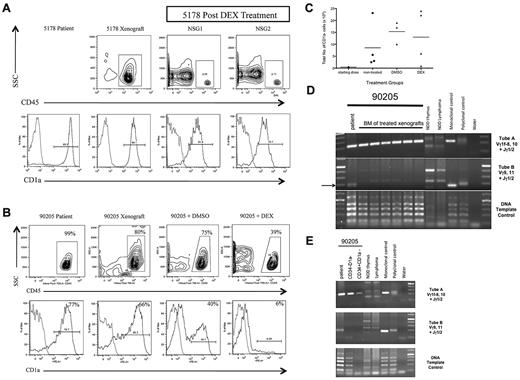
We treated both sets of xenografts with DEX, the primary induction chemotherapeutic drug. For T-ALL 5178, DEX treatment eliminated almost all leukemia cells (Figure 7A) and residual leukemic blasts showed only a slight increase in the percentage of CD1a− cells compared with the patient and nontreated xenograft T-ALL. In contrast, T-ALL 90205 xenografts still had significant leukemia burden after DEX treatment (Figure 7B). In addition, the residual leukemia cells were predominantly CD1a− cells, contrasting with the high percentage of CD1a+ cells seen in the patient T-ALL as well as untreated and DMSO-treated xenograft controls. The increase in percentage of CD1a− cells corresponded to an overall increase in the total number of CD1a− cells in the BM of untreated, DMSO-treated, and DEX-treated NSG xenografts compared with the initial number of CD1a− cells transplanted (Figure 7C). Clonal analysis revealed that the dominant clones detected in the DEX-treated xenografts (Figure 7D) corresponded to those found in sorted CD34−CD1a− and CD34+CD1a− subsets from the patient's leukemia (Figure 7E), providing evidence that the DEX-resistant clone was present in the patient leukemia at diagnosis. Together, these results suggest that CD1a− T-ALL cells from high-risk T-ALL are DEX-resistant. Furthermore, CD1a− cell persistence after treatment suggests that CD1a− L-ICs may be involved in mediating T-ALL treatment failure and disease relapse.
CD1a− T-ALL cells from poor outcome T-ALL are DEX-resistant. (A) T-ALL (5178) was a diagnostic sample from a patient who did not experience clinical relapse. NSG mice were injected intrafemorally with 5 × 10⁵ 5178 T-ALL cells in the RF. Engraftment was confirmed 12 weeks later by left femur BM aspirate showing more than 25% human CD45+ cells. NSG recipients were treated with DEX or DSMO vehicle daily for 14 days. Flow cytometric analysis of BM cells recovered 1 week after completion of treatment was performed. Panels show human CD45+ cells from xenografts (top row contour plots) coexpressing CD1a (bottom row histograms). Light gray outline in histograms represents isotype control, dark gray outline represents T-ALL sample stained with PE-conjugated anti-CD1a antibody. T-ALL 5178 engrafted well in NSG xenograft (top row, left panel) and DEX treatment resulted in elimination of most leukemia cells from treated NSG1 and NSG2 xenografts (top row, middle and right panels). The high percentage of CD1a− cells in the patient sample (bottom row, left panel) was maintained in nontreated (bottom row, middle left panel) and DEX-treated xenografts (bottom row, middle right and right panels). (B) T-ALL 90205 was a diagnostic sample from a patient who later relapsed. NSG mice were injected intrafemorally with 5 × 10⁵ T-ALL cells. Engraftment was confirmed 12 weeks later by left femur BM aspirate showing more than 25% human CD45+ cells. NSG xenografts were treated with DEX or DSMO vehicle daily for 14 days. The mice were killed 1 week after completion of treatment. Flow cytometric analysis of patient and xenograft BM cells recovered 1 week after treatment revealed CD45+ cells (top row contour plots) coexpressing CD1a (bottom row histograms). Light gray outline in histograms represents isotype control, dark gray outline represents T-ALL sample stained with PE-conjugated anti-CD1a antibody. The patient T-ALL had a high percentage of CD1a+ cells (bottom row, left panel) that was maintained in the NSG (bottom row, middle left panel) and DMSO-treated (bottom row, middle right panel) xenografts. The DEX-treated NSG xenograft showed a high percentage of residual leukemia cells (top row, right panel) that did not coexpress CD1a (bottom row, right panel). (C) Flow cytometric analysis was used to determine the percentage of CD1a− cells in patient T-ALL compared with nontreated, DMSO-treated, and DEX-treated NSG xenografts. This was multiplied by the total cell dose to determine the number of CD1a− cells injected into NSG recipients (starting dose) or the total BM cell counts to determine the absolute number of CD1a− cells in nontreated, DMSO-treated, and DEX-treated NSG xenografts. Each dot represents the total number of CD1a− cells from each xenograft, with the bar indicating the mean percentage for each treatment group. The number of CD1a− cells in the BM of DMSO- and DEX-treated xenografts increased compared with nontreated xenografts. (D) PCR-based analysis of TCRG gene rearrangements of patient 90205 T-ALL compared with DEX-treated T-ALL NSG xenografts. The arrow indicates Vγ9,11+Jγ1/2 PCR product found in the 90205 patient sample that was not found in the treated recipients. (E) PCR-based analysis of TCRG gene rearrangement of 90205 patient T-ALL compared with sorted 90 205 CD34−CD1a− and CD34+CD1a− subsets, revealing PCR products of identical size in the CD1a− subsets with the patient sample.
CD1a− T-ALL cells from poor outcome T-ALL are DEX-resistant. (A) T-ALL (5178) was a diagnostic sample from a patient who did not experience clinical relapse. NSG mice were injected intrafemorally with 5 × 10⁵ 5178 T-ALL cells in the RF. Engraftment was confirmed 12 weeks later by left femur BM aspirate showing more than 25% human CD45+ cells. NSG recipients were treated with DEX or DSMO vehicle daily for 14 days. Flow cytometric analysis of BM cells recovered 1 week after completion of treatment was performed. Panels show human CD45+ cells from xenografts (top row contour plots) coexpressing CD1a (bottom row histograms). Light gray outline in histograms represents isotype control, dark gray outline represents T-ALL sample stained with PE-conjugated anti-CD1a antibody. T-ALL 5178 engrafted well in NSG xenograft (top row, left panel) and DEX treatment resulted in elimination of most leukemia cells from treated NSG1 and NSG2 xenografts (top row, middle and right panels). The high percentage of CD1a− cells in the patient sample (bottom row, left panel) was maintained in nontreated (bottom row, middle left panel) and DEX-treated xenografts (bottom row, middle right and right panels). (B) T-ALL 90205 was a diagnostic sample from a patient who later relapsed. NSG mice were injected intrafemorally with 5 × 10⁵ T-ALL cells. Engraftment was confirmed 12 weeks later by left femur BM aspirate showing more than 25% human CD45+ cells. NSG xenografts were treated with DEX or DSMO vehicle daily for 14 days. The mice were killed 1 week after completion of treatment. Flow cytometric analysis of patient and xenograft BM cells recovered 1 week after treatment revealed CD45+ cells (top row contour plots) coexpressing CD1a (bottom row histograms). Light gray outline in histograms represents isotype control, dark gray outline represents T-ALL sample stained with PE-conjugated anti-CD1a antibody. The patient T-ALL had a high percentage of CD1a+ cells (bottom row, left panel) that was maintained in the NSG (bottom row, middle left panel) and DMSO-treated (bottom row, middle right panel) xenografts. The DEX-treated NSG xenograft showed a high percentage of residual leukemia cells (top row, right panel) that did not coexpress CD1a (bottom row, right panel). (C) Flow cytometric analysis was used to determine the percentage of CD1a− cells in patient T-ALL compared with nontreated, DMSO-treated, and DEX-treated NSG xenografts. This was multiplied by the total cell dose to determine the number of CD1a− cells injected into NSG recipients (starting dose) or the total BM cell counts to determine the absolute number of CD1a− cells in nontreated, DMSO-treated, and DEX-treated NSG xenografts. Each dot represents the total number of CD1a− cells from each xenograft, with the bar indicating the mean percentage for each treatment group. The number of CD1a− cells in the BM of DMSO- and DEX-treated xenografts increased compared with nontreated xenografts. (D) PCR-based analysis of TCRG gene rearrangements of patient 90205 T-ALL compared with DEX-treated T-ALL NSG xenografts. The arrow indicates Vγ9,11+Jγ1/2 PCR product found in the 90205 patient sample that was not found in the treated recipients. (E) PCR-based analysis of TCRG gene rearrangement of 90205 patient T-ALL compared with sorted 90 205 CD34−CD1a− and CD34+CD1a− subsets, revealing PCR products of identical size in the CD1a− subsets with the patient sample.
Discussion
We have shown that T-ALL L-ICs can be enriched on the basis of the CD7+CD1a− immunophenotype, suggesting that adult T-ALL is organized as a hierarchy that follows a CSC model. Future clonal studies are needed to establish that the L-ICs possess self-renewal to formally conclude that these are CSCs. The CD7+CD1a− leukemia cells exhibited exclusive capacity to proliferate after NOTCH1 activation in vitro and to initiate leukemia in NS122 and NSG xenografts. Clonal tracking also established that subclones of L-ICs must exist in T-ALL, and they exhibit differing levels of growth advantage when transplanted into xenografts. We also showed that CD7+CD1a− cells persisted after DEX treatment in high-risk T-ALL, providing further evidence that CD7+CD1a− L-ICs may represent a biologically distinct subset that contributes to T-ALL relapse. Identification of L-ICs in human T-ALL provides a potential mechanism for T-ALL relapse, in which L-ICs mediate relapse after treatments that induce remission but fail to target L-ICs.4
Notably, the absence of CD1a expression on T-ALL L-IC resembles the CD1a− (< 2% CD1a+) pediatric and adult T-ALL subtype associated with poor overall survival. Specifically, CD1a− T-ALL coexpressing primitive or myeloid markers strongly correlated with poor outcome for pediatric T-ALL because of the higher incidence of disease relapse, incomplete response to treatment associated with higher residual disease, and earlier development of drug resistance.40 For adult T-ALL, CD1a− T-ALL coexpressing CD13 correlated with a higher incidence of disease relapse and lower overall survival compared with CD1a+ disease independent of cytogenetic or karyotype status.41 Finally, patients with CD1a− T-ALL had lower leukemia-free survival compared with the CD1a+ subtypes.42 Collectively, the CD1a− phenotype may be one marker for a clinically distinct subset of T-ALL associated with poor outcomes for which nonconventional treatment protocols may be appropriate.
It was further reported that this CD1a− subtype in pediatric T-ALL not only shared a common immature phenotype but also a similar genetic signature with early T cell progenitors (ETP), the most primitive progenitors found in the thymus. This genetic correlation led to the speculation that CD1a− “ETP-T-ALL” may in fact originate from transformed ETP.40 This hypothesis may explain an important biological feature shared by ETP-T-ALL and ETP, namely glucocorticoid resistance, because DEX treatment efficiently depletes CD1a+ DP thymocytes without affecting the more immature CD34+CD1a− ETP.43 Given the DEX-resistance of ETP, CD1a− ETP-T-ALL, and the CD1a− L-ICs demonstrated in this report, we speculate that CD1a− L-ICs may also be derived from ETP. Further genetic interrogation of CD1a− L-ICs, as shown for ETP-T-ALL, will determine whether ETP represent the cell of origin for T-ALL L-ICs. Taken together, these data suggest that high-risk CD1a− T-ALL and CD1a− L-ICs may represent a distinct T-ALL subtype and subset, respectively, and additional studies are warranted to further define the molecular features of CD1a− L-ICs along with high-risk CD1a− T-ALL to determine whether they share a similar origin and basis for treatment resistance.
Although we showed that ETP-T-ALL and CD1a− T-ALL L-ICs share immunophenotype and DEX resistance features, there are also significant differences. First, only 3 of our T-ALL samples are CD1a− and the CD1a− L-ICs comprised only a minor subset of the T-ALL cells in the other 8 patient samples. Furthermore, the CD1a− subset that is enriched for T-ALL L-ICs did not coexpress primitive or myeloid markers, as has been shown for ETP-T-ALL and ETP with multilineage potential.44 Finally, the DEX-resistant T-ALL in our analysis was CD1a+ but it was the CD1a− T-ALL cells that persisted after treatment, suggesting that even for low-risk CD1a+ T-ALL, treatment resistance and functional markers of poor outcome may be linked to CD1a− L-ICs. It is important to note that these results provide evidence that correlation of immunophenotype markers of bulk leukemia cells with clinical relapse may be less informative than functional assays that detect differences in response to treatment among leukemia subsets. These results also highlight the utility of the NSG xenograft model in providing valuable treatment data that can be used to predict patient outcome for CD1a+ T-ALL.
Although the L-IC activity in primary human T-ALL was enriched in the CD7+CD1a− subset, CD7+CD1a+ T-ALL cells recovered from NS122 xenografts proliferated in response to NOTCH1 activation and engrafted in secondary NSG recipients. These results suggest that L-IC immunophenotype and function may not be a fixed relationship. This could be a result of dynamic changes in cell surface expression of L-IC markers that disrupt the link between biology and phenotype. Alternately, there could be selective outgrowth of distinct subclones in the murine environment where the genetic alterations they harbor result in a less rigid association between L-ICs and phenotypic markers. We have no evidence to support the former suggestion. However, our clonality data support the latter possibility. Thus, the acquisition of L-IC activity by the CD7+CD1a+ subset after engraftment may be a result of competitive selection of specific subclones in the T-ALL xenografts. Our observations that time to leukemia engraftment in secondary recipients is accelerated compared with primary xenografts and the equivalent engraftment efficiency after intravenous or intrafemoral transplant in secondary recipients support the concept of xenograft-selected outgrowth of human T-ALL clones. This observation also adds caution to the interpretation of L-IC activity, which is best determined by functional rather than immunophenotype features. Because clonal evolution is also thought to mediate ALL relapse,45 clonal changes during serial transplantation in xenografts may also provide valuable insights into the progression of human T-ALL and its contribution to T-ALL relapse.
It was reported that human T-ALL L-ICs exist in the CD34+CD4− and CD34+CD7− subsets using the NS model.15 These conflicting results may reflect technical differences in the pretreatment protocol, cell dose, and route of cell injection that may affect T-ALL engraftment. The pediatric T-ALL samples used in that report compared with the mostly adult T-ALL samples in our study may also account for this discrepancy, because there may be greater biological heterogeneity in adult T-ALL compared with pediatric T-ALL as indicated by treatment response.46 These differences highlight the heterogeneity of T-ALL and the need for continued refinement of in vitro and in vivo assays to functionally characterize T-ALL cells.
Our study provides insight into the limitations and relative merits of different xenograft models despite the relatively low number of T-ALL samples that were used. The percentage of NS122 mice engrafted with T-ALL was reduced compared with studies of human AML or B-ALL xenografts. It has been shown that NS mice supported normal B lymphoid and myeloid lineages from human HSCs but failed to produce robust T cell development.44,47 T cell development was improved by rendering NS mice more immunodeficient by the depletion of NK cells.48 These findings highlight limitations of the NS microenvironment in supporting immature T-cell progenitors and immature T-ALL cells. Aged NS mice are also prone to radiation-induced lymphoid tumors that can compete with and limit human leukemia engraftment49 especially for the 20-week period used for these studies. The use of more immunodeficient NSG mice improved multilineage engraftment including T cells from human HSCs23,34,37 and revealed new information on the frequency and phenotype of putative cancer-initiating subsets not previously demonstrated in the NS model.35,36 We found similar improvements in T-ALL engraftment by using the NSG strain. Additional studies using novel nonirradiated xenograft hosts may provide improved conditions to ensure consistent and reliable T-ALL engraftment to functionally assay L-IC activity.
It is possible that mechanisms other than a CSC-based hierarchy are responsible for the engraftment of CD7+CD1a− T-ALL cells over other T-ALL subsets in xenografts. One possibility is that the NS122 or NSG BM favored more “immature” CD1a− cells injected intrafemorally over more “mature” CD1a+ cells that may have engrafted in the thymus through intravenous or intrathymic injection. Evidence to support this theory include T-ALL proliferation in fetal thymic organ cultures 18 and the molecular changes observed between adult T-ALL and immature T-cell progenitors50 suggesting T-ALL progression in the thymus. However, the reconstitution of CD1a+ T-ALL by CD7+CD1a− L-ICs as well as the capacity for some CD7+CD1a+ cells to engraft T-ALL in NSG suggest that CD1a+ T-ALL cells can survive and expand within the xenograft BM. Additional studies with T-ALL sorted subsets in fetal thymic organ cultures or injected intrathymically and intravenously into NSG mice will be required to conclusively determine whether microenvironment limits T-ALL proliferation in vitro and engraftment in xenografts.
In summary, we have identified L-ICs in the CD7+CD1a− cell subset in primary human T-ALL using the NS122 and NSG xenograft models. Furthermore, CD1a− cells from high-risk T-ALL demonstrated drug resistance, providing further evidence that CD1a− T-ALL cells are biologically distinct. The model also revealed that L-IC immunophenotype evolves in xenografts, because CD7+CD1a+ cells had leukemia-initiating potential after selection in the xenograft. These results reveal the identity and complexity of L-ICs in human T-ALL. Further studies will be required to define the biological significance of L-ICs in the development of drug-resistant T-ALL.
The online version of this article contains a data supplement.
The publication costs of this article were defrayed in part by page charge payment. Therefore, and solely to indicate this fact, this article is hereby marked “advertisement” in accordance with 18 USC section 1734.
Acknowledgments
We extend our thanks to all members of the Dick laboratory who contributed their time, energy, and thoughtful input into these experiments and manuscript. Deep gratitude is extended particularly to Monica Doedens, Jean Wang, and Faiyaz Notta for their contributions to these studies and critical review of this manuscript. Our thanks to Drs Mark Minden and Johann Hitzler for the leukemia samples used in these studies. We also thank the members of the SickKids-UHN Flow Cytometry Facility and the Ontario Institute for Cancer Research (OICR)/Max Bell vivarium for their assistance with this work.
This work has been supported through grants from OICR (to J.E.D.), Leukemia Lymphoma Society grant (to J.E.D.), Canada Research Chair (to J.E.D.), and SickKids Research Institute (to P.P.L.C.).
Authorship
Contribution: P.P.L.C. wrote the manuscript and performed all experiments with technical assistance from H.J.; and J.E.D. conceived of the model for these studies, provided scientific input into experimental design, and contributed to the manuscript.
Conflict-of-interest disclosure: The authors declare no competing financial interests.
Correspondence: John E. Dick, Canada Research Chair in Stem Cell Biology, Toronto General Research Institute, University Health Network, Professor, Department of Molecular and Medical Genetics, University of Toronto, Office: Toronto Medical Discovery Tower, Rm 8-301, 101 College St, Toronto, ON, Canada M5G 1L7; e-mail: jdick@uhnres.utoronto.ca

