Abstract
Progression of hematologic malignancies is strongly dependent on bidirectional interactions between tumor cells and stromal cells. Expression of members of the matrix metalloproteinase (MMP) family by stromal cells is a central event during these interactions. However, although several studies have focused on the mechanisms responsible for induction of MMP in stromal cells, the signals that negatively regulate their secretion of in these cells remain largely unknown. Here, we provide evidence that MMP-9 production by stromal cells is suppressed through activation of early growth response protein 1 (EGR-1), thereby inhibiting the growth of thymic lymphoma. We found that EGR-1 expression is induced in stromal cells after contact with lymphoma cells via epidermal growth factor (EGF). Moreover, development of thymic lymphoma was inhibited when induced by lymphoma cells overexpressing EGF compared with control lymphoma cells. Using transgenic mice containing MMP-9 promoter-driven luciferase transgene in its genome, we further demonstrated that EGF/EGR-1 repressed transcriptional activation of the MMP-9 gene by stromal cells. De novo expression of EGR-1 alone by gene transfer or exposure to recombinant human EGF also inhibited MMP-9 expression. Taken together, these results indicate that EGR-1 could be a source of novel targets for therapeutic intervention in lymphoid tumors in which MMP-9 plays a critical role.
Introduction
Recent evidence has reinforced the notion that the tumor microenvironment plays a key role in the growth and survival of hematologic malignancies.1–3 In this tumor microenvironment, cancer cells are surrounded by numerous cell types including endothelial cells (ECs) of the blood and lymphatic circulation, stromal fibroblasts and a variety of bone marrow–derived cells.4 Stromal cells express a wide variety of chemokine and growth factor receptors, rendering them responsive to the local production of soluble mediators, most notably during close contact with lymphoma cells. Interactions of tumor cells with these stromal elements are believed to be critical in the initiation and progression of the oncologic process.5,6 For example, we have previously shown that close contact between lymphoma cells and ECs leads to the expression of several matrix metalloproteinases (MMPs), including MMP-9.7–9 Proteolytic remodeling of extracellular matrix in tumor progression by host-derived MMP-9 has also been observed both in vivo and in vitro in human and experimental models of cancers.10–14 While absence of MMP-9 does not prevent development of thymic lymphoma,15 abnormally high levels of MMP-9 has been shown to accelerate the growth of thymic lymphoma.14 However, while a large number of studies have focused on the molecular mechanisms that control the induction of MMPs in stromal cells,16–20 the nature of the signals that suppress MMP-9 secretion in peritumoral cells remains largely unknown.
The early growth response protein 1 (EGR-1) is a member of the immediate early gene family of transcription factors containing a DNA-binding domain consisting of 3 zinc fingers that regulates transcription through guanine-cystosine–rich, cis-acting promoter elements.21,22 EGR-1 controls the expression of a wide variety of genes, many of which play a pivotal role in the regulation of cell growth, differentiation, and apoptosis.23 However, although several studies have shown that EGR-1 promotes cancer progression23–25 there is increasing evidence that EGR-1 may also exert tumor suppression.26–30 In leukemia, for instance, EGR-1 has been implicated in the apoptosis of myeloma cells via its interaction with c-JUN while it behaves as a tumor suppressor against the oncogenes E2F-1 and c-MYC.31–33
In the present study, we found that EGR-1 gene expression is induced in stromal cells upon close contact with lymphoma cells, an effect that is mediated by the epidermal growth factor (EGF). Using in vivo and in vitro experimental models, we further found that de novo expression of EGR-1 induced by EGF inhibits the expression of MMP-9 and decreases the growth of thymic lymphoma.
Methods
Mice
Breeder pairs for the C57BL/6 mouse colony were purchased from The Jackson Laboratory. The proMMP9-Luc transgenic mice containing MMP-9 promoter-driven luciferase transgene in its genome were generated in the 129 background by standard microinjection techniques. Transgenic founders were identified by polymerase chain reaction (PCR) detection of luciferase gene from tail-clip DNA. The proMMP9-Luc transgenic lines were screened for constitutive luciferase expression after response to lipopolysaccharides (LPSs). All transgenic lines showed inducible luciferase activity in multiple organs after LPS treatment while injection with saline did not induce luciferase expression. The founder that had the highest LPS-induced luciferase expression was selected for further studies and backcrossed to the C57BL/6 strain for at least 5 generations to generate progeny for further experiments. All animals were housed in a specific pathogen-free environment in accordance with institutional guidelines for animal care. Experiments were performed in accordance with institutional guidelines and approved by the Institut National de la Recherche Scientifique institutional animal care and use committee.
Cell lines and reagents
The origin of the 267, 164T2, and 164T2S11 T lymphoma cell lines has previously been described.34 As a model to study lymphoma-EC interaction, we used the endothelioma cell line bEnd.3. In addition to expressing the von Willebrand factor, cells of this line express the same repertoire of adhesion molecules as those found on normal ECs, including ICAM-1, VCAM-1, E- and P-selectins, CD31, and ICAM-2. The bEnd.3 cells up-regulate the expression of cell adhesion molecules after stimulation with inflammatory cytokines such as interleukin-1 and tumor necrosis factor α (TNFα), with kinetics similar to those reported for primary ECs. The human Burkitt Raji B lymphoma, the human MDA-MB-231 breast carcinoma, and the HEK 293 cell line were obtained from ATCC. The MDA-MB-231 and 293 cell lines were maintained in culture in Dulbecco Modified Eagle Medium (DMEM) supplemented with 10% (vol/vol) fetal bovine serum (FBS), 2mM l-glutamine, 10mM 4-(2-hydroxyethyl)-1-piperazineethanesulfonic acid (HEPES) buffer. The B lymphoma and HT1080 cell lines were maintained in culture in RPMI 1640 and in DMEM, respectively, containing 2mM l-glutamine, 10mM HEPES buffer, 1mM sodium pyruvate, 0.075% (wt/vol) sodium bircabonate and supplemented with 10% (vol/vol) FBS. The T lymphoma and bEnd.3 cell lines were maintained in RPMI 1640 supplemented with 10% (vol/vol) FBS, 2mM l-glutamine, 10mM HEPES buffer and 55μM β-mercaptoethanol. All products were purchased from Life Technologies. Cell cultures were incubated at 37°C in a humidified 5% CO2 atmosphere. The monoclonal antibody (mAb) directed against human EGF receptor (EGF; clone LA1) was purchased from Millipore. Recombinant human EGF and TNFα were purchased from Prospec TechnoGene and Genzyme, respectively.
In vitro lymphoma–endothelial cell interactions
The bEnd.3 cells were seeded in 6- or 12-well plates (Corning) and incubated overnight at 37°C in a humidified 5% CO2 atmosphere until they reached approximately 80% confluence. Aliquots of 107 lymphoma cells resuspended in complete RPMI 1640 medium were then added to the layer of endothelial cells and the cocultures incubated for 12 hours at 37°C. Controls included ECs incubated without lymphoma cells. Lymphoma cells were removed from adherent cells using a warm solution of 0.004% trypsin–ethylenediaminetetraacetic acid (Life Technologies). The remaining adherent cells were then harvested using 0.05% trypsin–ethylenediaminetetraacetic acid and sorted on the Epics elite system (Beckman Coulter) based on size and granularity to discard the remaining lymphoma cells. The resulting bEnd.3 cell suspensions were immediately centrifuged and processed for RNA extraction and analysis by cDNA array.
Gene expression array
Total cellular RNA was extracted from bEnd.3 cells using a QIAGEN RNeasy minikit. The Atlas cDNA Expression Array (Atlas Mouse 1.2; Clontech Laboratories) was performed according to the manufacturer's instructions. Briefly, using 50 μg of DNase-digested total RNA, Poly(A)+RNA was transcribed with Moloney murine leukemia virus transcriptase in the presence of [α-33P]dATP and purified by column chromatography (NucleoSpin Extraction Spin column; Clontech Laboratories). Prehybridization was carried out in ExpressHyb solution (Clontech Laboratories) containing 0.5 mg/mL sheared salmon testes DNA (Sigma-Aldrich) in hybridization bottles. The membranes were then hybridized with [α-33P]–labeled first-strand cDNA probes (107 cpm of each probe sample) overnight at 68°C in a hybridization oven. The membranes were then washed extensively (three 20-minute washes in 2× saline-sodium citrate buffer at 68°C, 1% sodium dodecyl sulfate, followed by two 20-minute washes in 0.1× SSC/0.5% sodium dodecyl sulfate at 68°C and room temperature) and exposed to a PhosphorImager screen (Molecular Dynamics). The resulting hybridization signals were measured using a PhosphorImager SI (Molecular Dynamics). Arrays were analyszd using the ImageQuant 5.0 software (Molecular Dynamics). The gene expression in bEnd.3 cells after contact with thymocytes or lymphoma cells was compared with the corresponding bEnd.3 control population after normalization with housekeeping genes.
RNA isolation and semiquantitative RT-PCR
Total RNA was isolated from cells using Trizol reagent according to the manufacturer's instructions (Invitrogen Canada Inc). Two micrograms of total RNA were reverse-transcribed using the Omniscript reverse transcriptase (QIAGEN) and PCR-amplified using the following conditions: 94°C for 1 minute, 60°C for 1 minute, and 72°C for 1 minute, followed by a final extension step at 72°C for 10 minutes. The primers used for PCR amplification are: (5′-TAA TAG CAG CAG CAG CAG CAG C-3′) for sense murine EGR-1 and (5′-GTC GTT TGG CTG GGA TAA CTC G-3′) for antisense, (5′-GGT CAG TGG CCT AGT GAG C-3′) for sense human EGR-1 and (5′-TGC TGT CGT TGG ATG GCA C-3′) for antisense, (5′-AAG GTA CTC TCG CAG GGA AAT GG-3′) for sense human egf and (5′-ACA TAC TCT CTC TTG CCT TGA CC-3′) for antisense, (5′-CAA CAT CAC CTA TTG GAT CC-3′) for sense human mmp-9 and (5′-CGG GTG TAG AGT CTC TCG CT-3′) for antisense, (5′-GAT AAA CCC AAA AAC CCC ACC TA-3′) for sense human mt1-mmp and (5′-CCC TCC TCG TCC ACC TCA ATG-3′) for antisense, (5′-CGG AGT CAA CGG ATT TGG TCG TAT-3′) for sense gapdh and (5′-AGC CTT CTC CAT GGT GGT GAA GAC-3′) for antisense and (5′-CAT GGA TGA CGA TAT CGC TGC GC-3′) for sense β-actin and (5′-GCT GTC GCC ACG CTC GGT CAG GAT-3′) for antisense. Thirty-five cycles of amplification (25 cycles for gapdh and β-actin, RNA loading controls) were done in a thermal cycler (model PTC-100; MJ Research). The amplification for each gene was in the linear part of the curve. Amplified products were analyzed by electrophoresis on 1.5% agarose gels using Sybrsafe DNA staining (Invitrogen) and ultraviolet transillumination. Quantitative analysis was conducted using a computerized densitometric imager to obtain EGR-1 or mmp-9/gapdh ratios.
Cloning of EGR-1 promoter
A 1222-bp DNA fragment of the mouse EGR-1 promoter was isolated by PCR from the genomic DNA purified from bEnd.3 using the forward primers (5′-ACG GAG GGA ATA GCC TTT CG-3′) and the reverse primer (5′-CAT CCC GGA CCA GCG AGC TGG-3′). The amplicon was ligated into pCR4-TOPO vector (Invitrogen) and subcloned into the promoter-less firefly luciferase reporter vector pGL3-Basic to create pGL3-promoter-EGR-1-luciferase (Promega). For transduction analyses, the promoter-less pGL3-Basic vector was used as a negative control.
Transient transfections and luciferase assays
Transfections in 293 cells were performed using DNAfectine (ABM) according to the manufacturer's instructions. Briefly, 7.5 × 10⁴ cells/well (Corning 12-well plate) were seeded and cultured for 12 hours. At 80% confluence, cells were incubated with DNAfectine: DNA complexes containing 5 μL of DNAfectine, 0.1 μg of pGL3-EGR-1 promoter luciferase plasmid and 0.5 μg of a control plasmid, the pRL-TK Renilla luciferase (Promega), in DMEM. Five hours later, the transfection mixture was replaced by regular growth medium. The coculture assays were performed 24 hours after transfection. In some cases, adherent cells were preincubated with blockings mAbs (10 μg/mL) or isotypic control for 1 hour at 37°C and then washed with PBS to remove excess mAbs. For cocultures assays, the stable transfectants (3 × 10⁶ cells/well), the murine 267 T lymphoma cells (3 × 10⁶ cells/well), the human Burkitt RAJI B lymphoma cells (3 × 10⁶ cells/well), or the human MDA-MB-231 breast carcinoma cells (5 × 10⁵ cells/well) were added to the epithelial layers. Cells lysis and luciferase assays were performed after 16 hours of cocultures using the Dual-Luciferase Assay System (Promega) in a luminometer (Berthold Lumat LB 9507) and luciferase activity was normalized to the activity of the Renilla luciferase reporter gene to correct for transfection efficiency and the relative amount of luciferase activity in the untreated cells (ctrl) was designated as 1. In some experiments, 2 μg of pCMV6-XL5-EGR-1 (Origene) or of an empty control vector were transfected in HT1080 cells using DNAfectin according to the manufacturer's instructions.
Induction of primary thymic lymphoma
Five- to 6-week-old C57BL/6 mice (5-10 mice per group) were injected intrathymically in each thymic lobes with 5 × 10³ EGF-expressing or control lymphoma cells. Mice were then regularly observed for clinical signs of thymic lymphoma (runting, swelling of the thorax, and dyspnea), which only appear at the end stage of the disease and reveal imminent death owing to pulmonary compression by the oversized thymic tumor. When moribund, mice were killed, and the presence of thymic lymphoma was confirmed and the tumor collected at necropsy.
Ex vivo promoter MMP-9 activity analysis
Five- to 6-week-old C57BL/6/proMMP9-Luc transgenic mice (5-10 mice per group) were injected intrathymically in each thymic lobe with 5 × 10³ EGF-expressing or control lymphoma cells. At 7 days after injection, 150 mg/kg D-luciferin potassium salt (Regis Technologies) were injected intraperitoneally and 15 minutes later, mice were killed. Thymuses were collected and images acquired with a charge-coupled device camera from the Xenogen IVIS imaging system and analyzed with the IVIS Living Image 2.20.1 software. Thereafter, thymuses were crushed in Cell Culture Lysis Reagent (Promega) and luciferase assays were performed using the Luciferase Assay System (Promega).
Statistical analysis
Statistical significance was measured using a log rank test, and the level of significance was established at a P value of less than or equal to .05.
Results
Identification of differentially expressed genes in bEnd.3 ECs after contact with 164T2 T lymphoma cells
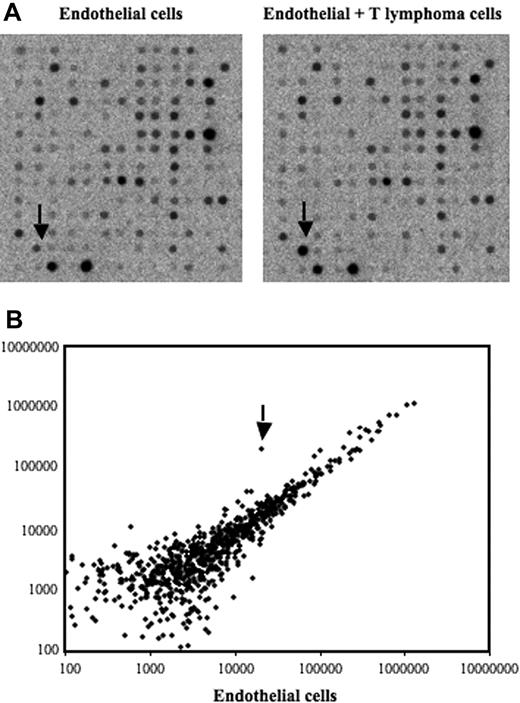
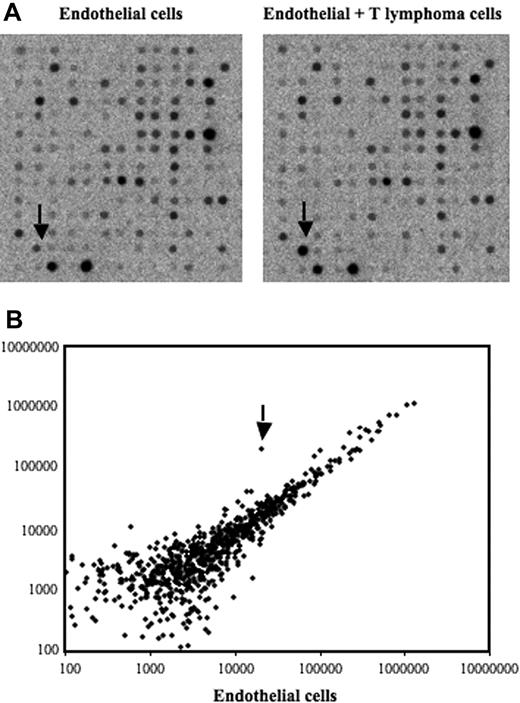
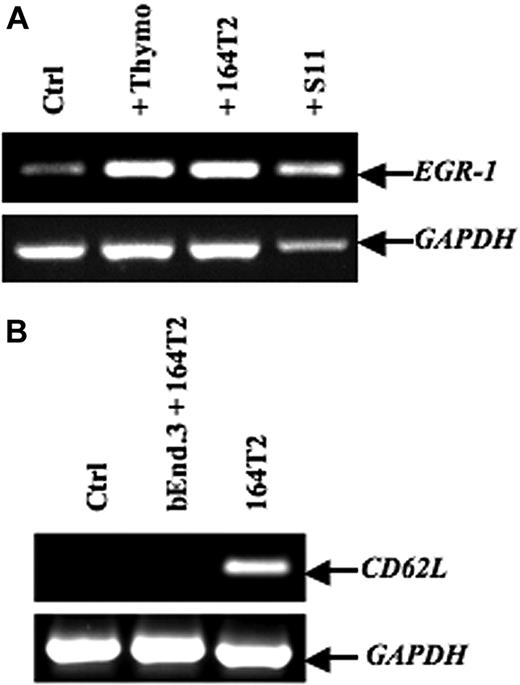
To screen for genes induced after contact between stromal cells and T lymphoma cells, we used an in vitro model in which the T lymphoma cells were cocultured with the bEnd.3 endothelial cell line. This endothelioma cell line has been used by many investigators as an in vitro model to study the ability of normal and transformed cells to interact with vascular endothelium.35–38 Our previously published data and preliminary experiments using this model had established that a 12-hour period of time was optimal to obtain a maximal induction of gene expression in ECs after contact with lymphoma cells.7–9 After contact, the lymphoma cells were removed, the ECs purified, and an expression array system was used to identify genes whose expression was modulated upon contact with lymphoma cells. Our results showed that while the percentage of genes that showed a relatively high change in their expression was rather limited (Table 1), contact between T lymphoma cells and ECs induced a strong up-regulation of EGR-1 (Figure 1A-B), a gene encoding a transcription factor implicated in the transcription of multiple genes within the endothelium.39 The induction of EGR-1 in ECs upon contact with T lymphoma cells was confirmed in independent experiments by reverse-transcribed–polymerase chain reaction (RT-PCR) analysis (Figure 2A). Expression of EGR-1 was also induced upon coculture with thymocytes, 164T2 and aggressive T lymphoma cells 164T2S19. The up-regulation of EGR-1 was not due to the presence of contaminating T lymphoma cells after endothelial cell isolation after contact since RT-PCR analysis failed to detect expression of L-selectin, a gene specifically expressed in T cells but not in ECs (Figure 2B).
Identification of differentially expressed genes in bEnd.3 endothelial cell line after contact with 164T2 T lymphoma cells. (A) Gene expression profiling was performed using RNA isolated from bEnd.3 endothelial cells (ECs) cultured alone (control, left panel) and bEnd.3 cells after contact with 164T2 T lymphoma cell line (right panel). (B) Scatter plot analysis of densitometric quantification of expression data. Each point represents 1 of the 1176 genes on the array and the location of each point on the scatter plot is determined by the gene expression level in bEnd.3 cells, represented on the x-axis, and the gene expression level in bEnd.3 cells after contact with lymphoma cells, represented in the y-axis. EGR-1 is indicated by the arrow.
Identification of differentially expressed genes in bEnd.3 endothelial cell line after contact with 164T2 T lymphoma cells. (A) Gene expression profiling was performed using RNA isolated from bEnd.3 endothelial cells (ECs) cultured alone (control, left panel) and bEnd.3 cells after contact with 164T2 T lymphoma cell line (right panel). (B) Scatter plot analysis of densitometric quantification of expression data. Each point represents 1 of the 1176 genes on the array and the location of each point on the scatter plot is determined by the gene expression level in bEnd.3 cells, represented on the x-axis, and the gene expression level in bEnd.3 cells after contact with lymphoma cells, represented in the y-axis. EGR-1 is indicated by the arrow.
EGR-1–induced expression in endothelial cell lines after contact with T lymphoma cells. (A) After in vitro contact with freshly isolated murine thymocytes, 164T2, or 164T2S11 T lymphoma cell lines, bEnd.3 cells were harvested and total RNA was extracted and then subjected to reverse-transcribed–polymerase chain reaction (RT-PCR) to quantify EGR-1 expression. (B) Expression of L-selectin in bEnd.3 cells after contact with 164T2 T lymphoma cells as a control of bEnd.3 purity after sorting. No expression of L-selectin was detected in bEnd.3 or after purification after coculture with T lymphoma cells. The 164T2 cells were used as a positive control for L-selectin expression. In both panels A and B, the control included bEnd.3 cells incubated without lymphoid cells in the same culture conditions and GAPDH expression was used as internal control. Bars represent SD; *P ≤ .05.
EGR-1–induced expression in endothelial cell lines after contact with T lymphoma cells. (A) After in vitro contact with freshly isolated murine thymocytes, 164T2, or 164T2S11 T lymphoma cell lines, bEnd.3 cells were harvested and total RNA was extracted and then subjected to reverse-transcribed–polymerase chain reaction (RT-PCR) to quantify EGR-1 expression. (B) Expression of L-selectin in bEnd.3 cells after contact with 164T2 T lymphoma cells as a control of bEnd.3 purity after sorting. No expression of L-selectin was detected in bEnd.3 or after purification after coculture with T lymphoma cells. The 164T2 cells were used as a positive control for L-selectin expression. In both panels A and B, the control included bEnd.3 cells incubated without lymphoid cells in the same culture conditions and GAPDH expression was used as internal control. Bars represent SD; *P ≤ .05.
EGF induces EGR-1 expression at the transcriptional level in EC
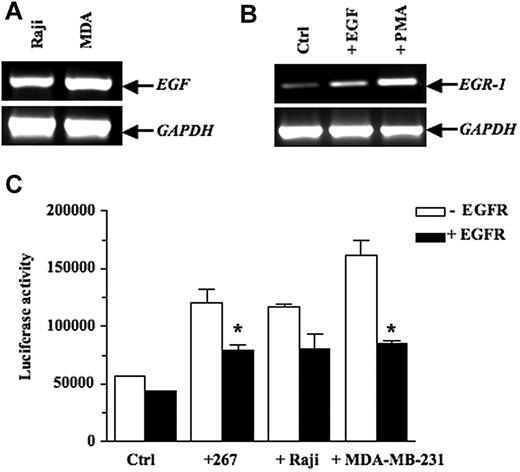
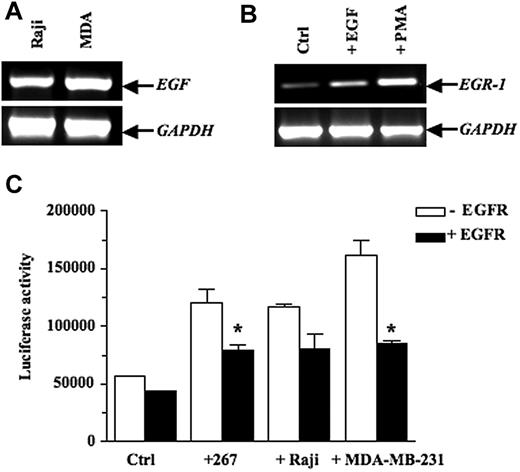
EGR-1 has been known to be highly inducible in several cell lines stimulated by a wide variety of cytokines and growth factors, most notably EGF.40–41 We thus examined mouse and human lymphoma cells for EGF expression and found that this growth factor was expressed constitutively in the human Raji B lymphoma cells (Figure 3A) and in murine T lymphoma lines, including 164T2 T lymphoma cells (see supplemental Figure 1, available on the Blood Web site; see the Supplemental Materials link at the top of the online article). Our experiments also showed that EGR-1 expression was up-regulated by EGF in bEnd.3 cells (Figure 3B). This ability of EGF to up-regulate EGR-1 was confirmed in 293 cells transfected with a reporter vector containing the EGR-1 promoter and treated with increasing doses of EGF (see supplemental Figure 2). Most importantly, cocultures between lymphoma and 293 cells conducted in presence or absence of blocking antibodies to epidermal growth factor (EGFR) confirmed the essential role of EGF secretion in inducing EGR-1 functional activity in stromal cells (Figure 3C). Similar results were obtained using the MDA-MB-231 cells, which also constitutively express EGF. The functional relationship between EGFR and EGR-1 expression was specific, as demonstrated by the inability of control mouse immunoglobulin G to block EGR-1 expression.
EGF activates transcription of EGR-1 expression in endothelial cell lines. (A) Constitutive expression of EGF in the human Burkitt Raji B lymphoma cells and the human MDA-MB-231 breast carcinoma cells, as shown by RT-PCR analysis. (B) bEnd.3 cells were treated with vehicle alone or 10 ng/mL epidermal growth factor (EGF) for 1 hour. Positive control consisted of bEnd.3 cells incubated with 50 ng/mL PMA for 1 hour. Total RNA was extracted and subjected to RT-PCR to quantify EGR-1 expression. (C) 293 cells were cotransfected with the pGL3-EGR-1 promoter construct and the pRL-TK Renilla luciferase as described in “Transient transfections and luciferase assays.” After 24 hours, the 293 cells were preincubated for 1 hour with blocking mAbs specific for epidermal growth factor (EGFR) or control mouse immunoglobulin G (IgG). Thereafter, the murine 267 T lymphoma cells (3 × 10⁶ cells/well), the human Burkitt Raji B lymphoma cells (3 × 10⁶ cells/well), and the human MDA-MB-231 breast carcinoma cells (5 × 10⁵ cells/well) were added to adherent cells for 16 hours. Cells were collected, and luciferase activity was measured. Controls included 293 cells without tumor cells. The firefly luciferase was normalized to Renilla luciferase activity. Results are representative of 3 independent experiments performed in triplicate. Bars indicate SD; *P ≤ .05, significantly different from the control mouse IgG treatment.
EGF activates transcription of EGR-1 expression in endothelial cell lines. (A) Constitutive expression of EGF in the human Burkitt Raji B lymphoma cells and the human MDA-MB-231 breast carcinoma cells, as shown by RT-PCR analysis. (B) bEnd.3 cells were treated with vehicle alone or 10 ng/mL epidermal growth factor (EGF) for 1 hour. Positive control consisted of bEnd.3 cells incubated with 50 ng/mL PMA for 1 hour. Total RNA was extracted and subjected to RT-PCR to quantify EGR-1 expression. (C) 293 cells were cotransfected with the pGL3-EGR-1 promoter construct and the pRL-TK Renilla luciferase as described in “Transient transfections and luciferase assays.” After 24 hours, the 293 cells were preincubated for 1 hour with blocking mAbs specific for epidermal growth factor (EGFR) or control mouse immunoglobulin G (IgG). Thereafter, the murine 267 T lymphoma cells (3 × 10⁶ cells/well), the human Burkitt Raji B lymphoma cells (3 × 10⁶ cells/well), and the human MDA-MB-231 breast carcinoma cells (5 × 10⁵ cells/well) were added to adherent cells for 16 hours. Cells were collected, and luciferase activity was measured. Controls included 293 cells without tumor cells. The firefly luciferase was normalized to Renilla luciferase activity. Results are representative of 3 independent experiments performed in triplicate. Bars indicate SD; *P ≤ .05, significantly different from the control mouse IgG treatment.
Overexpression of EGF in T lymphoma cells induces EGR-1 expression in stromal cells
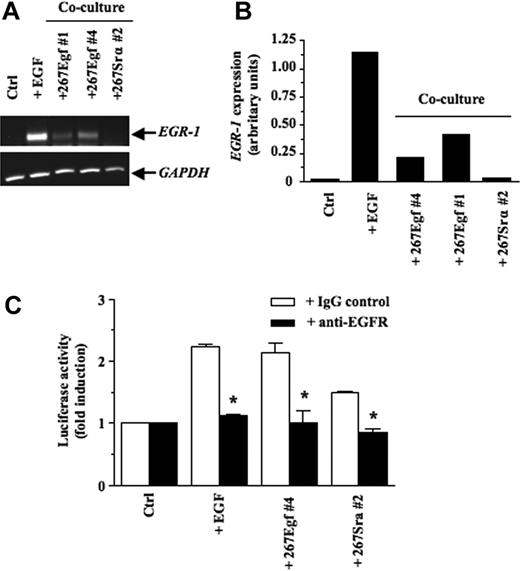
We next transfected the 267 T lymphoma cells with the cDNA encoding EGF. The 267 cells are routinely used to generate stable transfectants or for transient transfection purposes in our experimental model system.14,34,40,42,43 Furthermore, these cells have a low metastatic phenotype resembling to that of 164T2.44 After selection with puromycin, multiple clones were obtained and characterized for EGF overexpression at the mRNA and protein levels by RT-PCR and by enzyme-linked immunosorbent assay (see supplemental Figure 3). To confirm the functional reconstitution of EGF activity in these clones, EGF transfectants (267Egf) were cocultured with 293 cells and the levels of EGR-1 transcript examined after 16 hours of contact. Our results showed that EGF transfectants induced de novo expression of EGR-1 in epithelial cells (Figure 4A-B). No such induction was observed upon contact of control transfectants (267Srα). Additional coculture experiments using 293 cells transfected with EGR-1 reporter vectors confirmed the ability of lymphoma cells transfected with EGF to increase EGR-1-mediated transcriptional activity (Figure 4C[b]). Moreover, addition of anti-EGFR blocking antibodies inhibited the ability of EGF transfectants to induce EGR-1 promoter activity. The ability of EGFR blocking antibodies to reduce EGR-1 in presence of the control 267srα cells was likely due to low levels of EGF and other EGFR ligands by 267 cells.
EGR-1–induced expression in epithelial cell lines after contact with EGF transfectants. (A) After a 16-hour in vitro contact with stable transfectants (3 × 10⁶ cells/well), 293 cells were harvested, total RNA was extracted and subjected to RT-PCR to quantify EGR-1 expression. 293 cells stimulated with EGF (50 ng/mL) for 1 hour were used as a positive control. (B) Quantitative analysis of the induction of EGR-1 expression was performed by imaging densitometry. The results are presented normalized relative to GAPDH expression. Results are representative of 3 independent experiments with several clones expressing EGF and controls. (C) pGL3-EGR-1 promoter construct (0.1 μg) was transiently cotransfected with pRL-TK Renilla luciferase (0.5 μg) into 293 cells as described in “Transient transfections and luciferase assays.” After 24 hours, the 293 cells were preincubated for 1 hour with blocking monoclonal antibodies specific for EGFR or control mouse IgG. Thereafter, the stable transfectants (3 × 10⁶ cells/well) were added to adhrent cells for 16 hours. Cells were collected, and luciferase activity was measured. Controls included 293 cells without tumor cells. The firefly luciferase was normalized to Renilla luciferase activity. Results are representative of 3 independent experiments performed in triplicata. Bars represent SD; *P ≤ .05.
EGR-1–induced expression in epithelial cell lines after contact with EGF transfectants. (A) After a 16-hour in vitro contact with stable transfectants (3 × 10⁶ cells/well), 293 cells were harvested, total RNA was extracted and subjected to RT-PCR to quantify EGR-1 expression. 293 cells stimulated with EGF (50 ng/mL) for 1 hour were used as a positive control. (B) Quantitative analysis of the induction of EGR-1 expression was performed by imaging densitometry. The results are presented normalized relative to GAPDH expression. Results are representative of 3 independent experiments with several clones expressing EGF and controls. (C) pGL3-EGR-1 promoter construct (0.1 μg) was transiently cotransfected with pRL-TK Renilla luciferase (0.5 μg) into 293 cells as described in “Transient transfections and luciferase assays.” After 24 hours, the 293 cells were preincubated for 1 hour with blocking monoclonal antibodies specific for EGFR or control mouse IgG. Thereafter, the stable transfectants (3 × 10⁶ cells/well) were added to adhrent cells for 16 hours. Cells were collected, and luciferase activity was measured. Controls included 293 cells without tumor cells. The firefly luciferase was normalized to Renilla luciferase activity. Results are representative of 3 independent experiments performed in triplicata. Bars represent SD; *P ≤ .05.
EGF expression modulates T lymphoma growth in vivo
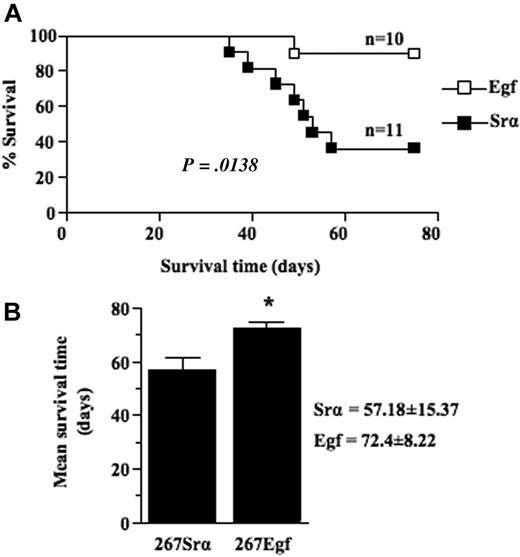
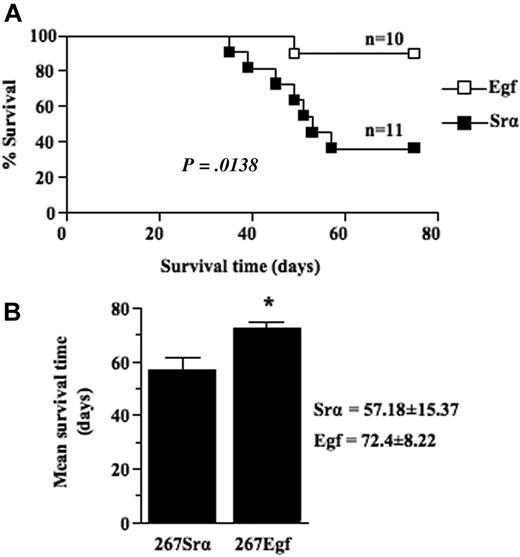
We next compared the growth of thymic lymphoma induced by intrathymic injection of EGF transfectants with that of control lymphoma cells transfected with a control vector. Frequency and mean survival time were determined for several clones of each group. Our results showed that expression of EGF in lymphoma cells significantly (P = .0138) decreased lymphoma growth rate as the mean survival time of mice injected with EGF transfectants was 72 (± 8) days compared with 57 (± 15) days for control mice (Figure 5A-B). No differences were detected between EGF-transduced cells and control cells in terms of in vitro growth when cells were grown in either 10% fetal calf serum or under conditions of lowered serum concentration (data not shown), consistent with the observations that lymphoma cells do not express EGFR. Taken together, these data show that overexpression of EGF causes a decreased malignant growth of lymphoma cells in vivo.
EGF expression decrease thymic lymphoma growth. (A) Survival analysis of 5- to 6-week-old syngeneic C57BL/6 mice injected intrathymically with 5 × 10³ per lobe of lymphoma cell transfectants (□) or controls (■). Lymphoma growth is restricted to the thymus after intrathymic injection and does not metastasize to peripheral organ. When clinical signs of thymic lymphoma became evident (runting, swelling of the thorax, and dyspnea), mice were killed, and thymic lymphoma was confirmed and collected at necropsy. (B) Histogram showing the mean survival times (MSTs) of mice after intrathymic injection of lymphoma cell transfectants or controls. Data are representative of 2 independent experiments with several different clones expressing EGF and controls. Bars represent SD; *P ≤ .05.
EGF expression decrease thymic lymphoma growth. (A) Survival analysis of 5- to 6-week-old syngeneic C57BL/6 mice injected intrathymically with 5 × 10³ per lobe of lymphoma cell transfectants (□) or controls (■). Lymphoma growth is restricted to the thymus after intrathymic injection and does not metastasize to peripheral organ. When clinical signs of thymic lymphoma became evident (runting, swelling of the thorax, and dyspnea), mice were killed, and thymic lymphoma was confirmed and collected at necropsy. (B) Histogram showing the mean survival times (MSTs) of mice after intrathymic injection of lymphoma cell transfectants or controls. Data are representative of 2 independent experiments with several different clones expressing EGF and controls. Bars represent SD; *P ≤ .05.
EGR-1 represses MMP-9 expression at the transcriptional level in vitro and ex vivo
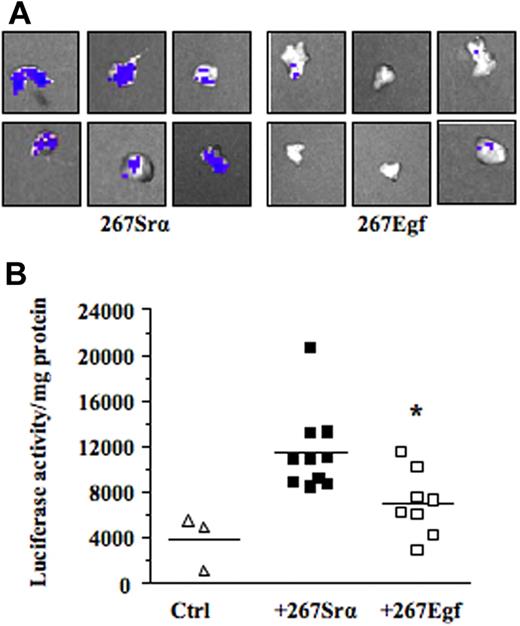
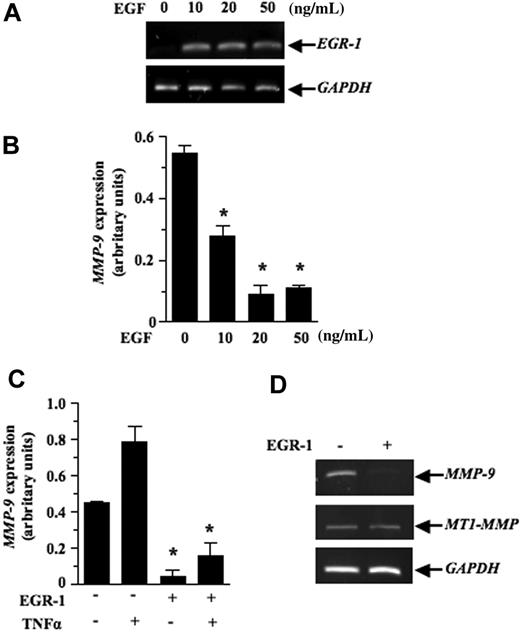
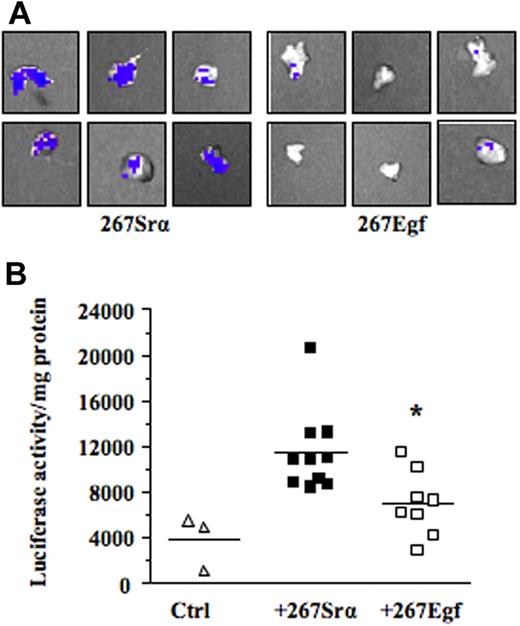
We next investigated the mechanism by which EGF inhibits lymphoma growth in vivo. Previous studies have shown that contact between lymphoma and stromal cells leads to the induction of several members of the MMP family, such as MMP-10, MMP-3, and MMP-9.7–9 These genes, most notably MMP-9, play a primary role in the progression and invasiveness of many cancer types, including leukemias.39,40 We thus examined the possibility that activation of EGR-1 by EGF modulated MMP-9 gene expression. For this purpose, we used the human HT1080 cells, a classical model used to characterize in vitro the transcriptional mechanism regulating MMP-9 gene expression. Our results showed that recombinant EGF, in a dose-dependent manner, induced EGR-1 expression while inhibiting MMP-9 expression (Figure 6A-B). Constitutive and induced MMP-9 expressions were also both inhibited after de novo expression of EGR-1 in HT1080 cells by gene transfer (Figure 6C). To determine whether expression of EGF could repress the transcriptional activation of MMP-9 in vivo, we used a transgenic mouse model harboring the MMP-9 promoter fused to a luciferase reporter gene and showed that intrathymic injection of EGF (267Egf) or control (267Srα) transfectants in transgenic mice inhibited the transcriptional activation of the transgenic promoter (Figure 7A). To confirm the in vivo activity data observed by live imaging, luciferase activity was measured ex vivo in dissected organs of transgenic mice after injection of lymphoma cells overexpressing EGF. Compared with the control transfectants, transgenic mice injected with EGF lymphoma cells expressed significantly lower levels of luciferase activity in the thymus than mice injected with control transfectants (Figure 7B), thereby supporting our in vitro data indicating that EGF/EGR-1 repress MMP-9 expression by stromal cells
Inhibition of MMP-9 mRNA expression by EGR-1. The HT1080 fibrosarcoma cells were treated with different doses of EGF for (A) 0.5 hours or (B) 18 hours. Total RNA was extracted and the subjected to RT-PCR to quantify EGR-1 and MMP-9 expression, respectively. (C) pCMV6-XL5-EGR-1 (2 μg) or empty vector pCDNA3.1 (2 μg) was transiently transfected as described in “Transient transfections and luciferase assays.” Cells were either not stimulated or stimulated with recombinant human tumor necrosis factor α (50 ng/mL) for 18 hours. HT1080 cells were collected, total RNA was extracted and then subjected to RT-PCR to quantify MMP-9 expression. Densitometry was conducted for MMP-9 and the results are presented normalized relative to GAPDH expression. (D) Levels of MT1-MMP transcripts are shown as a specificity control. Results are representative of 3 independent experiments. Bars represent SD; *P ≤ .05.
Inhibition of MMP-9 mRNA expression by EGR-1. The HT1080 fibrosarcoma cells were treated with different doses of EGF for (A) 0.5 hours or (B) 18 hours. Total RNA was extracted and the subjected to RT-PCR to quantify EGR-1 and MMP-9 expression, respectively. (C) pCMV6-XL5-EGR-1 (2 μg) or empty vector pCDNA3.1 (2 μg) was transiently transfected as described in “Transient transfections and luciferase assays.” Cells were either not stimulated or stimulated with recombinant human tumor necrosis factor α (50 ng/mL) for 18 hours. HT1080 cells were collected, total RNA was extracted and then subjected to RT-PCR to quantify MMP-9 expression. Densitometry was conducted for MMP-9 and the results are presented normalized relative to GAPDH expression. (D) Levels of MT1-MMP transcripts are shown as a specificity control. Results are representative of 3 independent experiments. Bars represent SD; *P ≤ .05.
EGF expression decreases MMP-9 promoter activity ex vivo. (A) The C57BL/6/proMMP9-Luc Tg mice were injected intrathymically with 5 × 10³ per lobe of lymphoma cell transfectants (267Egf) or controls (267Srα). At 7 days after injection, thymuses were collected and imaged using the Xenogen IVIS imaging system. Shown are representative images of thymus injected with lymphoma cells. (B) Thymuses were crushed and luciferase activity in tissue extracts was determined and normalized to the protein content. Controls included thymus without tumor cells. Bars represent SD; *P ≤ .05.
EGF expression decreases MMP-9 promoter activity ex vivo. (A) The C57BL/6/proMMP9-Luc Tg mice were injected intrathymically with 5 × 10³ per lobe of lymphoma cell transfectants (267Egf) or controls (267Srα). At 7 days after injection, thymuses were collected and imaged using the Xenogen IVIS imaging system. Shown are representative images of thymus injected with lymphoma cells. (B) Thymuses were crushed and luciferase activity in tissue extracts was determined and normalized to the protein content. Controls included thymus without tumor cells. Bars represent SD; *P ≤ .05.
Discussion
Although it is well established that tumor-stromal cell interaction plays a significant role in tumor growth, the molecular mechanisms underlying these interactions are still unclear. In the present work, we provide evidence that MMP-9 production by stromal cells can be suppressed through activation of the EGF/EGR-1 pathway, thereby inhibiting the growth of thymic lymphoma. More specifically, we showed that: (1) EGR-1 expression is induced in EC and other stromal cell types after contact with lymphoma cells; (2) exposure of EGF is sufficient to induce the expression of EGR-1; (3) EGR-1 expression inhibits constitutive and induced MMP-9 expression; and (4) the development of thymic lymphoma is inhibited when induced by lymphoma cells overexpressing EGF compared with control lymphoma cells. We therefore propose that the suppressive effect of EGR-1 is mediated by the ability of EGF/EGR-1 to repress MMP-9 expression in stromal cells because: (1) in transgenic mice harboring the MMP-9 promoter fused to a luciferase reporter gene, lymphoma cells transfected with the EGF cDNA, but not control cells, inhibited the transcriptional activation of MMP-9 gene in stromal cells; (2) addition of EGF-induced EGR-1 expression and inhibited MMP-9 expression in stromal cells; and (3) MMP-9 expression was inhibited after de novo expression of EGR-1 by gene transfer. Taken together, these data indicate that EGR-1 signaling pathways could be a source of novel targets for therapeutic intervention in tumors in which MMP-9 plays a critical role.
In previous investigations, we had used in vitro experimental models to investigate the molecular changes that occur as a result of the bidirectional cross-talk between tumor cells and ECs.7–9 We had found that several genes, including those encoding MMPs, were significantly up-regulated during the interactions between tumor and EC. Here, we found that contact between T lymphoma and EC induced the up-regulation of several members of the immediate-early gene family that include c-fos, c-jun, and EGR-1. We found that the most prominent change, however, was the up-regulation of EGR-1, a broadly expressed member of the zinc-finger family of transcription factors induced in many cell types by a variety of cytokines and growth factors.22 Based on their fast kinetic of induction, immediate-early genes are normally induced within minutes in cells, triggering diverse signals that control cell growth and differentiation.45 We also found that EGF is a potent inducer of EGR-1, which is consistent with previous studies indicating that EGF stimulates EGR-1 in many cells types.41 and with the idea that EGR-1 has significant tumor suppressing properties. Previous studies have indeed shown that EGR-1 inhibits tumor progression via its ability to induce TGFβ expression.46 Others have shown that EGR-1 can also act as gatekeeper of the p53 tumor suppressor, thereby promoting apoptosis of tumor cells.47,48 To our knowledge, however, the ability of EGF/EGR-1 to specifically inhibit MMP-9 gene activation has yet to be reported. Whether this inhibition is observed in specific or thymic stromal cell types remains, however, unclear. The ability of EGR-1 to modulate MMP-9 expression by stromal cells is critical in the context of lymphoma progression because several studies have shown that in humans, MMP-9 is associated with high grade non-Hodgkin lymphoma, while in preclinical models, its expression promotes lymphoma growth.49,50
Our data showing a suppressive activity of EGF/EGR-1 on mmp-9 gene expression are also consistent with those recently reported by Rockel et al,51 who showed that COL2A1 and AGC1 genes, which encode Type II collagen and aggrecan matrix proteins and play a central role in extracellular matrix remodeling, are inhibited by EGR-1 DNA binding activity. These authors showed that COL2A1 and AGC1 transcription was most likely due to the inhibitory effects of EGR-1 on Sp1 binding sites that overlap with EGR-1 binding sites in the promoters. Although no such classical EGR-1 binding site is present within the MMP-9 proximal promoter, we believe that such competition between EGR-1 and Sp1 could impact on the MMP-9 promoter because previous studies have shown that EGR-1 can compete with Sp1 in absence of such classical binding sites.52 Moreover, the inhibitory effect of EGF/EGR-1 could be observed using a reporter vector encoding several Sp1 binding sites. Alternatively, it is also possible that MMP-9 transcriptional activity, which is dependent on NF-κB,53 is linked to the ability of EGR-1 to suppress the NF-κB pathway.54 EGR-1 is indeed known to repress NF-κB transcriptional activity in a regulatory way by preventing its interaction with promoter targets element.55 As discussed in the previous paragraph, it is also possible that EGF/EGR-1 induces the expression of transcriptional suppressors, such as TGFβ1, a gene that is often associated with the repressive activity of EGR-1.46 This hypothesis, however, is unlikely because TGFβ1 positively regulates MMP-9 in most cell types studied.18 Another likely scenario is that EGF/EGR-1 induces the expression of a suppressive gene like PTEN,56 which negatively regulates MMP-9 expression.57 These possibilities deserve further investigation.
On the basis of the importance of the EGFR in human cancer, considerable efforts have been devoted to the development of targeted therapeutics. The current successful approaches include antibodies that bind the extracellular domain of EGFR, as well as small molecule tyrosine kinase inhibitors that inhibit their intracellular kinase activity.58 Erlotinib (Tarceva) is an orally available EGFR tyrosine kinase inhibitor advancing through clinical trials for the treatment of a range of human malignancies, in particular for the advanced non–small cell lung carcinoma.59 Clinical trials have incorporated EGFR inhibitors in combination with radiation for a variety of cancer types in which radiation plays a central role. Interestingly, Erlotinib has been shown to attenuate EGR-1 expression after exposure to radiation in humans.60 It would then be important to test whether the use of such inhibitors interferes with the ability of EGR-1 to reduce MMP-9 expression and tumor growth.
In conclusion, our study has uncovered the existence of a previously undescribed role for EGR-1 in thymic lymphoma, namely the repression of cancer cell growth. In addition, we showed that the ability of EGR-1 to suppress tumors is related to its capacity to reduce MMP-9 expression in stromal cells. Our findings are likely to impact on the interpretation of intercellular contact between tumor cells and stromal cells.
The online version of this article contains a data supplement.
The publication costs of this article were defrayed in part by page charge payment. Therefore, and solely to indicate this fact, this article is hereby marked “advertisement” in accordance with 18 USC section 1734.
Acknowledgments
We thank Diane Tremblay for her excellent technical support, and Dr Edouard F. Potworowski for critical reading of the manuscript.
This study was supported by the Cancer Research Society of Canada and the Canadian Institutes for Health Research (CIHR). F.B. is supported by the Natural Sciences and Engineering Research Council of Canada. S.D.B. is supported by the Terry Fox Foundation through the National Cancer Institute of Canada.
Authorship
Contribution: F.B. and S.D.B. designed and performed research, analyzed and interpreted results, made the figures, and wrote the paper; K.B.-P. designed and performed research; and Y.S.P. designed and performed research, interpreted results, and wrote the paper.
Conflict-of-interest disclosure: The authors declare no competing financial interests.
Correspondence: Yves St-Pierre, PhD, INRS-Institut Armand-Frappier, 531 Boul des Prairies, Laval, Québec, Canada, H7V1B7; e-mail: yves.st-pierre@iaf.inrs.ca.
References
Author notes
F.B. and S.D.B. contributed equally to this work.

