Abstract
As a central regulator of iron metabolism, hepcidin inhibits dietary iron absorption and macrophage iron recycling. Its expression is regulated by multiple factors including iron availability and erythropoietic activity. To investigate the role of transferrin (Tf) in the regulation of hepcidin expression by these factors in vivo, we employed the hypotransferrinemic (hpx) mouse. These Tf-deficient mice have severe microcytic anemia, tissue iron overload, and hepcidin deficiency. To determine the relationship of Tf levels and erythropoiesis to hepcidin expression, we subjected hpx mutant and control mice to a number of experimental manipulations. Treatment of hpx mice with Tf injections corrected their anemia and restored hepcidin expression. To investigate the effect of erythropoiesis on hepcidin expression, we suppressed erythropoiesis with blood transfusions or myeloablation with chemotherapeutic drugs. Transfusion of hpx animals with wild-type red blood cells led to increased hepcidin expression, while hepcidin expression in myeloablated hpx mice increased only if Tf was administered postablation. These results suggest that hepcidin expression in hpx mice is regulated both by Tf-restricted erythropoiesis and by Tf through a mechanism independent of its role in erythropoiesis.
Introduction
A key regulator of iron metabolism, the hepatic peptide hormone hepcidin inhibits dietary iron absorption and macrophage iron recycling.1 Hepcidin expression is regulated by factors including iron availability, erythropoiesis, inflammation, and hypoxia. While we do not fully understand the mechanisms by which these factors influence hepcidin expression, several observations implicate the abundant serum iron-binding protein transferrin (Tf). First, Tf is essential for iron delivery for erythropoiesis.2 Second, Tf-deficient zebrafish and mice exhibit anemia and hepcidin deficiency.3,4 Third, Tf treatment increases hepcidin expression in primary and immortalized mammalian cell lines and in a mouse model of β-thalassemia.5-8 Fourth, plasma transfusions increase urine hepcidin levels in patients with congenital Tf deficiency.9 Given these observations, we chose to further investigate the role of Tf in the regulation of hepcidin expression in a mammalian system in vivo.
Many years before the discovery of hepcidin in 2001, Finch proposed the existence of the stores- and erythroid-regulators of systemic iron homeostasis.10 He hypothesized that the stores-regulator inhibited dietary iron absorption when iron was abundant, and the erythroid-regulator stimulated iron absorption when erythropoiesis was ineffective. Given the role of hepcidin in iron homeostasis, the stores- and erythroid-regulators are likely to act by respectively increasing and decreasing hepcidin levels. However, as the identities of these regulators have yet to be determined, their activity, or lack thereof, can only be inferred by phenotype. The phenotype of hypotransferrinemic (hpx) mice suggests that these mice may be a useful model for studying the interplay between the stores- and erythroid-regulators. These mice harbor a splice site mutation in the Tf gene resulting in Tf deficiency, microcytic anemia, and iron overload in multiple organs.2 While the anemia is due to the lack of Tf-mediated iron delivery to the erythron, the iron overload is attributed to inadequate stimulation of hepcidin expression by the stores-regulator, excessive inhibition of hepcidin expression by hypotransferrinemic erythropoiesis, or a combination of the two. In all, hpx mice represent an attractive model system for dissecting the relationship between Tf deficiency and regulation of hepcidin expression by iron and erythropoiesis.
Our experimental approach involved three steps. First, to better understand the pathophysiology of untreated hpx mice and to determine the relationship between Tf-restricted erythropoiesis and hepcidin expression, we measured hepcidin and other parameters of iron homeostasis and erythropoiesis in untreated hpx mice and mice treated with Tf. Second, to address the effect of erythropoiesis on hepcidin expression in hpx mice, we characterized the response of wild-type strains and hpx mice to bone marrow ablation by treatment with chemotherapeutic agents or bone marrow suppression by blood or red blood cell (RBC) transfusions. Third, to determine the effect of Tf on hepcidin expression in the absence of erythropoiesis, we treated hpx mice with Tf after myeloablation. In total, we demonstrate that Tf is a major determinant of hepcidin expression in hypotransferrinemic mice.
Methods
Animals and treatments
C57BL/6J, C57BL/6N, and 129Sv/EvTac mice were obtained from The Jackson Laboratory, Charles River Laboratories, and Taconic, respectively. Hypotransferrinemic mice were maintained on the BALB/cJ background as previously described.11 All animal studies were approved by the Animal Care and Use Committee at Children's Hospital. To ensure survival of hpx mice, pups were injected intraperitoneally with 3 mg purified human Tf 2 days after birth, then once a week until weaning at day 21. Carboplatin (Sigma-Aldrich) and clinical grade doxorubicin were administered as single intraperitoneal doses of 2.5 mg and 0.25 mg, respectively. Human and murine Tf were purchased from Roche and Sigma-Aldrich, respectively, and administered as intraperitoneal doses of 10 mg and 2.5 mg, respectively. The following rationale was used to decide upon 10 mg of human Tf per injection: Assuming 5.5 mL blood volume per 100 g body mass12 and a typical body mass of 15-20 g for an 8-week-old hpx mouse, hpx mice have a blood volume of ∼ 1 mL; at a baseline hematocrit of 30%, a blood volume of 1 mL corresponds to a plasma volume of 0.7 mL. Because wild-type littermates of hpx mice contain roughly 3 mg Tf/mL plasma,13 to replete plasma Tf requires an injection of (3 mg Tf/mL plasma) × (0.7 mL plasma) = ∼ 2 mg Tf. As this 2 mg value does not include Tf distributed extravascularly, we chose 10 mg of Tf so levels would not be limiting. For injections of serum, serum was collected from 8-week-old mice, filter-sterilized, and frozen at −80°C. For whole blood transfusions, whole blood was collected into EDTA (ethylenediaminetetraacetic acid)–coated tubes and injected into recipients intraperitoneally. For RBC transfusions, EDTA-anticoagulated blood was collected, centrifuged, and washed with phosphate-buffered saline (PBS) 3× to remove plasma, then injected into recipients intraperitoneally.
Sample analysis
Reticulocyte counts, hematocrit, hemoglobin levels, serum iron, Tf saturation, liver and spleen iron levels, and serum Tf levels were determined as previously described.2,14 Spleen mass was expressed as a percent of total body mass. Hepcidin, Bmp6 (bone morphogenetic protein 6), Twsg1 (twisted gastrulation 1) and β-actin levels were determined by quantitative polymerase chain reaction as described previously14-16 ; Gdf15 (growth differentiation factor 15) and Tfr1 (transferrin receptor 1) levels were also measured by quantitative polymerase chain reaction using Gdf15 forward primer 5′-agccgagaggactcgaactcag and reverse primer 5′-ggttgacgcggagtagcagct and Tfr1 forward primer 5′-ggaagactctgctttgcagctat and reverse primer 5′-gcccaggtagccactcatga. All statistical analyses were performed using Microsoft Excel 2007. Student 2-tailed t test P values < .05 are reported as significantly different. Bars on graphs represent ± 1 SD. Fixation of tissues, histological stains, and imaging were performed as described previously.14
Results
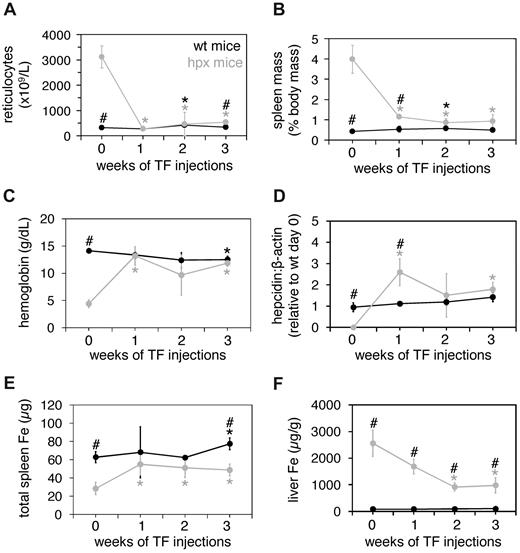
We first measured baseline levels of several parameters of iron metabolism and erythropoiesis in hpx mice, then followed any changes in these parameters in response to treatment with Tf. Relative to untreated wild-type mice, untreated hpx mice displayed elevated reticulocyte counts and spleen masses as well as reduced hemoglobin and hepcidin levels (Figure 1A-D). Hpx mice also had lower total iron binding capacities (TIBCs), total spleen iron levels, and higher liver iron concentrations (supplemental Figure 1, available on the Blood Web site; see the Supplemental Materials link at the top of the online article; and Figure 1E-F). Wild-type and hpx mice were injected intraperitoneally with 10 mg human Tf every other day for 3 weeks. Reticulocyte counts, spleen masses, and hemoglobin and hepcidin levels normalized to wild-type levels by week 1 or 2 (Figure 1A-D). Hpx spleen iron levels increased to wild-type levels by week 1, and hpx liver iron concentrations decreased by week 2 (Figure 1E-F). We observed increased reticulocyte counts and spleen masses by week 2 in Tf-treated wild-type mice, but these changes were transient. We also detected decreased hemoglobin levels and increased total spleen iron levels by week 3 in treated wild-type mice. These findings are similar to those observed previously in Tf treatment of wild-type mice and suggest that prolonged Tf treatment may alter rates of RBC synthesis or turnover.5
Tf treatment of wild-type and hpx mice. Eight-week-old wild-type (wt) and hpx mice were injected intraperitoneally with 10 mg human Tf (TF; 0.3 mL total volume) every other day for 3 weeks. Reticulocyte counts (A), spleen masses (as percent of total body mass; B), hemoglobin levels (C), liver hepcidin levels relative to β-actin levels as measured by quantitative polymerase chain reaction (QPCR; D), total spleen iron (Fe) levels (E), and liver Fe concentrations (F) were determined from animals harvested at 0, 1, 2, and 3 weeks. Total spleen Fe levels were determined by multiplying spleen mass by spleen iron concentration. Each data point represents 3 mice. A ‘#’ above a data point indicates that the values for wild-type and hpx mice differ significantly for that time point (t test, P < .05); a ‘*’ above a data point indicates that the value at that time point differs significantly from the value at day 0 for that genotype or treatment group. Bars indicate 1 SD.
Tf treatment of wild-type and hpx mice. Eight-week-old wild-type (wt) and hpx mice were injected intraperitoneally with 10 mg human Tf (TF; 0.3 mL total volume) every other day for 3 weeks. Reticulocyte counts (A), spleen masses (as percent of total body mass; B), hemoglobin levels (C), liver hepcidin levels relative to β-actin levels as measured by quantitative polymerase chain reaction (QPCR; D), total spleen iron (Fe) levels (E), and liver Fe concentrations (F) were determined from animals harvested at 0, 1, 2, and 3 weeks. Total spleen Fe levels were determined by multiplying spleen mass by spleen iron concentration. Each data point represents 3 mice. A ‘#’ above a data point indicates that the values for wild-type and hpx mice differ significantly for that time point (t test, P < .05); a ‘*’ above a data point indicates that the value at that time point differs significantly from the value at day 0 for that genotype or treatment group. Bars indicate 1 SD.
To determine how rapidly hpx mice respond to Tf and if the response was reversible, hpx mice were injected with 10 mg human Tf every other day for 9 days followed by a 6-week period without injections. By the third day of treatment, spleen masses had decreased and hematocrits had normalized; by the sixth day of treatment, hepcidin levels were elevated from baseline to levels similar to those observed in wild-type mice (data not shown). Six weeks after cessation of treatment, hematocrits, spleen masses, and hepcidin levels reverted to pretreatment or near-pretreatment levels (data not shown). Overall, the hpx response to Tf could be detected within days and was contingent upon continued Tf treatment.
While hpx mice responded robustly to treatment with human Tf, we wanted to ensure that treatment with a native source of Tf produced a similar response. To this end, we injected hpx mice every other day for 3 weeks with 1.5 mg human Tf or 0.5 mL serum isolated from wild-type littermates. We chose 1.5 mg human Tf because serum from wild-type littermates of hpx mice contains approximately 3 mg Tf/mL.13 Both treatments produced similar overall responses in reticulocyte counts, spleen masses, and hemoglobin and hepcidin levels (supplemental Figure 2). These results suggested that hpx mice responded similarly to treat-ment with human or murine Tf, justifying continued use of the human protein.
While erythropoiesis in untreated hpx mice has not been shown to exhibit the hallmark of ineffective erythropoiesis—apoptosis of immature erythrocytes—the reduction in reticulocyte count and spleen mass and increase in hemoglobin level in hpx mice treated with Tf suggested that erythropoiesis shifted from what we will refer to as hypotransferrinemic erythropoiesis to a more effective form of erythropoiesis. Concomitant with this change in erythropoiesis was an increase in hepcidin expression. This increase in hepcidin expression could have been due to loss of inhibition of hepcidin expression by hypotransferrinemic erythropoiesis or hypoxia, stimulation of hepcidin expression by Tf or other factors, or a combination thereof. To distinguish between these possibilities, we determined the effect of abolishing erythropoiesis on hepcidin expression in hpx mice. To this end, we first chose to treat mice with the myelotoxic chemotherapeutic agents doxorubicin and carboplatin.
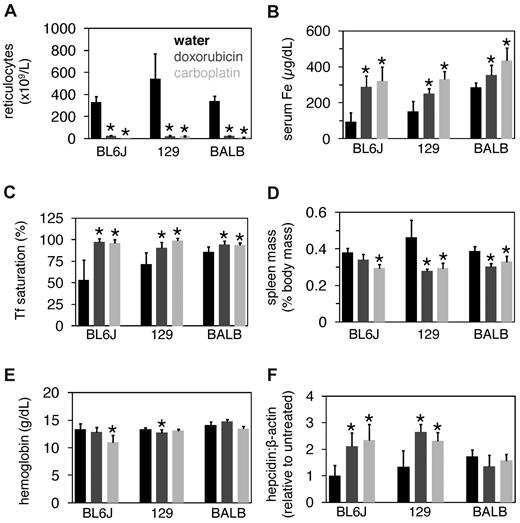
While treatment of C57BL/6J mice with these agents increases hepcidin expression,17 their effects on hepcidin levels in BALB/cJ mice, the background upon which the hpx line is maintained, is unknown. Therefore, we first established the effect of these agents in several wild-type mouse strains. Adult C57BL/6J, 129/SvEvTac, and BALB/cJ mice were treated with and without 0.25 mg doxorubicin or 2.5 mg carboplatin and then analyzed 3 days later. Reticulocyte counts decreased and serum iron levels and Tf saturations increased in all mouse strains with either treatment (Figure 2A-C). Spleen masses decreased and hemoglobin levels were unchanged in most strains and conditions (Figure 2D-E). Hepcidin levels increased in C57BL/6J and 129/SvEvTac mice but not in BALB/cJ mice treated with either agent (Figure 2F). Given that Tf stimulates hepcidin expression in vitro, the lack of increase in hepcidin levels in treated BALB/cJ mice may have been due to the minimal (∼ 10%) increase in Tf saturation; in contrast, Tf saturations in C57BL/6J and 129/SvEvTac mice increased by ∼ 40%-50% and ∼ 20%-30%, respectively.
Doxorubicin and carboplatin treatment of wild-type mice. Eight-week-old C57BL6/J, 129/SvEvTac, and BALBc/J mice were treated with or without 0.25 mg doxorubicin or 2.5 mg carboplatin and then harvested 3 days later. Mice were analyzed for reticulocyte counts (A), serum iron (Fe) concentrations (B), Tf saturations (C), spleen masses (D), hemoglobin levels (E), and liver hepcidin levels relative to β-actin levels as measured by QPCR (F). Each value represents 5 mice. A ‘*’ above a bar indicates that the value differs significantly relative to untreated mice of the same strain (t test, P < .05).
Doxorubicin and carboplatin treatment of wild-type mice. Eight-week-old C57BL6/J, 129/SvEvTac, and BALBc/J mice were treated with or without 0.25 mg doxorubicin or 2.5 mg carboplatin and then harvested 3 days later. Mice were analyzed for reticulocyte counts (A), serum iron (Fe) concentrations (B), Tf saturations (C), spleen masses (D), hemoglobin levels (E), and liver hepcidin levels relative to β-actin levels as measured by QPCR (F). Each value represents 5 mice. A ‘*’ above a bar indicates that the value differs significantly relative to untreated mice of the same strain (t test, P < .05).
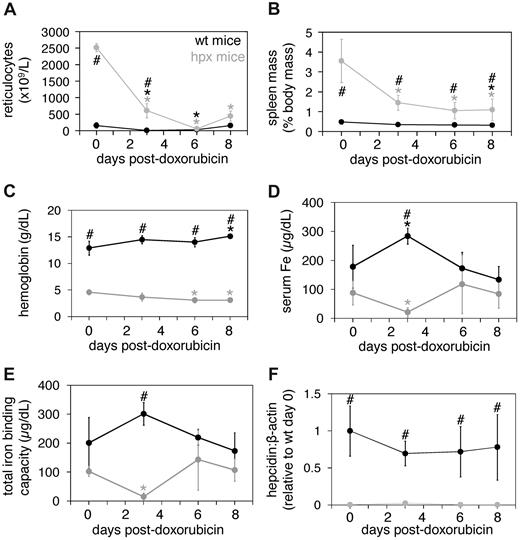
Having established wild-type strain–specific differences in response to two myelotoxic agents, we next focused on the effect of doxorubicin in hpx mice and wild-type littermates on the BALB/cJ background. We chose to use only one agent initially, as both compounds produced comparable effects in wild-type strains. We limited the course of the experiment to 8 days, as reticulocyte counts rebound 8 days after doxorubicin treatment in wild-type C57BL/6J mice, and employed 0.25 mg doxorubicin because higher doses were lethal over an 8-day period in BALB/cJ mice (data not shown). After a single 0.25-mg intraperitoneal injection of doxorubicin, reticulocyte counts and spleen masses decreased in hpx mice (Figure 3A-B). Hpx hemoglobin levels decreased by day 6 (Figure 3C), possibly stemming from a rapid rate of RBC turnover or disproportionate doxorubicin toxicity to RBCs. Hpx serum iron levels and total iron binding capacities decreased by day 3 but returned to pretreatment levels by day 6 (Figure 3D-E). As doxorubicin is an iron chelator, this rapid clearance of serum iron may have been due to clearance of doxorubicin-iron complexes by the liver and/or kidney facilitated by the absence of Tf. Tf saturations did not change throughout the course of treatment for either genotype (data not shown). Spleen iron levels did not change in either wild-type or hpx mice, while hpx liver iron levels rose by day 6 (data not shown). Notably, hepcidin levels did not change in wild-type or hpx mice (Figure 3F).
Doxorubicin treatment of wild-type and hpx mice. Eight-week-old wild-type (wt) and hpx mice were injected intraperitoneally with 0.25 mg doxorubicin and harvested and analyzed at 0, 3, 6 and 8 days for reticulocyte counts (A), spleen masses (B), hemoglobin levels (C), serum iron (Fe) concentrations (D), total iron-binding capacities (E), and liver hepcidin levels relative to β-actin levels as measured by QPCR (F). Each point represents 4 to 6 mice. The symbols ‘#’ and ‘*’ indicate statistical significance as in Figure 1.
Doxorubicin treatment of wild-type and hpx mice. Eight-week-old wild-type (wt) and hpx mice were injected intraperitoneally with 0.25 mg doxorubicin and harvested and analyzed at 0, 3, 6 and 8 days for reticulocyte counts (A), spleen masses (B), hemoglobin levels (C), serum iron (Fe) concentrations (D), total iron-binding capacities (E), and liver hepcidin levels relative to β-actin levels as measured by QPCR (F). Each point represents 4 to 6 mice. The symbols ‘#’ and ‘*’ indicate statistical significance as in Figure 1.
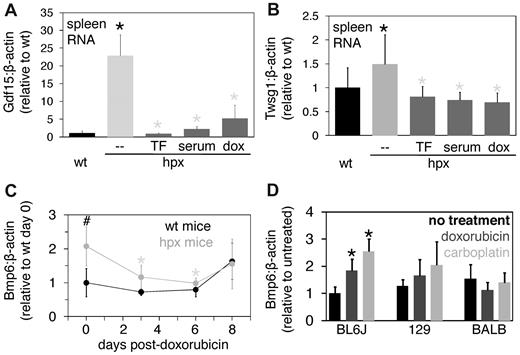
The decrease in reticulocyte count and spleen mass in doxorubicin-treated hpx mice suggested that erythropoiesis had been inhibited. Nevertheless, to further evaluate the effect of doxorubicin on erythropoiesis, we first measured expression of two factors, Gdf15 and Twsg1, both of which are produced by erythroid cells, increased in anemias associated with ineffective erythropoiesis, and shown to inhibit hepcidin expression in vitro.15,18,19 We measured splenic rather than bone marrow expression because poor bone marrow RNA yields from myeloablated mice prohibited reliable measurements and because marrow contains fewer erythroid than myeloid precursors. While splenic Gdf15 and Twsg1 RNA levels were elevated in hpx mice relative to wild-type mice, levels of both RNA species decreased in hpx mice treated with Tf, serum, or doxorubicin (Figure 4A-B). Histological analysis of spleens from mice treated with and without Tf or doxorubicin indicated that Tf and doxorubicin treatment decreased splenic red pulp mass in hpx mice (supplemental Figure 3A-D). We also measured splenic RNA levels of Tfr1, a molecule abundantly expressed in immature erythrocytes but not restricted to situations of ineffective erythropoiesis. Similar to Gdf15 and Twsg1, Tfr1 expression was increased in hpx mice relative to wild-type mice and decreased in mice treated with Tf, serum, or doxorubicin (supplemental Figure 3E). The increased expression of Gdf15, Twsg1, and Tfr1 suggests that Gdf15 and Twsg1 may serve as markers of ineffective and hypotransferrinemic erythropoiesis. Overall, the effect of doxorubicin in hpx mice indicated that the reduced hepcidin expression in these mice did not result from persistent expression of markers of ineffective erythropoiesis.
Further analysis of the effect of chemotherapeutic agents on hpx mice. (A-B) Splenic Gdf15 (A) and Twsg1 (B) levels were measured by QPCR and expressed as a ratio to β-actin levels in wild-type (wt) mice, untreated hpx mice (–), or hpx mice treated with 1.5 mg human Tf (TF) or 0.5 mL wild-type mouse serum (serum) every other day for 3 weeks or 0.25 mg doxorubicin (dox) for 6 days. Each bar represents 3 to 6 mice. Black and gray asterisks indicate statistical significance between the labeled value and wild-type or hpx mouse value, respectively. (C) Hepatic Bmp6 levels relative to β-actin levels were measured by QPCR in samples from doxorubicin-treated wild-type and hpx mice from Figure 3. The symbols ‘#’ and ‘*’ indicate statistical significance as in Figure 1. (D) Hepatic Bmp6 levels relative to β-actin levels were measured by QPCR in samples from wild-type mice treated with doxorubicin or carboplatin from Figure 2. A ‘*’ indicates statistical significance relative to untreated mice as in Figure 2.
Further analysis of the effect of chemotherapeutic agents on hpx mice. (A-B) Splenic Gdf15 (A) and Twsg1 (B) levels were measured by QPCR and expressed as a ratio to β-actin levels in wild-type (wt) mice, untreated hpx mice (–), or hpx mice treated with 1.5 mg human Tf (TF) or 0.5 mL wild-type mouse serum (serum) every other day for 3 weeks or 0.25 mg doxorubicin (dox) for 6 days. Each bar represents 3 to 6 mice. Black and gray asterisks indicate statistical significance between the labeled value and wild-type or hpx mouse value, respectively. (C) Hepatic Bmp6 levels relative to β-actin levels were measured by QPCR in samples from doxorubicin-treated wild-type and hpx mice from Figure 3. The symbols ‘#’ and ‘*’ indicate statistical significance as in Figure 1. (D) Hepatic Bmp6 levels relative to β-actin levels were measured by QPCR in samples from wild-type mice treated with doxorubicin or carboplatin from Figure 2. A ‘*’ indicates statistical significance relative to untreated mice as in Figure 2.
We also measured hepatic expression of Bmp6, a stimulator of hepcidin expression. Bmp6-deficient mice exhibit hepcidin deficiency and iron overload16,20 and Bmp6 levels are increased in mice with iron overload.21-23 Bmp6 levels were elevated in untreated hpx mice relative to wild-type mice, suggesting that hypotransferrinemia does not abrogate the increase in Bmp6 levels observed in the setting of iron overload and that increased Bmp6 levels are insufficient to increase hepcidin levels in hpx mice (Figure 4C). However, in hpx mice treated with doxorubicin, Bmp6 levels decreased at 3 and 6 days but rebounded by 8 days posttreatment, suggesting that Bmp6 expression in hpx mice is doxorubicin-sensitive (Figure 4C). This sensitivity may stem from a direct effect of doxorubicin on hepatic Bmp6 expression or an indirect effect of doxorubicin on a process such as iron-dependent regulation of Bmp6 expression. In contrast, Bmp6 levels did not change in hpx mice treated with Tf every other day for 3 weeks, further suggesting that Tf is not essential for increasing Bmp6 levels in the setting of iron overload (supplemental Figure 3F). To determine whether this post-doxorubicin decrease in Bmp6 levels was specific to hpx mice, we measured Bmp6 levels in the wild-type strains treated with myelotoxic agents in Figure 2. Bmp6 levels did not decrease in BALB/cJ mice, suggesting that the postablation decrease in Bmp6 levels was specific to hpx mice (Figure 4D). To determine whether this decrease in Bmp6 levels was specific to doxorubicin, we treated wild-type and hpx mice with 2.5 mg carboplatin and analyzed them 3 days later. Hpx mice exhibited a decrease in reticulocyte count and hemoglobin level but no change in spleen mass, splenic Gdf15 or Twsg1 levels, or hepatic hepcidin or Bmp6 levels compared with untreated hpx mice (data not shown). In contrast, hpx mice treated with doxorubicin exhibited a decrease in reticulocyte count and spleen mass but no change in hemoglobin level 3 days after treatment (Figure 3A-B). These discrepancies may reflect the individual mechanisms of action and pharmacokinetics of the two agents.
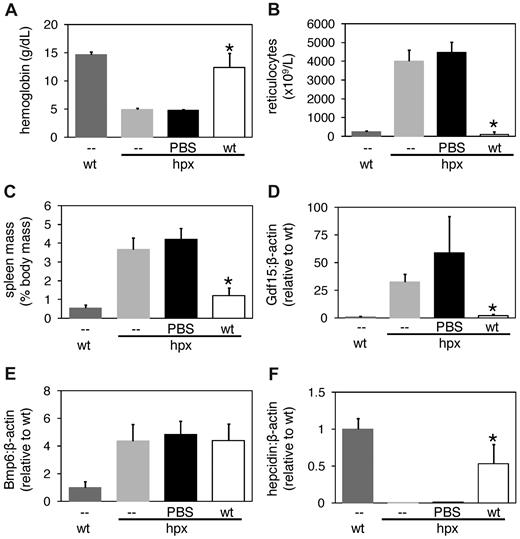
To assess the possibility that the chemotherapeutic agents influenced gene expression in hpx mice independently of their effects on erythropoiesis—such as through hepatocellular toxicity in an iron-overloaded liver—we first analyzed Bmp6 expression in BALB/cJ wild-type and hpx mice in which erythropoiesis was suppressed by transfusion. Transfusion of 0.5 mL wild-type mouse blood into BALB/cJ mice every other day for 1 week led to increased hemoglobin levels, decreased reticulocyte counts, and increased serum iron levels without a decrease in liver Bmp6 levels (supplemental Figure 4). Transfusion of 0.5 mL reticulocyte-rich hpx mouse blood into BALB/cJ mice every other day for 1 week only led to increased reticulocyte counts without a decrease in liver Bmp6 levels (supplemental Figure 4). Tf saturations did not change with any treatment (data not shown). To address the effect of erythropoietic suppression in hpx mice, we transfused 0.5 mL of PBS or washed wild-type RBCs into hpx mice every other day for 1 week. Hemoglobin levels increased and spleen masses, reticulocyte counts, and splenic Gdf15 and Twsg1 levels decreased in hpx mice transfused with RBCs relative to mice transfused with PBS (Figure 5A-D, data not shown). Serum iron levels, total iron binding capacities, and Tf saturations did not differ between hpx mice transfused with PBS or RBCs, and Tf levels were below the limit of detection by immunoblot in hpx mice transfused with PBS or RBCs (data not shown). While hepatic Bmp6 levels did not differ between PBS- and RBC-transfused hpx mice, hepcidin levels increased in the latter group (Figure 6E-F), indicating that erythropoiesis can modulate hepcidin expression independently of Tf.
Transfusion of hpx mice with wild-type RBCs. Hpx mice were transfused with 0.5 mL PBS or washed wild-type RBCs every other day for 1 week then harvested on day 7 and analyzed for hemoglobin levels (A), reticulocyte counts (B), spleen masses (C), splenic Gdf15 levels (D), and hepatic Bmp6 (E) and hepcidin (F) levels. Gene expression levels were measured by QPCR and expressed as a ratio to β-actin levels. A ‘*’ indicates statistical significance (t test, P < .05) relative to values for PBS-transfused hpx mice.
Transfusion of hpx mice with wild-type RBCs. Hpx mice were transfused with 0.5 mL PBS or washed wild-type RBCs every other day for 1 week then harvested on day 7 and analyzed for hemoglobin levels (A), reticulocyte counts (B), spleen masses (C), splenic Gdf15 levels (D), and hepatic Bmp6 (E) and hepcidin (F) levels. Gene expression levels were measured by QPCR and expressed as a ratio to β-actin levels. A ‘*’ indicates statistical significance (t test, P < .05) relative to values for PBS-transfused hpx mice.
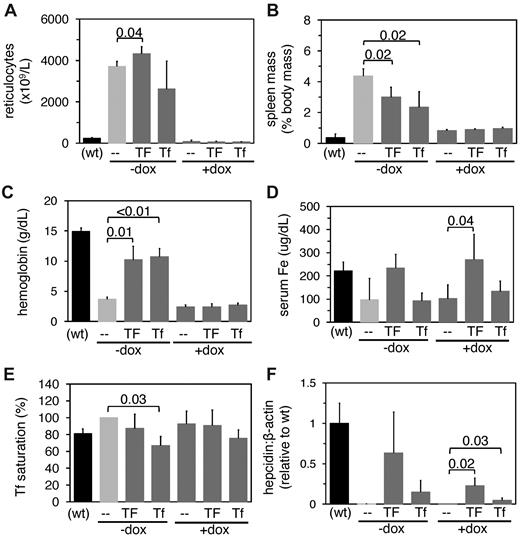
Doxorubicin and Tf treatment of hpx mice. Eight-week-old hpx mice were treated with or without 0.25 mg doxorubicin (+dox and -dox) on day 0; mice were then treated with or without 10 mg human Tf (TF) or 2.5 mg mouse Tf (Tf) on day 3 and 5. Mice were then harvested on day 6 and analyzed for reticulocyte counts (A), spleen masses (B), hemoglobin levels (C), serum iron (Fe) levels (D), Tf saturations (E), and hepcidin levels relative to β-actin levels by QPCR (F). Untreated wild-type (wt) mice, indicated in parentheses, were included for reference. Each bar represents 4 to 5 mice. Numbers indicate outcome of t test between bracketed values.
Doxorubicin and Tf treatment of hpx mice. Eight-week-old hpx mice were treated with or without 0.25 mg doxorubicin (+dox and -dox) on day 0; mice were then treated with or without 10 mg human Tf (TF) or 2.5 mg mouse Tf (Tf) on day 3 and 5. Mice were then harvested on day 6 and analyzed for reticulocyte counts (A), spleen masses (B), hemoglobin levels (C), serum iron (Fe) levels (D), Tf saturations (E), and hepcidin levels relative to β-actin levels by QPCR (F). Untreated wild-type (wt) mice, indicated in parentheses, were included for reference. Each bar represents 4 to 5 mice. Numbers indicate outcome of t test between bracketed values.
The increased hepcidin expression in transfused hpx mice suggested that hypotransferrinemic erythropoiesis inhibits hepcidin expression. To determine whether hepcidin expression could be modulated by Tf in an erythropoiesis-independent manner, we chose to determine the effect of Tf administration in doxorubicin-treated hpx mice. We chose doxorubicin over carboplatin because a three-day treatment of hpx mice with carboplatin did not alter splenomegaly and the associated overexpression of Gdf15 and Twsg1. In the third step of our experimental approach, we treated hpx mice with doxorubicin on day 0 and either 10 mg of human Tf or 2.5 mg of murine Tf on days 3 and 5 and analyzed the mice on day 6. Reticulocyte counts and spleen masses decreased in all doxorubicin-treated mice (Figure 6A-B), and hemoglobin levels increased in hpx mice treated with Tf but not with both doxorubicin and Tf (Figure 6C). These two observations indicate that doxorubicin effectively suppressed erythropoiesis. Serum iron levels increased in hpx mice treated with doxorubicin and human Tf but not murine Tf, while Tf saturations were unchanged with most treatments (Figure 6D-E). Hepcidin expression increased in mice treated with doxorubicin and human or murine Tf by approximately eighty-fold and seventeen-fold, respectively (Figure 6F). The smaller increase in hepcidin levels and serum iron levels in mice treated with murine Tf presumably reflects the smaller dose of Tf used. Injection of hpx mice with bovine serum albumin had no effect on measured parameters (data not shown). These findings have two implications. First, Tf can stimulate an increase in hepcidin levels after ablation of erythropoiesis; second, unlike Bmp6 expression, Tf-dependent stimulation of hepcidin expression in hpx mice is insensitive to doxorubicin.
Discussion
The phenotype of hpx mice can largely be explained by deficiencies in Tf and hepcidin. The former leads to insufficient iron delivery to the erythron and microcytic anemia, while the latter results in increased dietary iron absorption,24 accelerated tissue iron uptake,25 and severe tissue iron overload. The mechanism linking the two deficiencies is less readily explained and is the focus of this paper.
We propose that hepcidin deficiency in hpx mice is due to at least one of several processes. First, the pathway by which the stores-regulator modulates hepcidin expression may be impaired—the stores-regulator either fails to sense iron overload or fails to stimulate hepcidin expression in the setting of iron overload. This scenario is reminiscent of genetic hemochromatosis, a disorder caused by mutations in proteins required for stimulation of hepcidin expression.1,25 While erythropoiesis is not impaired in hemochromatosis, hypotransferrinemia and genetic hemochromatosis share the phenotypes of Bmp6 overexpression, hepcidin deficiency, and tissue iron overload.21,22,26 The increased Bmp6 levels we observed in hpx mice suggest that the sensing of iron overload is intact in these mice but that the sensing mechanism fails to elicit hepcidin expression.
A second potential mechanism is inhibition of hepcidin expression by hypotransferrinemic erythropoiesis. This requires that hypotransferrinemic erythropoiesis possesses a hepcidin-suppressive effect akin to that observed in conditions of ineffective erythropoiesis such as β-thalassemia. Two observations support this possibility. First, we have shown that hepcidin levels increased in hpx mice transfused with wild-type RBCs; second, in an experiment predating the discovery of hepcidin, Buys et al found that intestinal iron absorption decreased in hpx mice similarly transfused.13 These findings imply that the erythroid-regulator associated with β-thalassemia is active under a broader range of conditions than previously thought. Although hypotransferrinemic erythropoiesis is not necessarily ineffective, hypotransferrinemic and ineffective erythropoiesis may share downstream regulation of iron demand and supply pathways. As the role of GDF15 and TWSG1 has only been addressed in β-thalassemia, the involvement of these two factors in hepcidin regulation in other conditions is unclear. Thus, we prefer to leave the question of the identity of the erythroid-regulator open and will continue to use this term with reference to the erythroid-regulator in hpx mice.
Our results can also be interpreted in light of Li et al's recent finding that serial Tf injections into β-thalassemic mice led to increased hepcidin expression and improvement in anemia.5 Like hypotransferrinemia, β-thalassemia is a severe anemia characterized by tissue iron overload and inappropriately low hepcidin levels. Unlike hypotransferrinemia, hepcidin levels are not absolutely but rather are relatively low with respect to iron levels. Li et al proposed that serial Tf injections into β-thalassemic mice reversed ineffective erythropoiesis, thereby increasing hepcidin expression. In this paper, we demonstrate that hypotransferrinemic erythropoiesis suppresses hepcidin expression. Overall, both papers share the finding that Tf levels influence the nature of erythropoiesis and, in turn, the regulation of hepcidin expression by erythropoiesis.
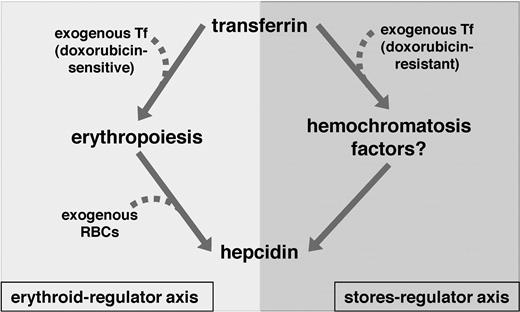
Our observations expand the list of possible roles of Tf in iron homeostasis in hpx mice (Figure 7). First, Tf may regulate hepcidin expression via its influence upon erythropoiesis. We suggest that hypotransferrinemic erythropoiesis results in activation of the erythroid-regulator. The erythroid-regulator is dominant over Bmp6, as Bmp6 levels are elevated yet hepcidin levels are minimal in untreated hpx mice. It is not clear if the erythroid-regulator is a humoral factor, as transfusion of wild-type mice with hpx blood failed to inhibit hepcidin expression, similar to the finding by Buys et al that transfusion of wild-type mice with hpx blood failed to alter rates of intestinal iron absorption.13 However, these results may simply reflect lability of the erythroid-regulator. Second, Tf may stimulate hepcidin expression in an erythropoiesis-independent manner. This role is implied by the increase in hepcidin expression in hpx mice treated with doxorubicin and then Tf. The mechanism underlying this second role is unclear, but it is likely that genes linked to genetic hemochromatosis are involved.
Model of Tf-dependent regulation of hepcidin expression. Tf-dependent regulation of hepcidin expression occurs via two axes in hpx mice. In the erythroid-regulator axis, Tf delivers iron to the erythron, leading to effective erythropoiesis; with effective erythropoiesis comes decreased activity of the erythroid-regulator and decreased inhibition of hepcidin expression. In the stores-regulator axis, Tf leads to stimulation of hepcidin expression in a process requiring hemochromatosis genes such as Bmp6, Hfe, Hjv and Tfr2. Treatment of hpx mice with exogenous Tf leads to effective erythropoiesis and decreased erythroid-regulator activity via the erythroid-regulator axis and stimulation of hepcidin expression via the stores-regulator axis. Treatment of hpx mice with wild-type RBCs leads to decreased erythroid-regulator activity without the need for endogenous erythropoiesis. Treatment of hpx mice with doxorubicin then Tf leads to stimulation of hepcidin expression via the stores-regulator axis.
Model of Tf-dependent regulation of hepcidin expression. Tf-dependent regulation of hepcidin expression occurs via two axes in hpx mice. In the erythroid-regulator axis, Tf delivers iron to the erythron, leading to effective erythropoiesis; with effective erythropoiesis comes decreased activity of the erythroid-regulator and decreased inhibition of hepcidin expression. In the stores-regulator axis, Tf leads to stimulation of hepcidin expression in a process requiring hemochromatosis genes such as Bmp6, Hfe, Hjv and Tfr2. Treatment of hpx mice with exogenous Tf leads to effective erythropoiesis and decreased erythroid-regulator activity via the erythroid-regulator axis and stimulation of hepcidin expression via the stores-regulator axis. Treatment of hpx mice with wild-type RBCs leads to decreased erythroid-regulator activity without the need for endogenous erythropoiesis. Treatment of hpx mice with doxorubicin then Tf leads to stimulation of hepcidin expression via the stores-regulator axis.
The online version of this article contains a data supplement.
The publication costs of this article were defrayed in part by page charge payment. Therefore, and solely to indicate this fact, this article is hereby marked “advertisement” in accordance with 18 USC section 1734.
Acknowledgments
This work was supported by a Cooley's Anemia Foundation Postdoctoral Research Fellowship Award and a National Institutes of Health K99 DK084122 award to T.B.B. M.D.F is supported by National Institutes of Health R01DK080011, and N.C.A. is supported by R01DK066373.
National Institutes of Health
Authorship
Contribution: T.B.B. planned, executed, and interpreted all experiments and prepared the manuscript; and N.C.A. and M.D.F. supervised all work and edited the manuscript.
Conflict-of-interest disclosure: The authors declare no competing financial interests.
Correspondence: Thomas B. Bartnikas, Department of Pathology, Enders 1122, 300 Longwood Ave, Children's Hospital, Boston, MA 02115; e-mail: tbartnikas@enders.tch.harvard.edu.

