Abstract
Erythropoiesis is dependent on the activity of transcription factors, including the erythroid-specific erythroid Kruppel-like factor (EKLF). ChIP followed by massively parallel sequencing (ChIP-Seq) is a powerful, unbiased method to map trans-factor occupancy. We used ChIP-Seq to study the interactome of EKLF in mouse erythroid progenitor cells and more differentiated erythroblasts. We correlated these results with the nuclear distribution of EKLF, RNA-Seq analysis of the transcriptome, and the occupancy of other erythroid transcription factors. In progenitor cells, EKLF is found predominantly at the periphery of the nucleus, where EKLF primarily occupies the promoter regions of genes and acts as a transcriptional activator. In erythroblasts, EKLF is distributed throughout the nucleus, and erythroblast-specific EKLF occupancy is predominantly in intragenic regions. In progenitor cells, EKLF modulates general cell growth and cell cycle regulatory pathways, whereas in erythroblasts EKLF is associated with repression of these pathways. The EKLF interactome shows very little overlap with the interactomes of GATA1, GATA2, or TAL1, leading to a model in which EKLF directs programs that are independent of those regulated by the GATA factors or TAL1.
Introduction
More than 2 million red blood cells are released into the circulation every second by a multistep process known as erythropoiesis,1 which is accompanied by significant changes in the RNA expression profile.2 The erythroid-specific DNA binding protein erythroid Kruppel-like factor (Klf1; EKLF), the founding member of the mammalian Kruppel/Sp1-like family of C2H2-type zinc finger DNA binding proteins, plays a significant role in this process.3,4 Klf1 mRNA and EKLF are expressed in both erythroid progenitor cells and terminally differentiating erythrocytes.5,6 In cell lines and in vitro, EKLF has been demonstrated to physically and functionally interact with DNA at a conserved CCNCNCCCN motif and with additional protein cofactors.7,8
In EKLF-deficient (Klf1−/−) mice, definitive fetal liver erythroid progenitor cells fail to progress to erythroblasts,9 leading to anemia and lethality by embryonic day 15.10,11 Genome-wide mRNA profiling of WT and Klf1−/− erythroid cells has revealed significant dysregulation of > 3000 mRNAs.9,12-15 Two-thirds of the dysregulated transcripts were present at reduced levels in Klf1−/− cells, consistent with the role of EKLF as a transcriptional activator, whereas one-third were present at increased levels, consistent with the role of EKLF as a transcriptional repressor.16 Chromatin immunoprecipitation (ChIP) demonstrated EKLF occupancy at selected sites in genes encoding erythrocyte proteins AHSP, ankyrin, β-spectrin, Band 3, and dematin, all of which are down-regulated in EKLF-deficient cells.9,12-15 EKLF also participates in chromatin modification and DNase hypersensitive site formation through interactions with CBP/p300 and an SWI/SNF-related chromatin remodeling complex.17,18 For example, in Klf1−/− erythroid cells, the Ahsp and E2f2 loci are expressed at significantly lower levels and do not become sensitive to DNase I.9,15 Klf1−/− erythroid cells also fail to form the active chromatin hub consisting of the β-globin promoter and elements in the locus control region,19 resulting in significantly decreased β-globin mRNA and protein production. Point mutations in mouse Klf1 and human KLF1 genes lead to a hereditary spherocytosis-like phenotype in the mouse20,21 and a form of congenital dyserythropoietic anemia characterized by unstable red cell membranes in humans.22,23 Haploinsufficiency of EKLF has been shown to result in reactivation of the human fetal/embryonic globin genes that are normally silenced in adult erythrocytes.24,25
ChIP followed by massively parallel sequencing (ChIP-Seq)26 has made it possible to map transcription factor occupancy in a largely unbiased manner across the genome. Recent reports have analyzed the interactomes of 2 other erythroid-specific DNA binding proteins, GATA1 and TAL1, in erythroid cell lines.27-30 These studies confirmed the association of GATA1 with its known target genes and also demonstrated co-occupancy of GATA1 and other transcription factors, notably GATA2, SCL/TAL, and the Kruppel family member ZBTB7A at subsets of occupied sites. A recent report31 analyzed EKLF binding across the genome in unfractionated mouse fetal liver cells, confirming the association of EKLF with many target genes and a strong preference for associating with a sequence similar to CCNCNCCCN. The GATA1, TAL1, and EKLF studies identified examples of genes that could be activated or repressed by these factors. However, none of the previous studies comprehensively compared erythroid progenitor cells with committed erythroblasts; thus, the role of these DNA-binding proteins in erythroid differentiation could not be determined.
We hypothesized that changes in the mRNA profile between erythroid progenitor cells and erythroblasts would be accompanied by alterations in the direct EKLF interactions with regulated loci. To test this hypothesis, we compared the EKLF interactome and the mRNA expression profile of primary mouse erythroid progenitor cells and mature erythroblasts by performing ChIP-Seq and RNA-Seq analyses. We found that EKLF is located primarily in gene promoter/first exon regions in erythroid progenitor cell chromatin, whereas in erythroblasts, the majority of EKLF is located within gene bodies. Confocal microscopy demonstrated that EKLF occupancy relocates from peripheral nuclear locations in progenitor cells to more central nuclear regions in erythroblasts. Comparison of the EKLF occupancy profile with those of GATA2, GATA1, and TAL1 revealed that, whereas TAL1 and GATA1 are found together frequently in differentiated erythroblasts, EKLF rarely was found at the same locations as GATA1 and TAL1. Finally, we show that the shift in positions of EKLF corresponds with a change in the types of genes being regulated, with EKLF primarily modulating general cell growth and cell cycle regulatory pathways in progenitor cells but shifting to regulation of erythroid development and reorganization of cytoskeletal elements in erythroblasts.
Methods
Cell culture
G1E and G1E-ER4 cells were grown in IMDM with 15% fetal calf serum, 2 U/mL erythropoietin (EpoGen; Amgen), and 50 ng/mL SCF. G1E-ER4 cells were cultured in the presence of 10−8M estradiol for 24 hours.
HA-EKLF mice
All animal studies were approved by the Animal Care and Use Committee of the National Human Genome Research Institute. HA-EKLF-TAP–tagged heterozygous mice,32 in which the endogenous Klf1 locus was modified to contain a hemagglutinin (HA) tag, were a kind gift of Dr Tim M. Townes (University of Alabama Birmingham). HA-Klf1 mice were bred to homozygosity for maintenance. Fetal liver cells were obtained from E13.5 HA-Klf1 embryos as described previously.9 Fetal livers were dissociated to single-cell suspension and stained with anti-CD71–FITC and anti-Ter119–PE antibodies (BD Biosciences PharMingen). Cell populations were isolated using a FACSAria flow cytometer running FACSDiva 6.1.3 software (BD Biosciences). Cells were collected as erythroid progenitors (Ter119−CD71− and Ter119−CD71+) or erythroblasts (Ter119+CD71+).33 At least 3 independent cell sorts for each population were performed.
ChIP
ChIP enrichment of HA-EKLF–bound chromatin obtained from fetal liver progenitors and erythroblasts or GATA1-, GATA2-, and TAL1-bound G1E/G1E-ER4 cells was performed as previously described.9,27,34 Chromatin was processed using the Magna ChIP A kit (#17-610; Millipore) according to the manufacturer's instructions. Chromatin was immunoprecipitated with monoclonal antibodies against HA (F-7, sc-7329X), GATA2 (SC-9008X), GATA1 (SC-265X), or TAL1 (SC-12984; all Santa Cruz Biotechnology). As a background genomic control, sheared chromatin from E13.5 HA-EKLF fetal liver cells or G1E cells was processed in parallel, minus incubation with the antibodies.
Library construction was performed using the Illumina ChIP-Seq library preparation kit according to the standard protocol. ChIP-Seq fragments were separated on an agarose gel, and fragments of approximately 200 bp were ligated to Illumina-specific adapters to generate libraries. Six cycles of PCR amplification were used to select for fragments containing both Illumina-specific adapters before bead-based elimination of unligated adapters. Single-end reads, 30 to 48 bases in length, were sequenced on the Illumina Genome Analyzer IIx platform. Reads passing Illumina's chastity filtering parameters (0.6) were selected for assembly.
ChIP-Seq analysis
Sequenced reads were mapped to the mouse genome (UCSC genome browser assembly mm9, NCBI build 37) using the Eland V2 short-read alignment program. An ungapped local alignment against the reference genome allowed no more than 2 mismatches when aligning a read. Any alternative alignments (ie, nonunique hits to the genome) are also reported. We aligned reads using the maximum allowable seed length and only considered unique genomic alignments for downstream analyses.
We used the Model-based Alignment of ChIP-Seq (MACS) program35 to call peaks of EKLF occupancy. MACS compares the number of EKLF-enriched sequence tags in a given window with the number of tags in surrounding windows and with the number of tags in the same region of the control library. Peaks are defined based on a user-selected significance level. The algorithm empirically models the length of ChIP-Seq fragments from the sequence data, considering local genomic biases for analysis of distribution of mapped reads. The following parameters were used: macs, t, treatment_bedfile; c, control_bedfile; tsize = 36; wig; P = 10−5 also with P = 10−06.
We partitioned the genome into 5 discrete regions, based on annotated RefSeq coordinates in the UCSC genome browser: (1) distal 5′: 11 kb upstream of the transcription start site (TSS) to 1 kb upstream of TSS; (2) proximal 5′: 1 kb upstream of TSS up to/including the first intron; (3) intragenic: gene-coding sequence, minus the first exon-intron, plus the 3′ untranslated region; (4) 3′ adjacent: 10 kb downstream of the 3′-untranslated region; and (5) intergenic. Ambiguous peaks falling within 2 partitions because of the vicinity of nearby or overlapping genes transcribed in opposite directions were assigned using the hierarchy: (a) proximal 5′, (b) intragenic, (c) distal 5′, (d) 3′ adjacent, and (e) intergenic.
We used the UCSC table browser to extract repeat-masked genomic sequences based on EKLF peak coordinates reported by MACS. These sequences were then used as the input for MEME (http://meme.sdsc.edu), a de novo motif discovery tool36 using the following parameters: meme, p8; dna; revcomp; nmotifs 5; maxw 15; oc; outdir; seqfile.
Three-dimensional fluorescent microscopy
Fetal liver cells were stained with anti-CD71–FITC and anti-Ter119–V450 antibodies (BD Biosciences PharMingen). Erythroid progenitors (CD71+ Ter119−) and erythroblasts (CD71+ Ter119+) were isolated by flow cytometry and allowed to settle onto glass slides in a humidified chamber at 37°C with 5% CO2 for 60 minutes. Cells were fixed in 2% paraformaldehyde for 40 minutes at room temperature and washed 3 times in PBS (Invitrogen), followed by 3 washes in Triton-X (0.1%) and 3 more washes with PBS. Cells were blocked, incubated at 37°C for 60 minutes in 3% BSA, and washed 3 times in PBS. Directly conjugated anti-HA–AlexaFluor-594 and isotype control–AlexaFluor-647 antibodies (Invitrogen) were incubated with the slides at 4°C overnight. Slides were washed 3 times with PBS plus 0.1% Tween20 and air dried for 10 minutes. Prolong Gold (Invitrogen) antifade mounting media with 4,6-diamidino-2-phenylindole (DAPI) was applied to the cover slip and sealed.
Confocal images were acquired at room temperature using a Zeiss LSM 510 NLO Meta system, mounted on a Zeiss Axiovert 200M microscope with an oil immersion Plan-Apochromat 63×/1.4 DIC objective lens. Excitation wavelengths of 488 nm (3%), 561 nm (6%), and 770 nm (3%) were used to detect anti-CD71 FITC, anti-HA–AlexaFluor-594, and DAPI, respectively. Fluorescent emissions were collected in a BP 500- to 550-nm IR blocked filter, BP 575- to 615-nm IR blocked filter, BP 641- to 705-nm custom filter, and a BP 390- to 465-nm IR blocked filter, respectively. All pinholes were set with a range from 1.11 to 1.33 Airy units, corresponding to an optical slice of 1.0 μm (excluding the DAPI channel where a multiphoton laser was used). All confocal images were of frame size 512 × 512 pixels, scan zoom of 3, and line averaged 8 times. Confocal images were postprocessed using MediaCybernetics' Image-Pro Plus Version 7.0 software package. Each image was processed using a built-in Line Profile tool. A line was drawn through the middle of each cell to determine the density of red (EKLF) and DAPI signals in the middle 20% of the nucleus and on both edges (10% each side).
RNA-Seq analysis
RNA was extracted from sorted fetal liver progenitor cells and erythroblasts, G1E cells, and induced G1E-ER4 + E2 cells. RNA-Seq libraries were generated and sequenced using Illumina adapters for paired-end 51-bp sequencing (progenitor cells and erythroblasts) or 36-bp sequencing (G1E and G1E-ER4 + E2) on the Illumina Genome Analyzer IIxplatform. Image analysis and base-calling were done using Illumina Genome Analyzer Pipeline software with default parameters. Sequence reads were aligned to the mouse reference (UCSC assembly mm9, NCBI build 37) and a custom splice-junction library based on UCSC known genes using the Cufflinks 1.03 software. Mapped reads fro all 4 cell types (G1E, G1E-ER4 + E2, primary progenitor cells, and erythroblasts) were compared with the annotated genes in the RefSeq database. The number of reads mapped to a gene was divided by the total number of sequenced reads for that cell type. Reads per gene were normalized for length. To establish a threshold, we compared the set of genes that were expressed in all 4 cell types with the set of nonexpressed genes. The mean for the 4 cell lines (reads/gene per million reads = 0.8) for the set of nonexpressed genes was used as a threshold to categorize expressed and unexpressed genes. Genes showing more than 2-fold change were considered differentially expressed. Lists of differentially expressed genes were imported into the Ingenuity Systems Pathways Knowledge Base and categorized based on reported or suggested biochemical, biologic, and molecular functions. Genes were mapped to networks in the Ingenuity database and ranked by score, which represents the probability that a collection of genes equal to or greater than the number in a network could be achieved by chance alone.
Data access
Sequencing reads and peak calls are available on our customized genome browser: http://main.genome-browser.bx.psu.edu
Results
Genome-wide mapping of EKLF occupancy
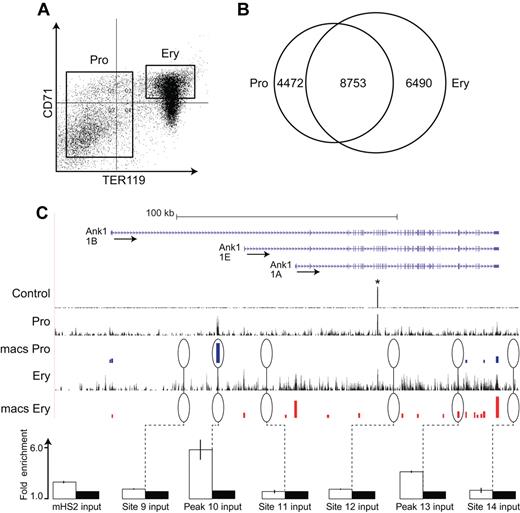
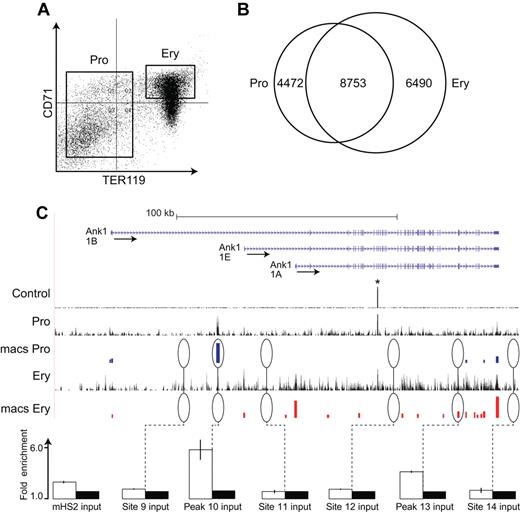
Fetal liver cells (E13.5) from embryos homozygous for the HA-tagged Klf1 allele32 were stained with antibodies against CD71 (transferrin receptor) and Ter119.33 Populations of Ter119-negative erythroid progenitor cells and CD71-positive/Ter119-positive erythroblasts were isolated by FACS (Figure 1A). Ter119-negative cells are highly enriched for erythroid colony-forming cells (colony-forming units-erythroid [CFU-E] and burst-forming units-erythroid [BFU-E]), whereas Ter119-positive cells do not generate colonies.9,33 Chromatin from the sorted cells was cross-linked, sheared, and precipitated with a high affinity anti-HA antibody, which increases both the specificity and recovery of EKLF-associated chromatin. We performed 2 biologic and 2 technical replicates of HA-EKLF–enriched chromatin fragments from progenitor cells and erythroblasts, generating 3.50 × 10⁷ reads from progenitor cell chromatin, 3.54 × 10⁷ reads from erythroblast chromatin, and 3.52 × 10⁷ reads from input chromatin. Using the Eland V2 software, 2.68 × 10⁷ progenitor cell tags (76.7%) and 2.69 × 10⁷ (75.9%) erythroblast sequence tags were mapped to the reference mouse genome (mm9).
ChIP-Seq analysis of EKLF occupancy in primary erythroid progenitor cells and erythroblasts. (A) Day E13.5 fetal liver cells from HA-tagged EKLF mice were FACS sorted into populations of erythroid progenitor cells (TER119−) and erythroblasts (CD71+ TER119+). The cells were cross-linked and the chromatin processed for immune precipitation with an anti-HA antibody followed by massively parallel sequencing (ChIP-Seq). Peaks of EKLF occupancy were determined using the program MACS. (B) EKLF peaks were identified that are specific to progenitor cells (4472), erythroblasts (6490), and common to both populations (8753). (C) EKLF occupancy in the mouse Ank1 locus. Top panel: Organization of the Ank1 locus on the UCSC browser. The 3 alternative promoters (Ank1A, Ank1B, and the erythroid-specific Ank1E) are indicated along with the direction of transcription (arrows). The Control, Pro, and Ery tracks represent the sequence reads derived from libraries of input chromatin or HA-enriched chromatin from progenitor cells or erythroblasts, respectively. The bars in the MACS Pro and MACS Ery tracks represent the EKLF peaks (at the p06 level of significance) identified by MACS in the progenitor cell and erythroblast data, respectively. *An unannotated repetitive sequence that is mapped to this location in both the control and HA-enriched chromatin. Several of these sites were chosen for validation by PCR-based ChIP analysis. White bars represent the mean (± SD) fold enrichment in HA-enriched chromatin from unfractionated day E13.5 fetal liver cells compared with input chromatin (black bars). Sites 9, 11, 12, and 14 were selected as negative controls and show no significant enrichment. Peaks 10 and 13 are seen in progenitor cells or erythroblasts, respectively. Both show significant enrichment (P < .0001).
ChIP-Seq analysis of EKLF occupancy in primary erythroid progenitor cells and erythroblasts. (A) Day E13.5 fetal liver cells from HA-tagged EKLF mice were FACS sorted into populations of erythroid progenitor cells (TER119−) and erythroblasts (CD71+ TER119+). The cells were cross-linked and the chromatin processed for immune precipitation with an anti-HA antibody followed by massively parallel sequencing (ChIP-Seq). Peaks of EKLF occupancy were determined using the program MACS. (B) EKLF peaks were identified that are specific to progenitor cells (4472), erythroblasts (6490), and common to both populations (8753). (C) EKLF occupancy in the mouse Ank1 locus. Top panel: Organization of the Ank1 locus on the UCSC browser. The 3 alternative promoters (Ank1A, Ank1B, and the erythroid-specific Ank1E) are indicated along with the direction of transcription (arrows). The Control, Pro, and Ery tracks represent the sequence reads derived from libraries of input chromatin or HA-enriched chromatin from progenitor cells or erythroblasts, respectively. The bars in the MACS Pro and MACS Ery tracks represent the EKLF peaks (at the p06 level of significance) identified by MACS in the progenitor cell and erythroblast data, respectively. *An unannotated repetitive sequence that is mapped to this location in both the control and HA-enriched chromatin. Several of these sites were chosen for validation by PCR-based ChIP analysis. White bars represent the mean (± SD) fold enrichment in HA-enriched chromatin from unfractionated day E13.5 fetal liver cells compared with input chromatin (black bars). Sites 9, 11, 12, and 14 were selected as negative controls and show no significant enrichment. Peaks 10 and 13 are seen in progenitor cells or erythroblasts, respectively. Both show significant enrichment (P < .0001).
Peaks of EKLF occupancy were identified using the MACS program, which identifies EKLF-enriched peaks at preset significance levels. We examined EKLF occupancy across the genome at the P < 10−5 (p05) and P < 10−6 (p06) significance levels in both progenitor and erythroblast chromatin. In progenitor cell chromatin, we identified 16 640 and 13 006 EKLF peaks at the p05 and p06 significance levels, respectively, whereas in erythroblast chromatin we identified 17 953 and 15 476 peaks at p05 and p06, respectively. Based on these data, we concluded that analyses at the p06 significance level would be both stringent and comprehensive. At the p06 significance level, we identified 4319 and 6519 peaks that were specific to progenitor and erythroblast chromatin, respectively, leaving 8753 peaks that were common to both progenitors and erythroblast chromatin (overlapping peaks were counted once resulting in a slightly lower total; Figure 1B).
The Ank1 (ankyrin 1) locus contains examples of progenitor-specific, erythroblast-specific, and common peaks of EKLF occupancy (Figure 1C). Two positive Ank1 peaks, 4 adjacent negative regions, and an additional 24 positive peaks and 5 negative regions from other parts of the genome were selected for validation by conventional PCR-based ChIP analysis. In all cases, we demonstrated significant enrichment of EKLF in the regions containing identified peaks and no significant enrichment in the negative regions (Figure 1C; supplemental Table 1, see the Supplemental Materials link at the top of the article). We also evaluated 4 sites in the Ank1, Spnb1 (β-spectrin), and Cd44 loci that showed either progenitor specific or erythroblast specific EKLF occupancy. The cell type specific EKLF occupancy was confirmed in all cases (supplemental Figure 1).
Nonrandom EKLF occupancy across the genome
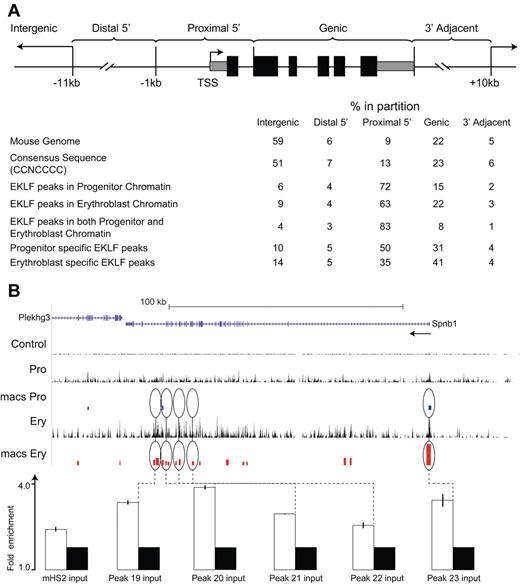
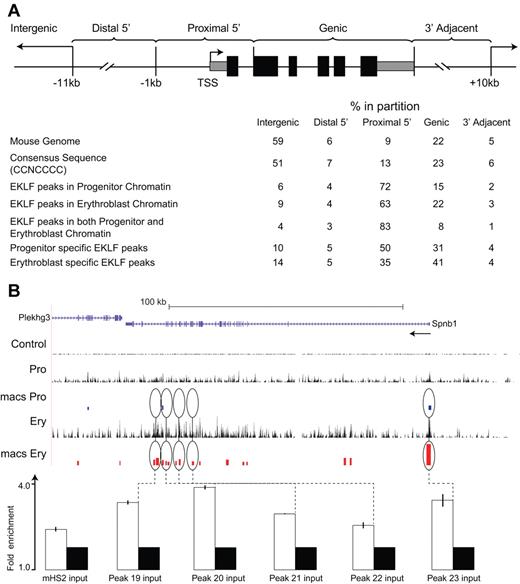
To determine whether EKLF occupancy was concentrated in a particular part of the genome, we divided the mouse genome into 5 discrete regions based on RefSeq gene annotation coordinates in the UCSC genome browser. The proximal upstream regions (proximal 5′: −1 kb relative to the TSS through intron 1) account for 9% of the mouse genome, the distal upstream regions (distal 5′: −11 kb to −1 kb relative to TSS) 6%, the gene-coding region (intragenic: RefSeq minus exon 1 and intron 1) 22%, the downstream region (3′ adjacent: 3′ end of the RefSeq coordinates to 10 kb) 5%, while the remainder of the genome (intergenic) accounts for 59% (see Methods; Figure 2A). The distribution of CCNCNCCCN consensus sequences in the genome followed this pattern and was not statistically different from a random distribution of this sequence in the genome.
Distribution of EKLF occupancy. (A) The mouse genome sequence was partitioned into 5 bins relative to RefSeq genes. The table shows the percentage of the genome represented by each bin (mouse genome), the distribution of the total CCNCNCCCN EKLF consensus binding sequences (consensus sequence), and the percentage of the total EKLF peaks for each bin. EKLF peaks in progenitor or erythroblast chromatin refer to all peaks identified in those cell populations. EKLF peaks in both progenitor and erythroblast chromatin refer to the subset of peaks found in both populations. Progenitor or erythroblast-specific EKLF peaks refers to the subset of peaks specific to that cell population. (B) EKLF occupancy in the mouse Spnb1 locus. Top panel: Organization of the Spnb1 locus on the UCSC browser. The direction of transcription is indicated (arrow). The Control, Pro, and Ery tracks represent the sequence reads derived from libraries of input chromatin or HA-enriched chromatin from progenitor cells or erythroblasts, respectively. The bars in the MACS Pro and MACS Ery tracks represent the EKLF peaks (at the p06 level of significance) identified by MACS in the progenitor cell and erythroblast data, respectively. Several of these sites were chosen for validation by PCR-based ChIP analysis. White bars represent the mean (± SD) fold enrichment in HA-enriched chromatin from unfractionated day E13.5 fetal liver cells compared with input chromatin (black bars). Peaks 19 to 23 are located in intragenic regions of erythroblast chromatin. All show significant enrichment (P < .0001).
Distribution of EKLF occupancy. (A) The mouse genome sequence was partitioned into 5 bins relative to RefSeq genes. The table shows the percentage of the genome represented by each bin (mouse genome), the distribution of the total CCNCNCCCN EKLF consensus binding sequences (consensus sequence), and the percentage of the total EKLF peaks for each bin. EKLF peaks in progenitor or erythroblast chromatin refer to all peaks identified in those cell populations. EKLF peaks in both progenitor and erythroblast chromatin refer to the subset of peaks found in both populations. Progenitor or erythroblast-specific EKLF peaks refers to the subset of peaks specific to that cell population. (B) EKLF occupancy in the mouse Spnb1 locus. Top panel: Organization of the Spnb1 locus on the UCSC browser. The direction of transcription is indicated (arrow). The Control, Pro, and Ery tracks represent the sequence reads derived from libraries of input chromatin or HA-enriched chromatin from progenitor cells or erythroblasts, respectively. The bars in the MACS Pro and MACS Ery tracks represent the EKLF peaks (at the p06 level of significance) identified by MACS in the progenitor cell and erythroblast data, respectively. Several of these sites were chosen for validation by PCR-based ChIP analysis. White bars represent the mean (± SD) fold enrichment in HA-enriched chromatin from unfractionated day E13.5 fetal liver cells compared with input chromatin (black bars). Peaks 19 to 23 are located in intragenic regions of erythroblast chromatin. All show significant enrichment (P < .0001).
Peaks of EKLF occupancy in progenitor and erythroblast chromatin were significantly over-represented in the proximal 5′ region (72% and 63%, respectively) and significantly under-represented in the intergenic region (6% and 9%, respectively), compared with the distribution of genomic CCNCNCCCN sequences (all P < 10−7 by χ2 test; Figure 2A). Enrichment for EKLF occupancy was most pronounced in the subset of peaks that were observed in both progenitor and erythroblast chromatin (common), with 83% of peaks in the proximal 5′ region and 4% in the intergenic region (P < 10−10). Among the progenitor- and erythroblast-specific peaks, EKLF occupancy was over-represented in the proximal 5′ region (50% and 35%, respectively; both P < 10−5) but was significantly lower in erythroblast chromatin compared with progenitor chromatin (P < 10−3). Conversely, EKLF occupancy was over-represented in the intragenic region of erythroblast chromatin compared with progenitor chromatin (41% and 31%, respectively; P < 10−2; Figure 2A). The Spnb locus (Figure 2B; supplemental Figure 1) shows examples of peaks of EKLF occupancy in the proximal 5′ region in both progenitor and erythroblast chromatin and additional intragenic EKLF peaks specific to erythroblast chromatin, including validation of selected sites (Figure 2B; supplemental Figure 1). These results demonstrate that EKLF occupies different partitions of the genome in progenitor cell and erythroblast chromatin.
To determine whether EKLF maintains a preference for the CCNCNCCCN motif in vivo, we interrogated the DNA sequences beneath the peaks of EKLF occupancy in the 5 genomic regions using the MEME program. We considered a motif to be meaningful if it did not overlap with an adjacent motif and was represented in 100 or more input sequences. The top motifs in each genomic partition were all CG rich and closely resemble the consensus motif, with the exception of an AG-rich motif found in 6.9% of proximal 5′ regions in erythroblast chromatin (supplemental Table 2).
Location of EKLF in the nucleus
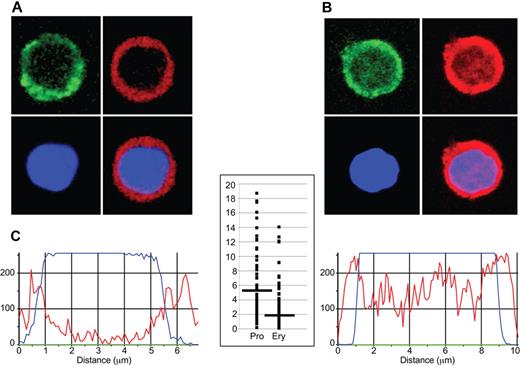
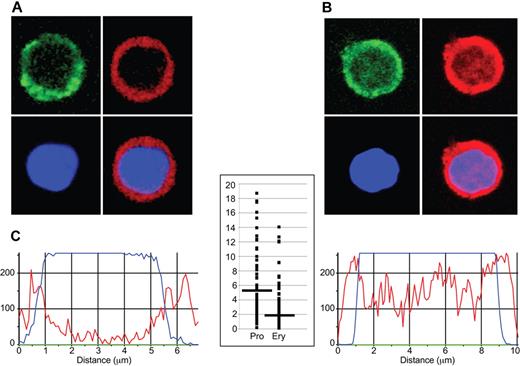
To determine whether differences in genome-wide EKLF occupancy during erythropoiesis correlated with changes in nuclear localization of EKLF, we performed confocal microscopy on progenitor cells and erythroblasts stained with a fluorescent anti-HA antibody. Nonerythroid control cells were negative for anti-HA staining. Similar to previous studies,37,38 we found EKLF staining in the cytoplasm as well as in the nucleus. The nuclear EKLF signal, which we define as overlapping with the DAPI DNA stain, was higher at the periphery of progenitor cell nuclei (peripheral EKLF/central EKLF ratio, 5.17 ± 4.96; Figure 3A,C); whereas in erythroblast nuclei, the EKLF signal was detected at both the periphery and the central nuclear region (peripheral EKLF/central EKLF ratio, 2.15 ± 1.99; P < 10−13; Figure 3B-C). These data indicate that EKLF is located in different locations in the nucleus in progenitor and erythroblast chromatin.
Immunohistochemical analysis of EKLF in progenitor cell and erythroblast nuclei. Day E13.5 fetal liver cells from HA-tagged EKLF mice were FACS sorted into populations of erythroid progenitor cells (A; CD71+ TER119−) and erythroblasts (B; CD71+ TER119+). The cells were fixed and stained with DAPI (DNA) and an AlexaFluor-594–conjugated anti-HA antibody to identify EKLF in individual cells. (A-B) The top left images represent CD71 staining (green); top right images, EKLF (red); bottom left images, DNA (blue); and bottom right images, the EKLF and DNA images merged. Magenta represents nuclear EKLF. (C) Quantification of EKLF distribution in individual nuclei. The blue tracings represent the relative amount of DAPI signal, and the red tracings represent the relative amount of AlexaFluor-594 signal (EKLF) across an individual progenitor cell (left) or erythroblast (right). The y-axis on the graph in the center represents the ratio of the EKLF-to-DNA signal in the peripheral 20% of the nucleus (10% each side) to the ratio of the EKLF-to-DNA signal in the central 20% of the nucleus for progenitor cells (Pro) and erythroblasts (Ery). A total of 8 peripheral and 8 central data points from 30 nuclei were analyzed for a total of 240 points in each cell type. Images were acquired at room temperature using a Zeiss LSM 510 NLO Meta system mounted on a Zeiss Axiovert 200M microscope with an oil immersion Plan-Apochromat 63×/1.4 DIC objective lens. Excitation wavelengths of 488 nm (3%), 561 nm (6%), and 770 nm (3%) were used to detect anti-CD71 FITC, anti-HA–AlexaFluor-594, and DAPI, respectively. Fluorescent emissions were collected in a BP 500- to 550-nm IR blocked filter, BP 575- to 615-nm IR blocked filter, BP 641- to 705-nm custom filter, and a BP 390- to 465-nm IR blocked filter, respectively. All pinholes were set with a range from 1.11 to 1.33 Airy units, corresponding to an optical slice of 1.0 μm (excluding the DAPI channel where a multiphoton laser was used). All confocal images were of frame size 512 × 512 pixels, scan zoom of 3, and line averaged 8 times. Confocal images were postprocessed using MediaCybernetics' Image-Pro Plus Version 7.0 software package. Each image was processed using a built-in Line Profile tool. A line was drawn through the middle of each cell to determine the density of red (EKLF) and blue (DAPI) signals in the middle 20% of the nucleus and on both edges (10% each side).
Immunohistochemical analysis of EKLF in progenitor cell and erythroblast nuclei. Day E13.5 fetal liver cells from HA-tagged EKLF mice were FACS sorted into populations of erythroid progenitor cells (A; CD71+ TER119−) and erythroblasts (B; CD71+ TER119+). The cells were fixed and stained with DAPI (DNA) and an AlexaFluor-594–conjugated anti-HA antibody to identify EKLF in individual cells. (A-B) The top left images represent CD71 staining (green); top right images, EKLF (red); bottom left images, DNA (blue); and bottom right images, the EKLF and DNA images merged. Magenta represents nuclear EKLF. (C) Quantification of EKLF distribution in individual nuclei. The blue tracings represent the relative amount of DAPI signal, and the red tracings represent the relative amount of AlexaFluor-594 signal (EKLF) across an individual progenitor cell (left) or erythroblast (right). The y-axis on the graph in the center represents the ratio of the EKLF-to-DNA signal in the peripheral 20% of the nucleus (10% each side) to the ratio of the EKLF-to-DNA signal in the central 20% of the nucleus for progenitor cells (Pro) and erythroblasts (Ery). A total of 8 peripheral and 8 central data points from 30 nuclei were analyzed for a total of 240 points in each cell type. Images were acquired at room temperature using a Zeiss LSM 510 NLO Meta system mounted on a Zeiss Axiovert 200M microscope with an oil immersion Plan-Apochromat 63×/1.4 DIC objective lens. Excitation wavelengths of 488 nm (3%), 561 nm (6%), and 770 nm (3%) were used to detect anti-CD71 FITC, anti-HA–AlexaFluor-594, and DAPI, respectively. Fluorescent emissions were collected in a BP 500- to 550-nm IR blocked filter, BP 575- to 615-nm IR blocked filter, BP 641- to 705-nm custom filter, and a BP 390- to 465-nm IR blocked filter, respectively. All pinholes were set with a range from 1.11 to 1.33 Airy units, corresponding to an optical slice of 1.0 μm (excluding the DAPI channel where a multiphoton laser was used). All confocal images were of frame size 512 × 512 pixels, scan zoom of 3, and line averaged 8 times. Confocal images were postprocessed using MediaCybernetics' Image-Pro Plus Version 7.0 software package. Each image was processed using a built-in Line Profile tool. A line was drawn through the middle of each cell to determine the density of red (EKLF) and blue (DAPI) signals in the middle 20% of the nucleus and on both edges (10% each side).
Correlation of mRNA expression with EKLF occupancy
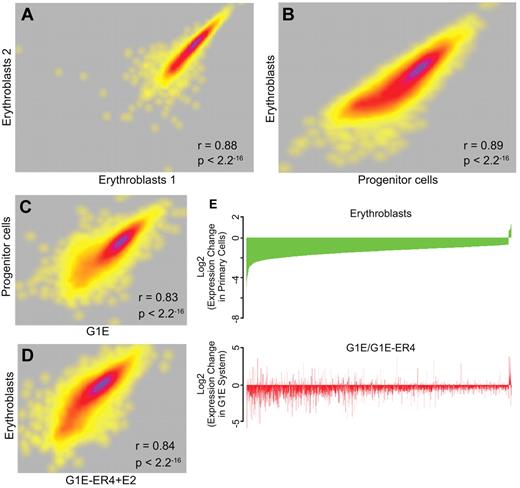
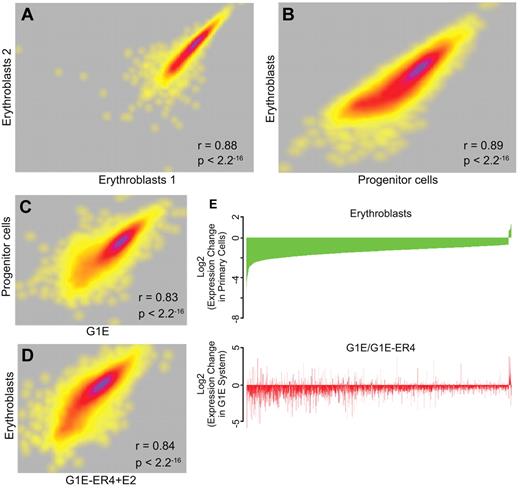
We performed a comprehensive genome-wide RNA-Seq analysis of mRNA levels in biologic replicates of sorted progenitor cells and erythroblasts (Figure 4A). Sequenced reads were mapped to the UCSC mouse mm9 assembly to determine expression levels. Of 6116 genes expressed at significant levels, a pair-wise comparison using the RPKM metric for gene expression determined that 3110 genes were differentially expressed (≥ 2-fold change) between progenitor cells and erythroblasts (Figure 4B), whereas the mRNA levels of 1982 genes did not change (fold change ∼ 1; 1024 genes had ambiguous changes between 1- and 2-fold). Of the differentially expressed genes, 2477 were expressed at higher levels in progenitor cells, whereas 633 were expressed at higher levels in erythroblasts. These data are in agreement with previous descriptions of differential gene expression in primary WT erythroid cells by ourselves and others.9,12,13
RNA-Seq analysis of transcript levels in primary erythroid progenitor cells and erythroblasts. RNA was extracted from E13.5 fetal liver progenitor cells and erythroblasts, and from G1E cells and G1E-ER4 + E2 cells. The RNA was converted to cDNA followed by massively parallel sequencing (RNA-Seq). (A) A correlation plot comparing the levels of expressed exons in biologic replicates of erythroblast RNA showing a high degree of reproducibility. Each dot represents a gene, and the density of genes showing similar expression changes is represented by the heat map, with purple indicating a greater number of exons and yellow indicating a lower number of exons at each point. (B) A correlation plot comparing the levels of expressed genes in primary erythroblasts and progenitor cells showing distinct transcript profiles in the 2 populations. (C) A correlation plot comparing the levels of expressed genes in G1E cells and primary progenitor cells showing significant similarity in the transcript profiles. (D) A correlation plot comparing the levels of expressed genes in G1E-ER4 + E2 cells and primary erythroblasts showing significant similarity in the transcript profiles. (E) Top panel: An analysis of the changes in the level of genes that are dysregulated in primary erythroblasts compared with progenitor cells (green). The genes are organized from most down-regulated at the left to most up-regulated at the right. Bottom panel: An analysis of the same dysregulated genes in G1E-ER4 + E2 cells compared with G1E cells (red). Approximately 85% of the dysregulated genes change their expression levels in the same direction.
RNA-Seq analysis of transcript levels in primary erythroid progenitor cells and erythroblasts. RNA was extracted from E13.5 fetal liver progenitor cells and erythroblasts, and from G1E cells and G1E-ER4 + E2 cells. The RNA was converted to cDNA followed by massively parallel sequencing (RNA-Seq). (A) A correlation plot comparing the levels of expressed exons in biologic replicates of erythroblast RNA showing a high degree of reproducibility. Each dot represents a gene, and the density of genes showing similar expression changes is represented by the heat map, with purple indicating a greater number of exons and yellow indicating a lower number of exons at each point. (B) A correlation plot comparing the levels of expressed genes in primary erythroblasts and progenitor cells showing distinct transcript profiles in the 2 populations. (C) A correlation plot comparing the levels of expressed genes in G1E cells and primary progenitor cells showing significant similarity in the transcript profiles. (D) A correlation plot comparing the levels of expressed genes in G1E-ER4 + E2 cells and primary erythroblasts showing significant similarity in the transcript profiles. (E) Top panel: An analysis of the changes in the level of genes that are dysregulated in primary erythroblasts compared with progenitor cells (green). The genes are organized from most down-regulated at the left to most up-regulated at the right. Bottom panel: An analysis of the same dysregulated genes in G1E-ER4 + E2 cells compared with G1E cells (red). Approximately 85% of the dysregulated genes change their expression levels in the same direction.
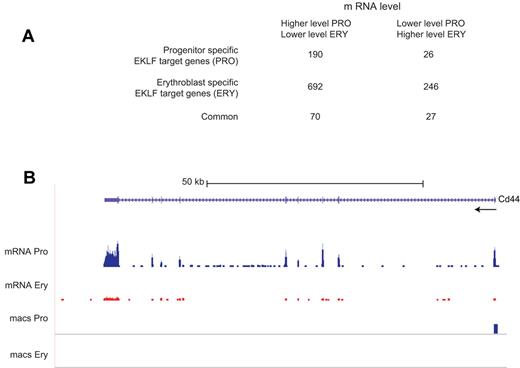
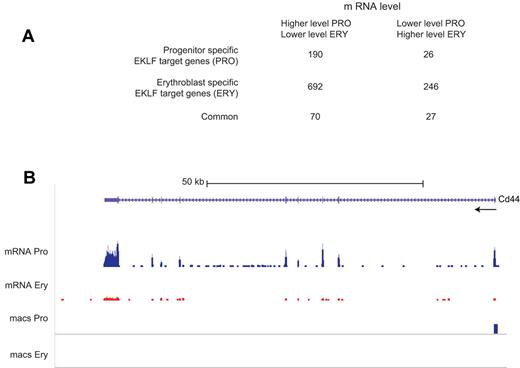
Approximately 40% of both the differentially expressed and nondifferentially expressed genes were EKLF target genes. Progenitor-specific EKLF occupancy was associated with 216 (∼ 7%) differentially expressed genes (Figure 5A; supplemental Table 3). Consistent with the hypothesis that EKLF acts as a transcriptional activator, the mRNA level of 190 of the progenitor-specific EKLF target genes is lower in erythroblasts, where EKLF is no longer bound. The mRNA levels of 26 (7-fold fewer) progenitor-specific EKLF target genes increases in erythroblasts, consistent with the hypothesis that EKLF can act as a transcriptional repressor. EKLF responsive genes can be demonstrated genetically by a comparison of mRNA levels in similar populations of WT and Klf1−/− cells. Of the 190 progenitor-specific EKLF target genes whose mRNA levels decrease in erythroblasts, 44 showed significant differences in mRNA levels between WT and Klf1−/− progenitor cells in our previous study. Approximately 93% (41 of 44) genes had decreased mRNA levels in Klf1−/− progenitor cells, demonstrating that EKLF is required for activation of these genes. An example is the Cd44 locus, which has a progenitor cell-specific EKLF peak in the proximal 5′ region (supplemental Figure 1), has higher levels of mRNA in progenitor cells compared with erythroblasts (Figure 5B), and has lower levels of mRNA in Klf1−/− progenitor cells.9 Of the 26 progenitor-specific EKLF target genes whose expression is increased in erythroblasts, 5 showed significant differences in expression between WT and Klf1−/− progenitor cells, and 4 of these genes had increased expression in Klf1−/− progenitor cells, demonstrating that EKLF acts as a repressor of these genes.
Analysis of EKLF binding and mRNA levels. EKLF peaks were assigned to the nearest gene to generate a list of EKLF target genes, which was compared with the genes showing differences in transcript levels between progenitor cells and erythroblasts. (A) A table showing the number of EKLF target genes whose mRNA level changes between the progenitor cell and erythroblast populations. EKLF target genes are divided into those that are specific to progenitor cells, specific to erythroblasts, or common to both populations. (B) EKLF occupancy and mRNA expression in the mouse Cd44 locus. The UCSC browser shows the organization of the Cd44 locus and direction of transcription at the top. The mRNA Pro RNA and mRNA Ery RNA tracks represent the RNA-Seq reads derived from progenitor cells and erythroblasts, respectively, demonstrating higher levels of Cd44 mRNA in progenitor cells. The bars in the MACS Pro and MACS Ery tracks represent the EKLF peaks (at the p06 level of significance) identified by MACS in the progenitor cell and erythroblast chromatin, respectively. EKLF occupancy is only seen in progenitor cells.
Analysis of EKLF binding and mRNA levels. EKLF peaks were assigned to the nearest gene to generate a list of EKLF target genes, which was compared with the genes showing differences in transcript levels between progenitor cells and erythroblasts. (A) A table showing the number of EKLF target genes whose mRNA level changes between the progenitor cell and erythroblast populations. EKLF target genes are divided into those that are specific to progenitor cells, specific to erythroblasts, or common to both populations. (B) EKLF occupancy and mRNA expression in the mouse Cd44 locus. The UCSC browser shows the organization of the Cd44 locus and direction of transcription at the top. The mRNA Pro RNA and mRNA Ery RNA tracks represent the RNA-Seq reads derived from progenitor cells and erythroblasts, respectively, demonstrating higher levels of Cd44 mRNA in progenitor cells. The bars in the MACS Pro and MACS Ery tracks represent the EKLF peaks (at the p06 level of significance) identified by MACS in the progenitor cell and erythroblast chromatin, respectively. EKLF occupancy is only seen in progenitor cells.
Erythroblast-specific EKLF occupancy was found in 938 (∼ 30%) differentially expressed genes (Figure 5A). The mRNA levels of 246 erythroblast-specific EKLF target genes are higher in erythroblasts than in progenitor cells, suggesting that EKLF acts as a transcriptional activator. The mRNA levels of 692 (2.8-fold more) erythroblast-specific EKLF target genes decrease in erythroblasts, suggesting that EKLF acts as a transcriptional repressor. These hypotheses cannot be tested genetically because Klf1−/− mice do not have an erythroblast population.9 A total of 97 (∼ 3%) differentially expressed genes were associated with EKLF occupancy in both populations (Figure 5A).
Bioinformatic analysis using the Ingenuity Systems Knowledge Base indicated that, in progenitor cells, EKLF target genes were significantly associated with annotated pathways representing general cellular metabolism, DNA replication, cell cycle control, and development. In erythroblasts, the cell cycle control and DNA replication pathways were associated with genes that decreased expression; whereas among the genes that increased expression, the cell maintenance and hematologic system development pathways were the most significantly represented (Table 1). Genes in the latter group include α-globin, β-globin, Ank1, Slc4a1, and Spnb. Parallel analysis using the MetaCore analysis suite confirmed these findings, with general cell developmental pathways enriched among progenitors and hematopoietic development predominating among erythroblasts.
Comparison of the EKLF and GATA2, GATA1, and TAL1 interactomes
Previous studies27,39,40 have described the interactomes of mouse GATA2, GATA1, and TAL1 in undifferentiated G1E cells, which resemble progenitor cells, and estradiol-induced G1E-ER4 + E2 cells, which resemble erythroblasts. A comparison of the expressed genes in each cell type demonstrated that ∼ 84% of the genes expressed in primary progenitor cells were also expressed in G1E cells. Similarly, ∼ 94% of the genes expressed in primary erythroblasts were also expressed in G1E-ER4 + E2. To determine the degree of similarity between these cell types, we directly compared the RNA-Seq transcript profiles of the equivalent primary and cultured cell types. The levels of the expressed genes in primary progenitor cells and G1E cells (Figure 4C) were highly correlated (Pearson r = 0.83, P < 2 × 10⁻¹⁶), as were the levels of the expressed genes in primary erythroblasts and G1E-ER4 + E2 cells (Figure 4D; Pearson r = 0.84, P < 2 × 10⁻¹⁶).
We also compared the change in expression during differentiation as a ratio of the change in the read count between G1E-ER4 + E2 and G1E cells, and primary erythroblasts and progenitors. Focusing on the genes that are differentially regulated during the differentiation of primary progenitors to erythroblasts, ∼ 85% of the genes that are induced (or repressed) are also induced (or repressed) during differentiation of the G1E-ER4 cell line (Figure 4E). The changes in mRNA levels between the 2 cell systems are highly correlated (Pearson's r = 0.38, P < 2.2 × 10⁻¹⁶; Figure 4E). We conclude that the transcript profiles of G1E cells and primary progenitor cells, and induced G1E-ER4 + E2 cells and primary erythroblasts, are sufficiently similar that meaningful comparisons can be made between transcription factor occupancy between the primary cells and the G1E cell system.
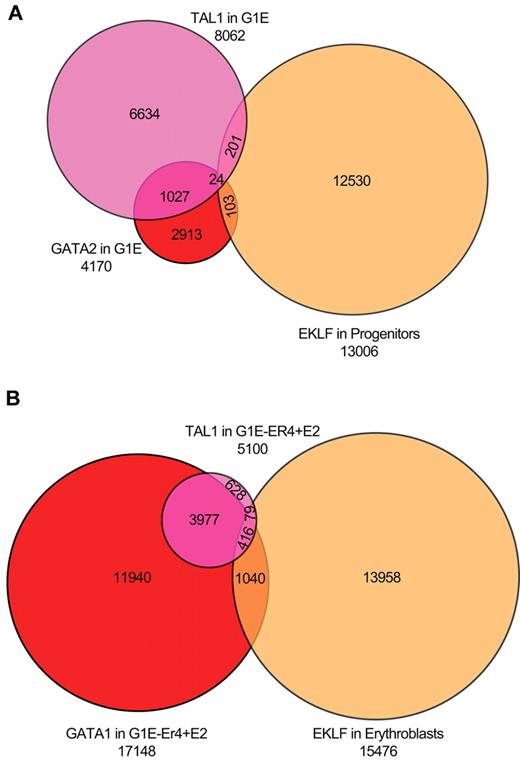
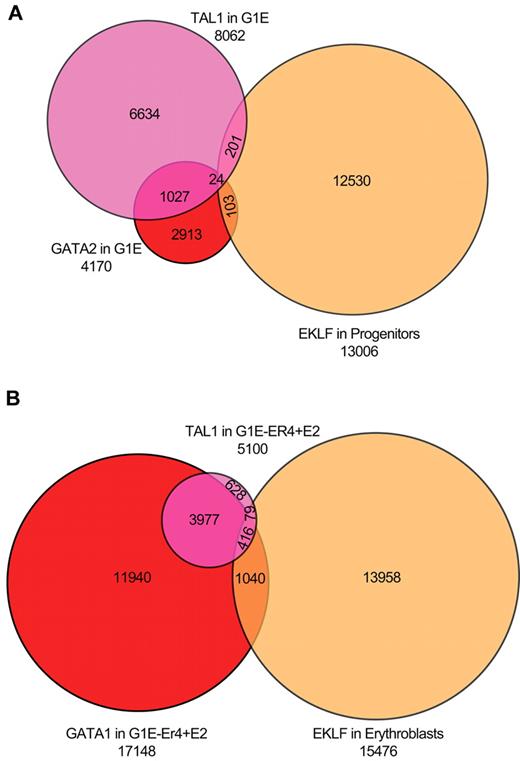
We directly compared EKLF occupancy in progenitor cells and erythroblasts with GATA1/2 and TAL1 occupancy in G1E (GATA2 and TAL) and G1E-ER4 + E2 (GATA1 and TAL) chromatin.27,39,40 A total of 8062 and 4170 DNA segments were occupied by TAL1 or GATA2 in the G1E cells. Of the TAL1-occupied sequences, 1068 (13%) were also bound by GATA2, whereas only 306 (3.8%) TAL1 sequences were occupied by EKLF. Of the GATA2-occupied sequences, 134 (3.2%) were also occupied by EKLF in primary progenitor cells, with no involvement of TAL1. A total of 54 sequences were occupied by all 3 transcription factors (Figure 6A). In G1E-ER4 + E2 cells, we identified 17 148 and 5100 DNA sequences occupied by GATA1 and TAL1, respectively. We found greater co-occupancy between GATA1- and TAL1-occupied regions in differentiated G1E-ER4 + E2 cells, with 3977 (78%) of the TAL1 sites also occupied by GATA1. In contrast, only 79 (1.5%) of the TAL1-occupied sequences also showed EKLF occupancy in primary erythroblasts. A larger proportion of GATA1-occupied sequences (6.0%; 1040 sequences) were occupied by EKLF. A total of 416 sequences were occupied by all 3 transcription factors (Figure 6B). We conclude that there is minimal overlap of EKLF, GATA1/2, and TAL1 occupancy. Tallack et al reported a more significant association of EKLF and GATA1 occupied sites in fetal liver cells.31 Of the 945 EKLF peaks identified by Tallack et al,31 454 (48%) were within 1 kb of a GATA1 site, suggesting that EKLF and GATA1 work in concert. In our analysis, we identified 413 of the 454 peaks identified by Tallack et al.31 However, these peaks compose a minority (14%) of the EKLF occupied segments in our study (supplemental Figure 2).
Overlap of EKLF peaks with sites occupied by GATA1, GATA2, and TAL1. (A) Venn diagram of EKLF-occupied DNA fragments in primary progenitor cells and TAL1- and GATA2-occupied DNA segments in G1E cells (which do not express GATA1), showing minimal co-occupancy of the 3 transcription factors. (B) Venn diagram of EKLF-occupied DNA fragments in primary erythroblasts and TAL1- and GATA1-occupied DNA segments in induced G1E-ER4 + E2 cells, showing significant co-occupancy by GATA1 and TAL1, and much less overlap with EKLF.
Overlap of EKLF peaks with sites occupied by GATA1, GATA2, and TAL1. (A) Venn diagram of EKLF-occupied DNA fragments in primary progenitor cells and TAL1- and GATA2-occupied DNA segments in G1E cells (which do not express GATA1), showing minimal co-occupancy of the 3 transcription factors. (B) Venn diagram of EKLF-occupied DNA fragments in primary erythroblasts and TAL1- and GATA1-occupied DNA segments in induced G1E-ER4 + E2 cells, showing significant co-occupancy by GATA1 and TAL1, and much less overlap with EKLF.
Discussion
In this report, we demonstrate that EKLF undergoes a dynamic relocalization during erythroid differentiation. In progenitor cells, EKLF most often occupies the promoter regions of genes, where it appears to act mainly as a transcriptional activator. In erythroblasts, EKLF is most often positioned within genes, and a majority of erythroblast-specific target genes appear to be repressed. These observations are in agreement with previous studies showing that EKLF can act either as a transcriptional activator or repressor, depending on its association with other proteins.16 We propose that the activator and repressor properties of EKLF may also be the result of the location of EKLF within the target locus. Our data indicate that it should be possible to determine whether post-translational modifications of EKLF are associated with activation, repression, or the location of EKLF.
EKLF also relocates within the nucleus from a peripheral location in progenitor cells to a more dispersed location in erythroblasts. These data are consistent with the observations of Schoenfelder et al, who showed that EKLF is associated with centrally located transcription factories in primary mouse erythroblast nuclei.38 They reported 82 genes in transcription factories associated with Hba (α-globin) or Hbb (β-globin). We show that 28 of these genes are EKLF target genes that are significantly up regulated in erythroblasts. Of the 28 EKLF target genes in transcription factories, 22 (∼ 80%) had erythroblast-specific EKLF occupancy, as opposed to progenitor-specific occupancy (3 of 28) or occupancy in both populations (3 of 28). Intragenic EKLF occupancy may be associated with transcriptional elongation; but because most EKLF target genes are repressed in erythroblasts, this cannot be a general mechanism. We propose that, at least in these 22 examples, erythroblast-specific EKLF occupancy is associated with organization of chromosomal neighborhoods41,42 and transcription factories located in the center of the nucleus.
Both our study and the study by Tallack et al31 demonstrated that the motif occupied by EKLF in vivo is similar to the CCNCNCCCN EKLF-binding motif developed through molecular modeling and in vitro analyses,43,44 with the refinement that in vivo EKLF favors A or C residues at position 3 and A or G residues at position 5. Although similar in many respects, our results differ from those of Tallack et al31 in several important areas. First, we observed ∼ 15-fold more EKLF binding sites, primarily because of both an increase in the number of sequences read and the number of sequence tags mapped to the genome. In addition, Tallack et al31 could not detect the relocalization of EKLF as their study was conducted on unfractionated primary fetal liver cells. Using unfractionated fetal liver cells, Tallack et al31 also may not have been able to detect some of the progenitor-specific and erythroblast-specific sites we observed in our study. Indeed, a comparison of the data of Tallack et al31 and our data showed the greatest overlap in the peaks that were common to both erythroblasts and progenitor cells. We conclude that the additional sites we have identified are an important part of the EKLF interactome not reported by Tallack et al.31
Our data indicate that, like GATA1 and TAL1,27-30 EKLF occupies < 0.5% of the potential EKLF-binding motifs in progenitor and erythroblast chromatin. Our comparison of GATA1, TAL1, and EKLF occupancy revealed that, whereas GATA1 and TAL1 frequently colocate at a single site in induced G1E-ER4 + E2 cells, EKLF is rarely associated with these regions. In agreement with results by Tallack et al,31 we found hundreds of EKLF-occupied segments that are also occupied by GATA1 and TAL1. However, these are a small minority of the EKLF-occupied segments found in our study. We propose a model in which there are at least 2 programs, one directed by GATA1 and a second by EKLF, that are required for normal erythropoiesis. This model is supported by differences in erythropoiesis between GATA1-, TAL1-, and EKLF-deficient mice. In GATA1- and TAL1-deficient mice, BFU-E and CFU-E, as well as megakaryocyte colony-forming cells, are absent.45-47 In contrast, in EKLF-deficient mice, megakaryopoiesis increases, and BFU-E and CFU-E are present, although they take longer to mature.9-11 We also find that the target genes for EKLF are enriched in late erythroid functions. From these data, we propose that GATA1 and TAL1 are required mainly for commitment of progenitor cells to an erythroid fate, whereas EKLF is required mainly for terminal erythroid differentiation.
This article contains a data supplement.
The publication costs of this article were defrayed in part by page charge payment. Therefore, and solely to indicate this fact, this article is hereby marked “advertisement” in accordance with 18 USC section 1734.
Acknowledgments
The authors thank Dr Amalia Dutra for expert assistance in preparing cells for the confocal microscope experiments.
This work was supported by NHGRI intramural funds (D.M.B., and E.H.M.), NIH Intramural Sequencing Center funds (J.C.M.), and the NIH (grants R01HL65448 and R01DK62039, P.G.G.; and grants R01DK065806 and RC2HG005573, R.C.H). This work was supported in part through instrumentation funded by the National Science Foundation (grant OCI-0821527, Penn State CyberSTAR computer).
National Institutes of Health
Authorship
Contribution: P.G.G., R.C.H., E.H.M., and D.M.B. designed the experiments; A.M.P., S.S.A., S.A.K., L.A.S., P.F.C., S.W., and S.M.A. performed the experiments; A.M.P., S.S.A., S.A.K., L.A.S., P.F.C., S.W., J.C.M., P.G.G., R.C.H., E.H.M., D.M.B., and the NISC Comparative Sequencing Center analyzed the results; and A.M.P., S.S.A., and S.A.K. wrote the manuscript.
Conflict-of-interest disclosure: The authors declare no competing financial interests.
Correspondence: David M. Bodine, NHGRI, NIH, 49 Convent Dr, Bldg 49, Rm 4A04, Bethesda, MD 20892-4424; e-mail: tedyaz@mail.nih.gov.
References
Author notes
A.M.P., S.S.A., and S.A.K. contributed equally to this study.

