Abstract
HIV-1 cell-to-cell transmission confers a strong advantage as it increases efficiency of transfer up to 100-fold compared with a cell-free route. Mechanisms of HIV-1 cell-to-cell transmission are still unclear and can in part be explained by the presence of actin-containing cellular protrusions. Such protrusions have been shown to facilitate cell-to-cell viral dissemination. Using fluorescence microscopy, electron tomography, and ion abrasion scanning electron microscopy we show that HIV-1 induces membrane extensions in immature dendritic cells through activation of Cdc42. We demonstrate that these extensions are induced after engagement of DC-SIGN by HIV-1env via a cascade that involves Src kinases, Cdc42, Pak1, and Wasp. Silencing of Cdc42 or treatment with a specific Cdc42 inhibitor, Secramine A, dramatically reduced the number of membrane protrusions visualized on the cell surface and decreased HIV-1 transfer via infectious synapses. Ion abrasion scanning electron microscopy of cell-cell contact regions showed that cellular extensions from immature dendritic cells that have the appearance of thin filopodia in thin section images are indeed extended membranous sheets with a narrow cross section. Our results demonstrate that HIV-1 binding on immature dendritic cells enhances the formation of membrane extensions that facilitate HIV-1 transfer to CD4+ T lymphocytes.
Introduction
Dendritic cells (DCs) are among the first potential targets for HIV-1 during mucosal transmission and participate in early dissemination of the virus.1,2 One of the important steps for HIV-1 propagation is the transfer of virus at the infectious synapse between DCs and CD4+ T cells.3 This mode of cell-to-cell propagation of the pathogen across the DC-T cell infectious synapse may confer several advantages to the virus as it offers a faster propagation as well as some level of immune evasion.4,5 Despite many advances in the understanding of transfer of HIV-1 infection from DCs to T cells,2,3,6-12 not much is known yet about the structural and biochemical mechanisms that are responsible for viral transfer by cell-to-cell transmission.
It has been reported that binding of HIV-1 to the C-type lectin receptor DC-SIGN7 on DC increases DC-T cell infectious synapse formation6 and that DC-SIGN engagement by HIV-1 induces activation of Rho-GTPases via the guanidine exchange factor LARG,8,9 which then presumably activates the kinase Raf-1.12 Alternatively, gp120-mediated activation of Pyk2, p38 MAP kinase, and LSP1 has also recently been implicated in DC migration after HIV-1 binding.10 Other signaling cascades in DCs, such as the Erk pathway11,12 and the Src/Syk pathway,15 might also be activated by HIV-1. These signaling programs triggered by DC-SIGN engagement suggest potential links between C-type lectin receptors activation on DCs and cytoskeletal remodeling. In addition to these mechanisms, Rho-GTPases are known to modulate cytoskeletal components and are required for a broad range of cellular functions, such as cell migration, trafficking, or cell polarity.13 Several bacterial pathogens have developed strategies to activate host cell Rho-GTPases to facilitate propagation, such as Shigella, which induces Cdc42 activation to facilitate bacterial invasion.14 Effector proteins of Salmonella can mimic functions of Rho-GTPases, thereby facilitating remodeling of actin cytoskeleton in host cells.15 Similar findings have been reported with herpes simplex virus type 1 (HSV-1) and African swine fever virus, which appear to induce membrane projections on target cells.16,17 The relative contribution of these actin-based protrusions during cell-to-cell transmission of HIV-1 is currently not fully established, although a recent study has attempted to tackle this question during T cell–T cell transmission of HIV-1,18 and recent 3D electron microscopic studies of the virologic synapse formed between mature DCs and CD4+ T cells have shown that there are extensive membrane extensions emanating from the DCs that wrap around the T cells.
Because DC-SIGN has previously been identified as a factor promoting DC-T cell infectious synapse formation,6,25 we investigated whether HIV-1 could trigger a signaling program that induces actin-based protrusions at the surface of DCs, thereby facilitating an anterograde viral transfer from DCs to CD4+ T cells across infectious synapses. Our results demonstrate a 2-step model for HIV-1 transfer from immature DCs to T cells that involves HIV-1env engagement of the DC-SIGN receptor, leading to Cdc42 activation and formation of membrane extensions, followed by the Cdc42-dependent transfer of virus to the T-cell.
Methods
Cells
Monocytes were purified after Ficoll gradient separation with CD14 MicroBeads (130-050-201; Miltenyi Biotec). CD14+ cells were obtained at purities > 95%. Human DCs were generated by incubating purified monocytes in complete Iscove modified Dulbecco medium supplemented with 500 IU/mL GM-CSF and 500 IU/mL IL-4 (both Strathman Biotec). DCs were harvested at day 6 and analyzed by flow cytometry. Resting autologous CD4+ T lymphocytes were purified by negative selection with CD4+ T Cell Isolation kit II (130-091-155; Miltenyi Biotec). Myeloid DCs (MyDCs) were purified by negative and positive selection with CD1c (BDCA-1)+ Dendritic Cell Isolation Kit (130-090-506; Miltenyi Biotec), as recently described.20 Jurkat (J77Cl.20) and resting autologous CD4+ T lymphocytes were maintained in complete RPMI 1640. 293T human embryonic kidney cells, and HeLa P4-R5 (#3580; National Institutes of Health AIDS Research & Reference Reagent Program) cells were maintained in DMEM.
Plasmids
The plasmids R9 and R9 INHA were provided by D. Trono (EPFL). S15 mCherry was a kind gift of T. Hope (Northwestern University, Chicago, IL). Enhanced green fluorescent protein (eGFP) vpr was generated by PCR cloning of vpr with primers 5′-TATACTGCAGGAATGGAACAAGCCCCAGAAGACC-3′ and 5′-TATAGGATCCGCTAGCTGGCCAGGATCGGT-3′ from pCMX.vpr96 and inserted into Pst1 and BamH1 sites of eGFP-C1 (Clontech). Full-length HIV-1–expressing F522Y-mutant HIV-1gp41 was previously described.21 pcDNA3-EGFP-Cdc42 (WT; 12599), pcDNA3-EGFP-Cdc42 (Q61L/ Constitutive Active; 12600), and pcDNA3-EGFP-Cdc42 (T17N/Dominant Negative; 12601) were from Addgene.
DC nucleofection
A total of 2 × 10⁶ immature DCs were nucleofected with 10 μg pcDNA of the different Cdc42 mutants with the Amaxa Nucleofector (AAD-1001) and the Human Dendritic Cell Nucleofector Kit I (VPA-1004). Cells were recovered in IMDM for 12 hours and subsequently analyzed for viability and eGFP expression by flow cytometry.
DC sorting
Nucleofected DCs expressing eGFP-tagged Cdc42 mutants were sorted 12 hours after transfection with a FACSVantage SE sorter (BD Biosciences). Cells were subsequently analyzed for viability, fraction enrichment, and CD1a and DC-SIGN cell surface expression 2 to 4 hours after sorting. Sorted DCs were then used for confocal microscope analysis, coculture experiments with T lymphocytes, and fusion-assay experiments.
Virus production
Virus stocks were produced by transient transfection of 293T cells with calcium-phosphate coprecipitated proviral plasmid pR9, which encodes for a full-length HIV-1×4 strain provirus. R9-eGFPvpr-S15mCherry was produced as described.22 Infectious titers of viral stocks were evaluated by limiting dilution on HeLa P4-R5 cells. Physical titers were evaluated by quantification of HIV-1 p24gag by ELISA kit (Beckman Coulter).
Drugs
All chemicals were obtained from Sigma-Aldrich unless stated otherwise. Puromycin 25 was used at 1μM. Cytochalasin D was diluted to 1, 2, or 10μM. Latrunculin A was used at 100nM or 1μM. Jasplakinolide (Calbiochem) was used at 100nM or 1μM. For transfer assays, indinavir (Merck) was used at 1 μg/mL and 50 μg/mL. Pronase (Roche Diagnostics) was diluted at concentrations ranging from 100 to 400 μg/mL. The specific Src kinase inhibitor 4-amino-5-(4-chlorophenyl)-7-(t-butyl)pyrazolo[3,4-d pyrimidine (PP2; Calbiochem) was used at a final concentration of 50μM. Secramine A was a kind gift from the Kirchhausen laboratory (Harvard Medical School) and the Hammond laboratory (University of Louisville) and was synthesized by Bo Xu and G. B. Hammond (University of Louisville).23
Antibodies and reagents
Antibodies against LARG (N-14), actin (C-11), Dia1 (N-16), and Arp3 (A1) were from Santa Cruz Biotechnology. Antibodies against CD3 (UCHT-1) and Rac1 (23A8) were from Millipore. Antibody against Cdc42 was from BD Transduction Laboratories. Anti-Src (#2108), anti–Phospho-Src (#2101), anti-Pak1 (#2602), anti–Phospho-Pak1 (#2605), and anti-Wasp (#4860) were from Cell Signaling Technology. Anti–phospho-WASP (NB100-2307) was obtained from Novus Biologicals. Anti–HIV-1-p24gag (KC57) was from Beckman Coulter. Anti-dsRed was from Clontech. Human anti–HIV-1 was from Immunodiagnostic. Fluorescence-activated cell sorter antibodies were obtained from BD Transduction Laboratories. Phalloidin AlexaFluor-546 and AlexaFluor-647 were from Invitrogen. Superantigens were obtained from Toxin Technology.
Infections and transfer assays
DCs (2.5 × 10⁵) were put in contact with 500 ng p24 HIV-1 overnight. Cells were then recovered, washed, and put in contact with CD4+ T lymphocytes at different ratios (5:1; 1:1, 1:5) for 96 hours in the presence of the protease inhibitor indinavir. Drugs, when used, were added to cocultures for 30 minutes before washing. Conjugates were recovered and stained for CD3 and HIV-1p24. The fraction of CD3-positivie cells (T lymphocytes) was analyzed for HIV-1p24 coexpression, thus representing the HIV-1–infected fraction of CD4+ T lymphocytes. Normalized HIV-1 transfer was defined as a comparison relative to nontreated condition artificially set at 100%.
Cdc42 activation assay
Active Cdc42 bound to Pak1 was recovered following the manufacturer's instructions (BK034; Cytoskeleton). The activated fraction of the total pool of available Cdc42 bound to its downstream target Pak1 was recovered. Pak1 bound to Pak1 binding domain beads was recovered by centrifugation. Input and pull-down fractions were subsequently analyzed for Cdc42 protein expression. Pull-down efficiency was analyzed with glutathione S-transferase (71-7500; Zymed) detection.
DC-T cell infectious synapses assay
Infectious synapse assays were performed as previously described.6,24 DCs (2.5 × 10⁵) were put in contact with 500 ng p24 HIV-1 overnight. Cells were then recovered, washed, and put in contact with CD4+ T lymphocytes at different ratios (5:1; 1:1, 1:5) for 30 minutes. Drugs, when used, were added to cocultures for 30 minutes before washing. Cells were then fixed with 3% paraformaldehyde for 20 minutes and processed for confocal microscopy. We defined an infectious synapse as a DC-T cell conjugate where the majority of HIV-1 (> 50%) is focused at the zone of contact with the Jurkat/resting autologous CD4+ T cells as previously described.3,6
Transmission electron microscopy
Cells were harvested and fixed in 2% formaldehyde plus 1.5% glutaraldehyde in 0.2M sodium phosphate buffer, pH 7.4, at room temperature for 2 hours. Cells were then washed once in sodium phosphate buffer and prepared for epon sectioning. After ultramicrotome sectioning, sections were analyzed with a Philips CM10 transmission electron microscope (Philips).
Electron tomography
Cells were fixed in glutaraldehyde, Epon-embedded, and stained with osmium tetroxide and uranyl acetate as described previously.25 Sections with nominal thicknesses of 100 nm and 175 nm were prepared using a Leica Ultracut microtome and imaged in a Tecnai 12 electron microscope (FEI Company) operated at 120 kV, and equipped with a 4K × 4K Gatan charge-coupled device. For tomography, images were recorded over an angular range of ± 70 degrees, and reconstructed to obtain a 3D volume using weighted back projection as implemented in the image processing package IMOD.26
Ion abrasion scanning electron microscopy
Cells were prepared using procedures identical to those used for the electron tomographic experiments. The resin blocks containing the cells were trimmed using a razor into a cube with approximate surface dimensions of 1 mm2. The cube was secured to an aluminum SEM stub using silver paint. The sample was then coated with a 100-nm layer of gold using a sputter coater before coating with platinum/palladium to a thickness of ∼ 1000 nm using the gas injector system of the microscope. The sample was imaged using a Nova 200 NanoLab dual-beam instrument (FEI) equipped with a Ga ion source for milling and a field emission gun scanning electron microscope with an in-lens secondary electron detector for imaging. Secondary electron scanning electron microscopy (SEM) images were typically recorded at an accelerating voltage of 3 kV, a magnification of 10 000×, and a beam current of 273 pA in the immersion lens mode, with a 5.0 mm working distance and a pixel size of 5.3 nm. Material was removed in step sizes of approximately 25 nm using the focused ion beam. Image segmentation was carried out using Amira (Visage Imaging).
Fusion assay
For analysis of virus fusion, HIV-1 labeled with eGFP-vpr and S15-mCherry was spinoculated onto cells, washed, and fixed in 4% paraformaldehyde immediately or after 2 to 3 hours of incubation at 37°C. Fixed cells were quenched in 0.1M glycine, mounted in Mowiol, and analyzed by CLSM (Zeiss LSM 510 Meta). Colocalization analysis was performed with ImageJ (National Institutes of Health) on an overlapping pixel area basis.
Live cell imaging
Cells were maintained at 37°C in a humidified-atmosphere cage incubator (Okolab). Image acquisition was performed using a 60× NA 1.4 oil objective (Nikon) on a spinning-disk confocal microscope (Ultraview; PerkinElmer Life and Analytical Sciences) upgraded with Andor Revolution, and controlled by the software Revolution iQ (Andor). Image sequences were processed and analyzed with ImageJ software (National Institutes of Health). Single particle trajectories were extracted from eGFP signals using a tracking algorithm and analyzed using Excel 2007 software (Microsoft).
siRNA transfections
DCs or MyDCs were transfected with siCtrl (5′-AAATGAACGTGAATTGCTCAA-3); siRNA sequence specific for luciferase, siDia1 (5′-AAGCTGGTCAGAGCCATGGAT-3); siRNA sequence specific for Dia1, siLarg (5′-AAGAAACTCGTCGCATCTTCC-3); siRNA sequence specific for LARG, all from QIAGEN. Alternatively, the following siRNA mixes were purchased from Santa Cruz Biotechnology: siRac1 (sc-36351), siCdc42 (sc-29256), siArp3 (sc-29739), and siMoesin (sc-35955). Transfections were performed twice using HiPerFect Transfection Reagent (QIAGEN) according to the manufacturer's recommendations. Specific gene knockdowns were assessed by Western blot followed by densitometry analysis (Quantity One; Bio-Rad).
Statistical analysis
Significant differences between groups were calculated using the Student t test. Only Student t test P values < .05 were considered significant. Unless stated otherwise, SDs are presented instead of SEM. Bonferroni test with an α-error value of 5% was applied to all panels with multiple comparisons.
Results
HIV-1 activates Cdc42 and induces membrane extensions in DCs
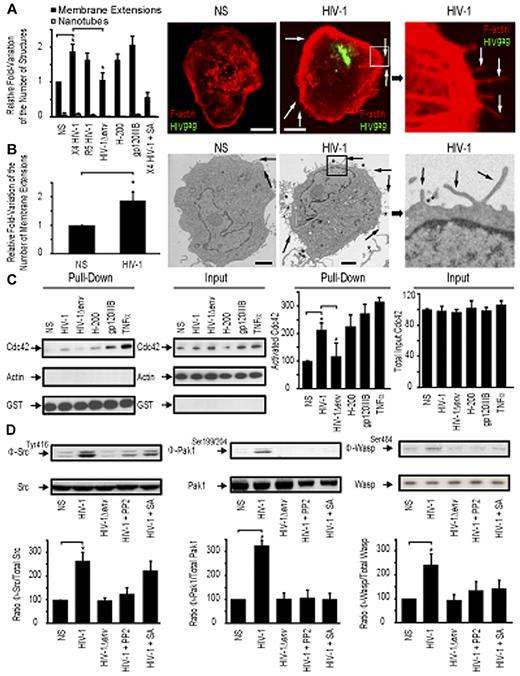
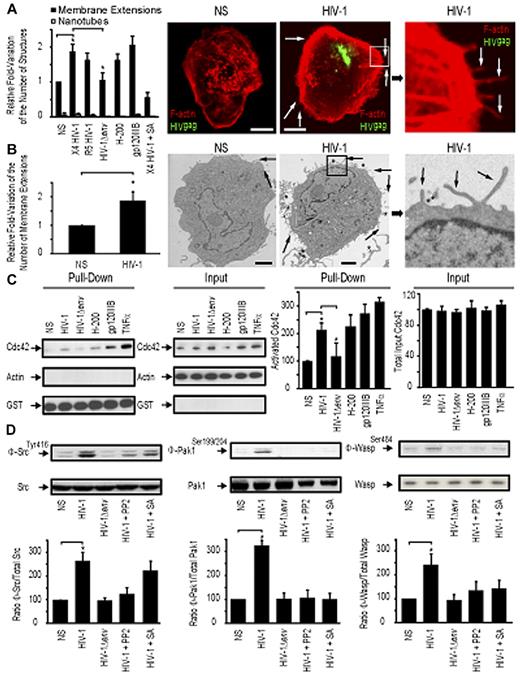
We first sought to determine the relative proportion of actin-containing structures at the surface of DCs with or without HIV-1 treatment. We refer to these as “membrane extensions” as the 3D electron microscopic studies presented in later figures provide more definitive insights into the nature of these membranous features. Incubation of HIV-1 for 1 hour with immature DCs leads to a measurable increase of the number of visible membrane extensions at the cell surface as determined by confocal microscopy (1.88-fold ± 0.19 increase; Figure 1A) and transmission electron microscopy (1.76-fold ± 0.34 increase; Figure 1B). Notably, this increase was found at the entire cell border of DCs, without obvious enrichment at infectious synapses with adjacent DCs or other sites of HIV-1 concentration. In addition, we also observed a relative increase in cortical actin density after contact with HIV-1. A similar increase in the number of membrane extensions on DC surface was observed with either a CXCR4-tropic (X4 HIV-1) or a CCR5-tropic HIV-1 (R5 HIV-1) (Figure 1A). No change in the number of membrane extensions was observed with envelope-deleted HIV-1 (HIV-1Δenv), suggesting that this process was dependent on HIV-1env, independent of its tropism (Figure 1A). Incubation of immature DCs with HIV-1env (trimeric gp120IIIb; 2 μg/mL) or a DC-SIGN agonist antibody (H-200) also resulted in an increase in membrane extensions at the surface of DC (2.01-fold ± 0.2 and 1.65-fold ± 0.16 increase, respectively), suggesting a role for engagement of the DC-SIGN receptor by the viral envelope in this process.
HIV-1 induces membrane extensions and Cdc42 activation in DCs. (A) Quantification by confocal microscopy of the number of membrane extensions or nanotubes in DCs either nonstimulated (NS) or stimulated with X4 HIV-1, R5 HIV-1, HIV-1Δenv, gp120IIIb, H-200, and X4 HIV-1 plus secramine A. Data are mean ± SD of 3 independent counts (left panel). Representative confocal images of DCs (right panel). Bar represents 5 μm. (B) Transmission electron microscopy images of HIV-1–treated DCs. Quantitation of the normalized number of membrane extensions on DCs after HIV-1 treatment. Data are mean ± SD of 2 independent counts (left panel) and corresponding representative images (right panel). Arrows indicate membrane extensions. *HIV-1 viral particles. Bar represents 2 μm. (C) Pull-down assay for activated Cdc42 in DC. Cdc42 expression by Western blot band quantitation. Data are mean ± SD of 3 independent pull-down experiments. (D) Western blot analysis for Phospho-Src (Φ-Src)/Src (left panel), Phospho-Pak1 (Φ-Pak1)/Pak1 (middle panel), and Phospho-Wasp (Φ-Wasp)/Wasp (right panel) detection in DCs. One representative Western blot per condition is represented. *P < .05 (Student t test).
HIV-1 induces membrane extensions and Cdc42 activation in DCs. (A) Quantification by confocal microscopy of the number of membrane extensions or nanotubes in DCs either nonstimulated (NS) or stimulated with X4 HIV-1, R5 HIV-1, HIV-1Δenv, gp120IIIb, H-200, and X4 HIV-1 plus secramine A. Data are mean ± SD of 3 independent counts (left panel). Representative confocal images of DCs (right panel). Bar represents 5 μm. (B) Transmission electron microscopy images of HIV-1–treated DCs. Quantitation of the normalized number of membrane extensions on DCs after HIV-1 treatment. Data are mean ± SD of 2 independent counts (left panel) and corresponding representative images (right panel). Arrows indicate membrane extensions. *HIV-1 viral particles. Bar represents 2 μm. (C) Pull-down assay for activated Cdc42 in DC. Cdc42 expression by Western blot band quantitation. Data are mean ± SD of 3 independent pull-down experiments. (D) Western blot analysis for Phospho-Src (Φ-Src)/Src (left panel), Phospho-Pak1 (Φ-Pak1)/Pak1 (middle panel), and Phospho-Wasp (Φ-Wasp)/Wasp (right panel) detection in DCs. One representative Western blot per condition is represented. *P < .05 (Student t test).
To test whether Cdc42 may have a role in formation of membrane extensions, we pretreated DCs coincubated with HIV-1 for 30 minutes with the specific Cdc42 inhibitor secramine A and observed that it efficiently blocked induction of additional membrane extensions (Figure 1A). We then analyzed whether HIV-1 was able to induce Cdc42 activation in DCs. Incubation of DCs for 10 minutes with HIV-1, HIV-1env (trimeric gp120IIIb), a DC-SIGN agonist antibody (H-200), or tumor necrosis factor-α triggered Cdc42 activation as determined by a pull-down affinity assay detecting specifically activated Cdc42 bound to its partner Pak1 (Figure 1C). In contrast, envelope-deleted HIV-1 (HIV-1Δenv) was unable to induce Cdc42 activation. Cdc42 activation was also inhibited by the addition of the Cdc42 inhibitor secramine A (data not shown)
We next investigated potential signaling events that could link DC-SIGN engagement and Cdc42 activation. Pak127 and Wasp28 have already been previously involved in membrane extensions formation, and Src kinases have been linked to DC-SIGN signaling in DCs29 and Cdc42 activation in other cell types.27 To analyze the relative activation of Src, Pak1, and WASP, we examined the proportion of phosphorylated proteins relative to their total cellular content. This allowed us to quantify their specific activation. We established that Src kinases Pak1 and Wasp were activated on incubation of DCs with wild type HIV-1, HIV-1env (trimeric gp120IIIb), a DC-SIGN agonist (antibody H-200), but not with HIV-1Δenv (Figure 1D). Interestingly, Cdc42 inhibition with secramine A or inhibition of Src kinases with PP2 indicated that Src activation on DC-SIGN engagement occurs upstream of Cdc42, Pak1, and Wasp activation (Figure 1D). These data suggest that Src kinases potentially provide a link between DC-SIGN engagement by HIV-1 envelope on DC surface and subsequent Cdc42, Pak1, and Wasp activation, thereby leading to an increase in membrane extensions at the DC surface.
Cdc42 is required for efficient HIV-1 transfer of infection to T lymphocytes but not for DC-T lymphocyte infectious synapse formation
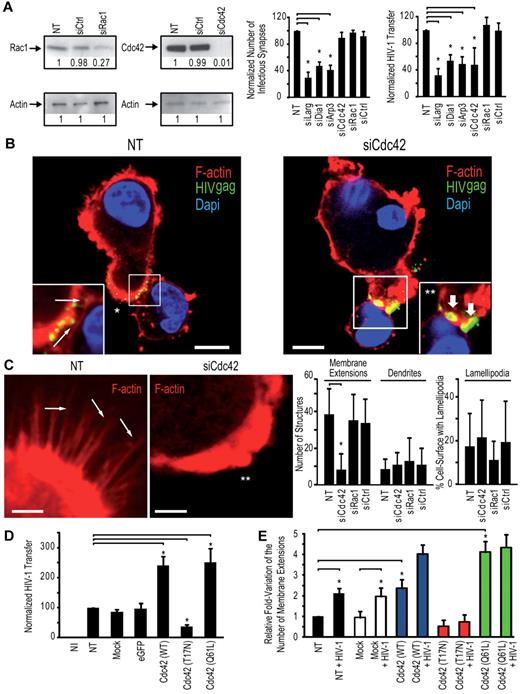
To dissect the role of key regulators of actin cytoskeleton in the transfer of HIV-1 infection from DCs to CD4+ T cells, we performed a systematic knock-down of the Rho-GTPases Rac1 and Cdc42, the mammalian diaphanous-related formin Dia1, the actin nucleation complex Arp2/3, the guanidine-exchange factor Larg, and the ERM complex protein moesin. Two rounds of transfection of immature DCs with a mix of 3 different siRNA targeting these cellular proteins lead to an efficient down-regulation of 75% to 95% depending on the protein tested (supplemental Figure 1A-B, available on the Blood Web site; see the Supplemental Materials link at the top of the online article). RNA interference of immature DCs did not result in significant toxicity (supplemental Figure 1C) or phenotypic maturation of immature DCs, as determined by surface levels of CD83 or HLA-DR (supplemental Figure 1D). We first determined the impact of the silencing of each protein on the formation of infectious synapses. Infectious synapses were determined as conjugates (ie, close cell-to-cell contacts) of DCs and T lymphocytes in which > 50% of HIV-1 was concentrated on the site of contact between the DCs and the T lymphocyte. Strikingly, silencing of Cdc42 exhibited a clearly different phenotype than Larg, Dia1, or Arp2/3 inhibition. Cdc42 knockdown in DCs had no impact on the number of DC-T cell infectious synapses (Figure 2A) but showed a clear decrease of transfer of HIV-1 infection to target Jurkat CD4+ T lymphocytes a single infection round assay (Figure 2A). In contrast, Rac1 silencing in DCs neither impaired DC-T cell infectious synapses formation nor abrogated the transfer of HIV-1 infection to Jurkat CD4+ T cells (Figure 2A; supplemental Figure 1E). Cdc42 and Rac1 knockdown in DC did not impair cell viability (supplemental Figure 1C) or HIV-1 capture (supplemental Figure 2). Imaging of the DC-T cell infectious synapse, 30 minutes after incubation of DCs with T cells, showed accumulation of HIV-1 particles at the zone of contact in the presence or absence of Cdc42, indicating that the mere concentration of virus at the DC-T cell infectious synapse was not sufficient to allow a complete transfer of HIV-1 infection to T cells and that this process of concentration appears to be independent of Cdc42 (Figure 2B). Taken together, these data demonstrate that HIV-1 transfer across DC-T cell infectious synapse requires Cdc42 but not Rac1. In contrast, Larg, Dia1, and Arp2/3 were required for infectious synapse formation (Figure 2A; supplemental Figure 1E). Silencing of these proteins in immature DCs did not reduce the number of DC-T cell conjugates (supplemental Figure 1F; with the exception of Arp2/3 complex), suggesting that loss of HIV-1 infection transfer was not the result of loss of contact between DCs and CD4+ T lymphocytes. Similarly, reduction in HIV-1 transfer could not be explained by increase in mortality or decreased DC-associated HIV-1 content (supplemental Figure 2). Similar results as for Larg and Dia1 silencing were obtained on Rho inhibition in DCs with C3 transferase (data not shown). HIV-1 transfer across infectious synapse was also dependent on intact actin. The use of actin-disrupting drugs (supplemental Figure 3) inhibited both formation of DC-T cell infectious synapses and transfer of HIV-1 infection, in agreement with previous observations,30 and Cdc42 silencing in DC resulted in a strong decrease in the number of visible membrane extensions (Figure 2C).
Cdc42 is required for HIV-1 transfer across DC-CD4+ T cell infectious synapses. (A) Impact of silencing in DCs of cytoskeletal rearrangement proteins. (Left panel) Western blots for Cdc42 and Rac1 protein expression. (Middle panel). DC-CD4+ T cell infectious synapses counts. (Right panel). HIV-1 infection transfer to Jurkat CD4+ T cells. Data are mean ± SD of 5 independent experiments. (B) Confocal microscope images of DC-Jurkat CD4+ T cell infectious synapses. White thin arrows indicate viral particles on membrane extensions. *“Hairy” appearance of the DC surface. Thick white arrows indicate the presence of viral aggregates at the infectious synapse. **Loss of membrane extensions at the surface of the Cdc42-depleted DCs. Bar represents 5 μm. (C) Quantitation of the number of thin membrane extensions, dendrites, and lamellipodia in DCs after Cdc42 and Rac1 silencing. White arrows point to membrane extensions; and double-white asterisks, the DC-surface devoid of membrane extensions. The plot at right shows quantitation of membrane extensions, dendrites, and cell surface covered with lamellipodia (right panel). Data are mean ± SD of 4 independent experiments. (D) Impact of Cdc42 mutant nucleofection in DCs on HIV-1 transfer to resting autologous CD4+ T lymphocytes. Data are mean ± SD of 2 independent experiments. (E) Quantitation of the number of membrane extensions in DCs after Cdc42 mutant nucleofection. Data are mean ± SD of 3 independent experiments. *P < .05 (Student t test). Bonferroni test with an α-error value of 5% has been applied to all panels with multiple comparisons.
Cdc42 is required for HIV-1 transfer across DC-CD4+ T cell infectious synapses. (A) Impact of silencing in DCs of cytoskeletal rearrangement proteins. (Left panel) Western blots for Cdc42 and Rac1 protein expression. (Middle panel). DC-CD4+ T cell infectious synapses counts. (Right panel). HIV-1 infection transfer to Jurkat CD4+ T cells. Data are mean ± SD of 5 independent experiments. (B) Confocal microscope images of DC-Jurkat CD4+ T cell infectious synapses. White thin arrows indicate viral particles on membrane extensions. *“Hairy” appearance of the DC surface. Thick white arrows indicate the presence of viral aggregates at the infectious synapse. **Loss of membrane extensions at the surface of the Cdc42-depleted DCs. Bar represents 5 μm. (C) Quantitation of the number of thin membrane extensions, dendrites, and lamellipodia in DCs after Cdc42 and Rac1 silencing. White arrows point to membrane extensions; and double-white asterisks, the DC-surface devoid of membrane extensions. The plot at right shows quantitation of membrane extensions, dendrites, and cell surface covered with lamellipodia (right panel). Data are mean ± SD of 4 independent experiments. (D) Impact of Cdc42 mutant nucleofection in DCs on HIV-1 transfer to resting autologous CD4+ T lymphocytes. Data are mean ± SD of 2 independent experiments. (E) Quantitation of the number of membrane extensions in DCs after Cdc42 mutant nucleofection. Data are mean ± SD of 3 independent experiments. *P < .05 (Student t test). Bonferroni test with an α-error value of 5% has been applied to all panels with multiple comparisons.
To extend our analysis on the role of Cdc42 and membrane extensions in HIV-1 transfer to CD4+ T lymphocytes and to rule out off-target effects of RNA interference strategies, we transfected immature DCs with a wild-type (WT) Cdc42, a dominant-negative Cdc42 (T17N), and a constitutively active Cdc42 variant (Q61L). Transfection efficiencies before eGFP-positive cells sorting were ∼ 10% to 15% (supplemental Figure 4A). Sorting of eGFP-positive DCs increased the percentage of transfected cells to ∼ 90% to 95% (supplemental Figure 4B), without significant modification of cell-surface DC-SIGN expression (supplemental Figure 4B) or DC viability (supplemental Figure 4C). The morphology of DCs transfected with dominant negative Cdc42 (T17N) was altered, as we observed more round-shaped cells compared with other conditions. However, we did not observe a difference in numbers of conjugates formed between immature DCs and primary CD4+ T cells, even after transfection with dominant negative Cdc42 (T17N), in agreement with our results obtained after Cdc42 silencing in DCs by RNAi (supplemental Figure 1). Interestingly, we observed a noticeable increase in HIV-1 transfer from immature DCs to primary CD4+ in a single round infection assay when DCs were transfected with either a Cdc42 (WT) or constitutively activated Cdc42 (Q61L; 147.4% ± 26.4% increase; Figure 2D). In contrast, transfection of a dominant negative Cdc42 (T17N) inhibited transfer of HIV-1 infection from DCs to T cells (63.6% ± 5.9% decrease; Figure 2D). These results directly correlated with corresponding changes in the number of membrane extensions on DC surface, increasing with constitutively active Cdc42 (Q61L) or decreasing with dominant negative Cdc42 (T17N; Figure 2E; supplemental Figure 4D). Whereas transfection of immature DCs with WT Cdc42 resulted in a 2-fold increase in the number of membrane extensions, addition of HIV-1 led to a more than 4-fold increase, correlating with a strong activation of Cdc42 by the viral envelope after engagement of DC-SIGN. Treatment of DCs with the Cdc42 inhibitor secramine A or the Src kinases inhibitor PP2 also strongly reduced transfer of HIV-1 infection to primary CD4+ T lymphocytes (81.4% ± 5.1% decrease and 83.5% ± 3.8% decrease, respectively; supplemental Figure 5).
HIV-1 is present on membrane extensions at the DC- T lymphocyte infectious synapse
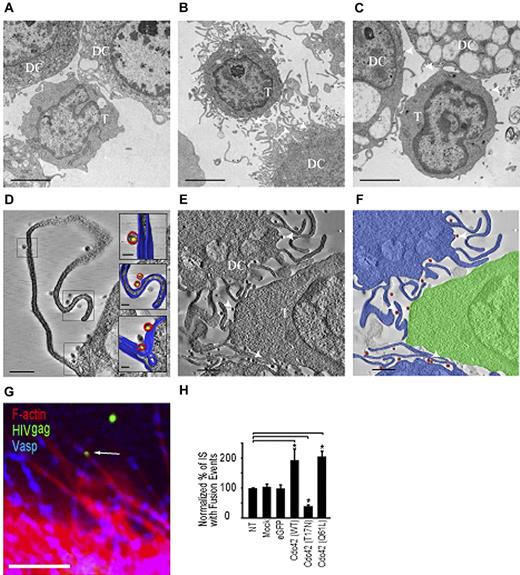
Next, we analyzed the ultrastructural features of contacts formed between T cells and immature DCs using electron microscopy and electron tomography. In the absence of virus, projection electron microscopic images showed that regions of contact between T cells and DCs were relatively smooth or had short membrane extensions from the DCs that were not localized just to regions of contact with the T cells (Figure 3A). In the presence of HIV-1, extensive membrane extensions were observed to originate from the DCs (Figure 3B) and were present in every zone of contact between T cells and DCs (n = 30). However, there was no obvious increase of these extensions at the site of the infectious synapse; rather, a global increase at the whole cell surface was observed. HIV-1 was present in abundance in the contact zones. To better establish the 3D localization of HIV-1 in the contact region, we carried out electron tomography. Tomographic slices show definitively that HIV-1 is located on the surfaces of these membrane extensions all along their length, both when the membrane extensions are far from the CD4+ T cell (Figure 3D; supplemental Video 1) and when they are in close contact (Figure 3E-F; supplemental Video 2). These findings strongly suggest that the viruses might “surf” along the surfaces of the membrane extensions of the DCs, which are increased as a result of exposure to HIV-1. Treatment of DCs with the Cdc42 inhibitor secramine A largely abrogated these extensions (Figure 3C). HIV-1 localization on the membrane extensions was further supported with staining of the Ena/Vasp complex, which is present predominantly at tips of membrane extensions31 (Figure 3G). To show actual transfer of HIV-1 to T lymphocytes, we used a viral fusion assay. Viral fusion events were measured by color separation of viral particles incorporating an S15-mCherry–tagged env and eGFP-tagged vpr as previously described.22,32 HIV-1 harboring a mutation in gp41 (F522Y-HIV-1) abrogating fusogenic properties of the viral envelope did not show color separation in our assay (supplemental Figure 6). Transfection of DCs with Cdc42 (WT) and Cdc42 (Q61L) increased HIV-1 fusion in target CD4+ lymphocytes (1.94 fold ± 0.37, respectively; 2.05-fold ± 0.18% increase; Figure 3H). Control experiments were performed using DCs transfected with dominant negative Cdc42 (T17N) and resulted in decreased HIV-1 fusion with CD4+ T lymphocytes (61.7% ± 4.9% decrease; Figure 3H).
HIV-1 is localized on membrane extensions at the DC-CD4+ T cell infectious synapse. Transmission electron microscopy of contacts between immature DC and T cells. (A-C) Projection electron microscopy images of a 100-nm-thick section from fixed, plastic-embedded cocultures of T cells and immature DCs either in the absence of added HIV-1 (A), after exposure to HIV-1 for 1 hour (B), and after treatment with the cdc42 inhibitor secramine A, followed by exposure to HIV-1 (C). (D-E) A 5-nm tomographic slice from a 3D image of a 175-nm-thick section prepared from fixed, plastic-embedded cocultures of T cells and DCs exposed to HIV-1 (as in B) showing viruses riding on the membrane extensions from the DCs. (F) Schematic rendering of tomographic slice in panel E highlighting contact between T cells (green) and immature DCs (blue) in the presence of HIV (red). Scale bars, original magnifications: (A-C) 2 μm; (D-E) 1 μm. (G) Representative image of membrane extensions on DCs with HIV-1 near extension tips. Bar represents 1 μm. (H) Quantification of fused HIV-1 viral particles in target CD4+ T lymphocytes after nucleofection of Cdc42 mutants in DCs. All values are normalized to a 100% value assigned to the nontreated condition. Arrows indicate HIV-1 viral particles on membrane extensions on DCs. Data are mean ±SD of 3 independent experiments. *P < .05 (Student t test). Bonferroni test with an α-error value of 5% has been applied to all panels with multiple comparisons.
HIV-1 is localized on membrane extensions at the DC-CD4+ T cell infectious synapse. Transmission electron microscopy of contacts between immature DC and T cells. (A-C) Projection electron microscopy images of a 100-nm-thick section from fixed, plastic-embedded cocultures of T cells and immature DCs either in the absence of added HIV-1 (A), after exposure to HIV-1 for 1 hour (B), and after treatment with the cdc42 inhibitor secramine A, followed by exposure to HIV-1 (C). (D-E) A 5-nm tomographic slice from a 3D image of a 175-nm-thick section prepared from fixed, plastic-embedded cocultures of T cells and DCs exposed to HIV-1 (as in B) showing viruses riding on the membrane extensions from the DCs. (F) Schematic rendering of tomographic slice in panel E highlighting contact between T cells (green) and immature DCs (blue) in the presence of HIV (red). Scale bars, original magnifications: (A-C) 2 μm; (D-E) 1 μm. (G) Representative image of membrane extensions on DCs with HIV-1 near extension tips. Bar represents 1 μm. (H) Quantification of fused HIV-1 viral particles in target CD4+ T lymphocytes after nucleofection of Cdc42 mutants in DCs. All values are normalized to a 100% value assigned to the nontreated condition. Arrows indicate HIV-1 viral particles on membrane extensions on DCs. Data are mean ±SD of 3 independent experiments. *P < .05 (Student t test). Bonferroni test with an α-error value of 5% has been applied to all panels with multiple comparisons.
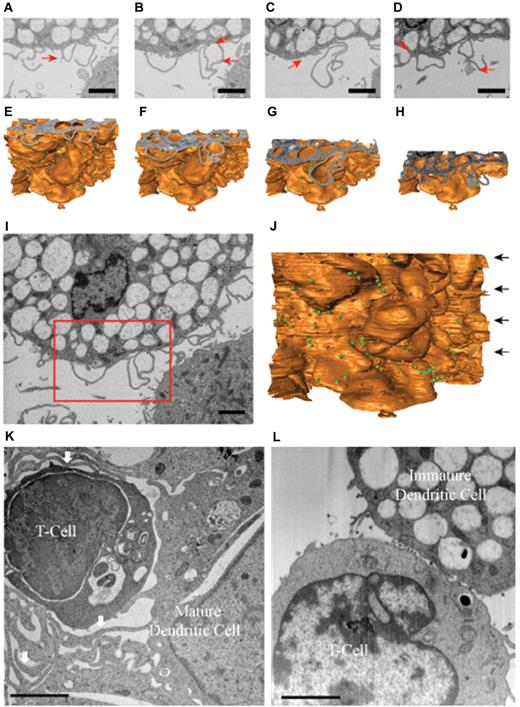
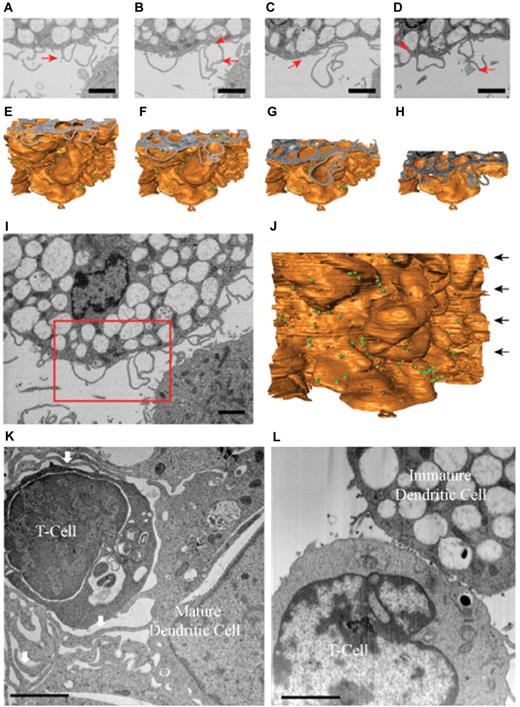
To obtain a better understanding of the structure of these membrane extensions, we analyzed the distribution of HIV-1 at the level of DC-T cell infectious synapses using ion-abrasion (IA) SEM33 (Figure 4A-D). In contrast to electron tomography, IA-SEM allows imaging the entire depth of the synapse with the iterative use of a focused ion beam to remove material from the surface of the specimen and a scanning electron beam to image the newly exposed surface. Two important results emerge from the IA-SEM studies. First, the extensions observed in the tomographic slices (Figure 3D-E) and in the individual SEM images (Figure 4A-D) that have the appearance of filopodia are clearly seen to be sections through thin-walled membrane extensions originating from the DCs (Figure 4E-H). A cross-sectional image of the entire cell-cell contact region and the corresponding 3D rendering of the entire sheet-like extension are presented in Figure 4I and J, respectively. These results therefore show that these membrane extensions from the DC cell surface are best described as thin membranous sheets emanating from the DC membrane and are therefore similar in this respect to the findings recently reported from IA-SEM analysis of infectious synapses formed between CD4+ T cells and mature DCs.19 However, in contrast to the findings with the synapses formed by mature DCs, the membrane extensions in the synapses formed by immature DCs do not wrap around the T cells (Figure 4K-L). Thus, although the membrane extensions from both mature and immature DCs are sheet-like in nature, the major difference in the corresponding synapses is that there is no visible encasement of the T cells by these extensions in the case of the infectious synapses formed by the immature DCs.
Immature DCs do not form wrapping sheets around T lymphocytes in the context of the infectious synapse. IA-SEM analysis of immature and mature DC-T cell infectious synapses. (A-D) 2D images of immature DC-T cell infectious synapses from the IA-SEM image stack corresponding to slices at progressively lower locations in the image stack. Red arrows point to some of the HIV-1 particles visible in the image. (E-H) Surface representations of the image stack with top surfaces corresponding to the images shown in panels A to D, respectively. (I-J) Top slice and front surface view of IA-SEM image stack showing the entire imaged area; the boxed region corresponds to the region highlighted in panels A to D. The green spheres represent the location of HIV-1. (K-L) Comparison of the infectious synapse between mature DCs (K) pulsed with HIV-1 and CD4+ T cells and of immature DCs (I) pulsed with HIV-1 and CD4+ T cells. (K) Arrows indicate the location of the sheet-like protrusions from the mature DCs that surround the T cells. Bar represents 2 μm.
Immature DCs do not form wrapping sheets around T lymphocytes in the context of the infectious synapse. IA-SEM analysis of immature and mature DC-T cell infectious synapses. (A-D) 2D images of immature DC-T cell infectious synapses from the IA-SEM image stack corresponding to slices at progressively lower locations in the image stack. Red arrows point to some of the HIV-1 particles visible in the image. (E-H) Surface representations of the image stack with top surfaces corresponding to the images shown in panels A to D, respectively. (I-J) Top slice and front surface view of IA-SEM image stack showing the entire imaged area; the boxed region corresponds to the region highlighted in panels A to D. The green spheres represent the location of HIV-1. (K-L) Comparison of the infectious synapse between mature DCs (K) pulsed with HIV-1 and CD4+ T cells and of immature DCs (I) pulsed with HIV-1 and CD4+ T cells. (K) Arrows indicate the location of the sheet-like protrusions from the mature DCs that surround the T cells. Bar represents 2 μm.
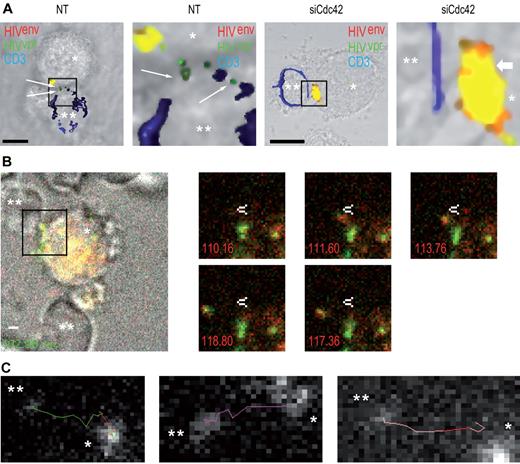
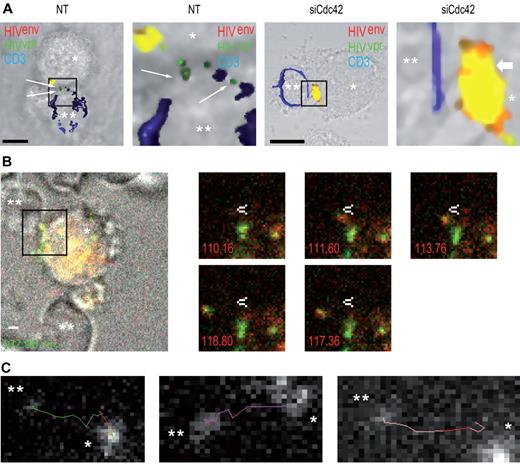
Next, to evaluate whether we could observe transfer of infectious virions at the immature DC-T cell interface, we measured viral fusion events in the presence or absence or Cdc42. We observed a significant reduction of HIV-1 fusion in target Jurkat CD4+ T lymphocytes (47.8% ± 6.8% decrease; supplemental Figure 7) after Cdc42 silencing in DCs, as assessed by confocal microscopy (Figure 5A). This indicates that the block of HIV-1 transfer across DC-CD4+ T cells infectious synapses after Cdc42 silencing in DC occurs at the infectious synapse before fusion with target CD4+ T lymphocytes. To further characterize the events occurring at the DC-T cell infectious synapse, we performed live confocal imaging analysis of the infectious synapse. We found that, as expected, HIV-1 viral particles were transferred from DCs to CD4+ T lymphocytes on thin membrane extensions (Figure 5B; supplemental Videos 3-5). Then, we analyzed HIV-1 trajectories during viral transfers and established that they occurred in a very rapid and linear manner (Figure 5C). Average speed of trajectories was 0.40 ± 0.23 μm/s. Live imaging analysis of the DC-T cell infectious synapse after Cdc42 silencing in DCs was then performed. No HIV-1 transfer across the infectious synapse was observed in Cdc42-depleted DCs. Furthermore, HIV-1 movements at the DC surface were clearly reduced in Cdc42-knockdown conditions (supplemental Video 6). Together, these results show that membrane extensions that we have now characterized using light and electron microscopy are essential for the rapid movement of HIV-1 at the DC cell surface and for HIV-1 transfer across infectious synapses.
Cdc42 silencing in DCs prevents HIV-1 fusion in target T lymphocytes. (A) Confocal microscope analysis of HIV-1 fusion in target CD4+ T lymphocytes. Nontreated (left panels) and siCdc42 (right panels) conditions are represented. Fused viral particles (green only) are shown by arrows. Bar represents 5 μm. (B) Live imaging analysis of HIV-1 transfer across DC-CD4+ T cell infectious synapses. (Left panel) Infectious synapse analyzed in supplemental Video 1. *DCs. **CD4+ T cells. Bar represents 2 μm. Right panel demonstrates time points during HIV-1 transfer across DC-CD4+ T cell infectious synapse shown in supplemental Video 1. White arrow indicates a static point along HIV-1 transfer trajectory. (C) Different examples of HIV-1 transfer trajectories across DC-CD4+ T cell infectious synapses. *DCs. **CD4+ T cells. *P < .05 (Student t test).
Cdc42 silencing in DCs prevents HIV-1 fusion in target T lymphocytes. (A) Confocal microscope analysis of HIV-1 fusion in target CD4+ T lymphocytes. Nontreated (left panels) and siCdc42 (right panels) conditions are represented. Fused viral particles (green only) are shown by arrows. Bar represents 5 μm. (B) Live imaging analysis of HIV-1 transfer across DC-CD4+ T cell infectious synapses. (Left panel) Infectious synapse analyzed in supplemental Video 1. *DCs. **CD4+ T cells. Bar represents 2 μm. Right panel demonstrates time points during HIV-1 transfer across DC-CD4+ T cell infectious synapse shown in supplemental Video 1. White arrow indicates a static point along HIV-1 transfer trajectory. (C) Different examples of HIV-1 transfer trajectories across DC-CD4+ T cell infectious synapses. *DCs. **CD4+ T cells. *P < .05 (Student t test).
Cdc42 and membrane extensions are essential for HIV-1 transfer across the DC-T cell infectious or immunologic synapse
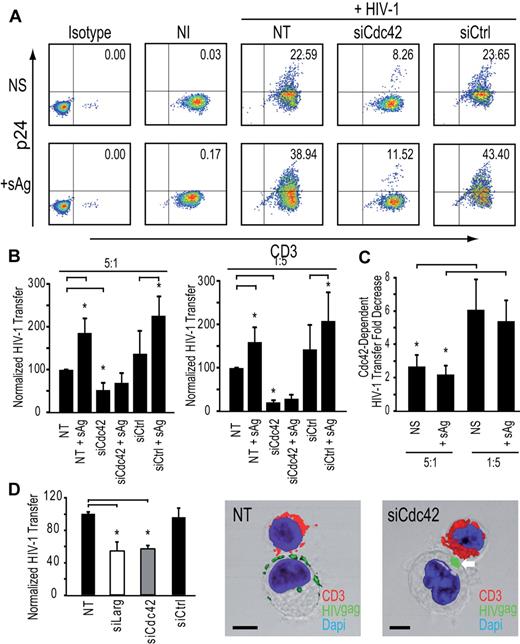
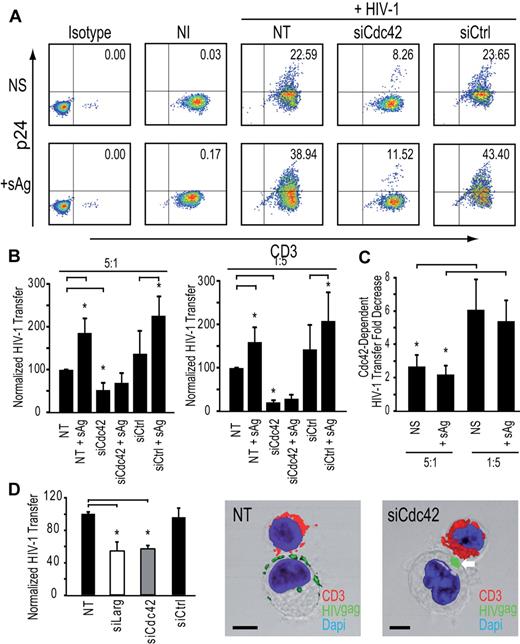
To obtain a quantitative estimate of the contribution of the membrane extensions to HIV-1 transfer from immature DCs to resting autologous CD4+ T lymphocytes, we set up an assay that allowed us to independently modulate either the number of infectious synapses or these membrane extensions. To force infectious synapse formation, we used a high number of infected DCs with a low number of resting autologous CD4+ T cells (ratio 5:1) and added a cocktail of 3 superantigens (sAg), known to stabilize DC-T cell contacts at the infectious synapse and promote T-cell activation.34 Cdc42 silencing resulted in a net decrease of transfer of HIV-1 infection (62.6% ± 12.1% inhibition; Figure 6A-B). These results are consistent with the idea that Cdc42-dependent membrane extensions are required for HIV-1 transfer to resting autologous CD4+ T lymphocytes, even under conditions where a high number of stable DC-T cell immunologic synapses are formed. In parallel, we carried out similar experiments where the ratio of DC to T cells was reversed, with the T cells in 5-fold excess, conditions that are closer to those found in mucosal tissues or gut-associated lymphoid tissue, Interestingly, under these conditions, we found that most of HIV-1 infection transfer is dependent on Cdc42 both in the absence (84.0% ± 6.1% inhibition) and presence of sAg (81.4% ± 8.2% inhibition; Figure 6C). As a further verification of the physiologic relevance of these findings, we also extended our observations to primary blood derived-MyDCs. MyDCs are a major type of DCs in the bloodstream and are involved in HIV-1 transfer to CD4+ T lymphocytes.35,37 Silencing of Cdc42 or Larg in immature MyDCs significantly reduced HIV-1 transfer (Figure 6D) with no impact on infectious synapse formation (Figure 6D) in agreement with results observed with immature monocyte-derived DCs. In conclusion, our results conclusively show that Cdc42-dependent membrane extensions are essential components of HIV-1 transmission at DC-CD4+ T-cell infectious synapses and account for most of the transfer of virus from DCs to CD4+ T cells.
Cdc42 is required for HIV-1 transfer from DCs to autologous resting CD4+ T cells in the presence of sAg. (A) HIV-1 infection transfer to resting autologous CD4+ T lymphocytes after sAg stimulation. (B) HIV-1 infection transfer in DC-resting autologous CD4+ T lymphocyte cocultures. DC/T ratio 5:1 (left panel) and DC/T ratio 1:5 are shown (right panel). Data are mean ± SD of 3 independent experiments. (C) Fold decrease of HIV-1 transfer in DCs: resting autologous CD4+ T lymphocyte ratio conditions 5:1 (left panel) and 1:5 (right panel). Data are mean ± SD of 3 independent experiments. (D) Impact of Cdc42 or Larg silencing in MyDCs on HIV-1 transfer to Jurkat CD4+ T lymphocytes (left panel). Data are mean ± SD of 4 independent experiments. Two representative images of MyDCs-CD4+ T cell infectious synapses are shown (middle and right panels). Bar represents 5 μm. *P < .05 (Student t test). Bonferroni test with an α-error value of 5% has been applied to all panels with multiple comparisons.
Cdc42 is required for HIV-1 transfer from DCs to autologous resting CD4+ T cells in the presence of sAg. (A) HIV-1 infection transfer to resting autologous CD4+ T lymphocytes after sAg stimulation. (B) HIV-1 infection transfer in DC-resting autologous CD4+ T lymphocyte cocultures. DC/T ratio 5:1 (left panel) and DC/T ratio 1:5 are shown (right panel). Data are mean ± SD of 3 independent experiments. (C) Fold decrease of HIV-1 transfer in DCs: resting autologous CD4+ T lymphocyte ratio conditions 5:1 (left panel) and 1:5 (right panel). Data are mean ± SD of 3 independent experiments. (D) Impact of Cdc42 or Larg silencing in MyDCs on HIV-1 transfer to Jurkat CD4+ T lymphocytes (left panel). Data are mean ± SD of 4 independent experiments. Two representative images of MyDCs-CD4+ T cell infectious synapses are shown (middle and right panels). Bar represents 5 μm. *P < .05 (Student t test). Bonferroni test with an α-error value of 5% has been applied to all panels with multiple comparisons.
Discussion
Our data provide direct evidence that Cdc42 activation by HIV-1 facilitates its cell-to-cell spread at the infectious synapse formed between immature DCs and CD4+ T cells. We here show that DC-SIGN engagement by HIV-1 leads to Src kinase activation and that Cdc42, Pak1, and WASP activation occurs downstream of Src kinases, suggesting that a signaling cascade triggered by DC-SIGN engagement by the viral envelope leads ultimately to induction of the membrane extensions responsible for virus transmission. Our conclusion that HIV-1env–dependent signaling cascade facilitates viral spread in this manner is supported by the finding that disruption of Cdc42 or Src kinase resulted in a strong inhibition of the process. Our results establish that the actin-rich cellular protrusions can confer up to 90% of transfer of HIV-1 infection HIV-1, even if immunologic synapses between DC and CD4+ T lymphocytes are induced via MHC-TCR engagement (Figure 4C). In summary, our observations establish that a 2-step process is initiated by HIV-1 for its delivery to the T cells. First, the virus becomes concentrated at the infectious synapse either by surfing on the cell surface36,37 (supplemental Video 6) or after recycling from a tetraspanin-rich compartment.24,32 The second step of transfer from the DC to the T-cell is mediated by Cdc42-dependent induction of membrane extensions that enable transfer from the DCs to the T cells. The crucial role of the extended membranous sheets for the transfer of HIV-1 infection across the DC-T cell infectious synapse is further exemplified in conditions where low numbers of DC are incubated with T cells. During the early events of HIV-1 infection, either in mucosal tissues or in the gut-associated lymphoid tissue, the number of CD4+ T cells far exceeds DCs, suggesting that this mode of transfer of HIV-1 infection may be a critical component of HIV-1 transmission in vivo.38 Despite the general similarities in the nature of the membrane extensions observed on immature and mature DCs, an interesting difference is that the envelopment of the T-cell seen in mature DCs is not observed with the immature DCs. This distinction between the more discreet “action-at-a-distance” mode for immature DC-T cell contact versus a more intimate “interdigitating” mode for mature DC-T cell contacts could be functionally relevant and consistent with DC physiology. However, it is clear that, in virologic synapses formed by both immature and mature DCs, virus delivery to the T cell is not passive, and there is a fundamental role for membrane extensions from the DCs in ensuring effective transfer of HIV-1 to T cells. In conclusion, our study identifies a novel mode of HIV-1 cell-to-cell transfer initiated by the virus itself, representing a potential paradigm for other viral diseases. In addition, mechanisms that disrupt formation of membrane extensions that enable virus transmission could represent a useful target for blocking virus propagation in the early events of HIV-1 infection.
The online version of this article contains a data supplement.
The publication costs of this article were defrayed in part by page charge payment. Therefore, and solely to indicate this fact, this article is hereby marked “advertisement” in accordance with 18 USC section 1734.
Acknowledgments
The authors thank Tom Hope, Olivier Schwartz, and Didier Trono for reagents; Jeremy Luban and Caterina Strambio De Castillia for discussions and technical assistance with live confocal microscopy studies; Gavin Murphy for assistance with segmentation of the IA-SEM data; Ralph Steinman and Didier Trono for critical reading of the manuscript; Mark Marsh for discussions; Florence Leuba and Pierre Carraux for technical help; and Romaine Stalder for assistance with the figures. Some of the samples used for electron microscopy were prepared with the help of the Pôle Facultaire de Microscopie Ultrastructurale at the Faculty of Medicine of the University of Geneva under the supervision of M. Foti. Flow cytometry analysis was performed with the support of the Flow Cytometry Core Facility of the Faculty of Medicine of the University of Geneva.
This work was supported by the Swiss National Science Foundation, the Human Science Frontier Program, and Cardiff University (V.P.), the National Cancer Institute (S.S.), an MD-PhD scholarship (D.S.N.), and the National Institute of General Medical Sciences (Pharmacology Research Associate Fellowship; R.F.).
National Institutes of Health
Authorship
Contribution: V.P., S.S., and D.S.N. designed the experiments and wrote the manuscript; and D.S.N., M.L., R.F., E.G., and F.P.B. performed experiments and analyzed data.
Conflict-of-interest disclosure: The authors declare no competing financial interests.
Correspondence: Vincent Piguet, Department of Dermatology and Wound Healing, Welsh Institute of Dermatology, 3rd Floor, Glamorgan House, Cardiff University and University Hospital of Wales, Heath Park, Cardiff, CF14 4XN, Wales, United Kingdom; e-mail: piguetv@cardiff.ac.uk.

