Abstract
Abstract 2842
IGHV gene mutational load and use of specific IGHV genes and stereotypes have all been reported to have prognostic significance in CLL. In the UK CLL4 trial there were significant differences in response rate and progression free survival regardless of whether a 97% or 98% cut off was used, and the percentage of mutations which correlates best with clinical outcome remains controversial. We performed IGHV gene sequencing on 1071 patients with CLL or ‘clinical’ MBL (n= 153) in whom biomarkers, time to first treatment (TTFT) and overall survival (OS) were available. Four hundred and ninety six cases were entered into the UK CLL4 trial and 575 presented or were referred to the Royal Bournemouth Hospital.
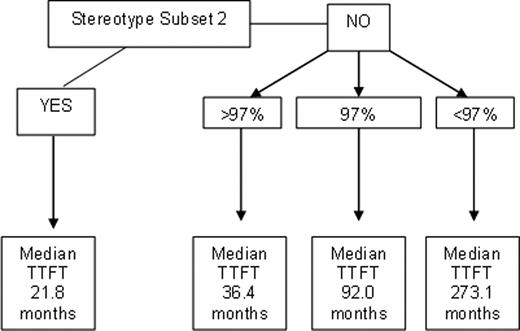
TTFT and OS were determined for cases with <96% identity and for each mutational point from 96% – 100% identity separately, excluding cases utilising IGHV3-21 assigned to stereotype subset 2. There was a significant difference in median TTFT and median OS between those with 97% identity (TTFT-20.9 and OS-99.3 months) and <97% identity (TTFT-118 and OS-191 months; p<0.001 and p<0.001), but not between cases with 97% and >97% identity (TTFT -13.1 months p=0.052 and OS-84.5 months p=0.177). When TTFT was determined for patients with early stage disease only (stage A CLL or CLL-like MBL, n=571), those with 97% identity, determined using either leader sequence or BIOMED 2 primers, had a significantly longer median TTFT than those with >97% identity (92.0 and 36.4 months respectively; p=0.012) and significantly shorter than those cases with <97% identity (273.1 months; p=0.012). If only stage A cases were analysed, those with 97% identity had a significantly longer median TTFT than those with >97% identity (TTFT; 68 vs. 26 months p=0.034). However, when compared to cases with <97% identity, there was a trend towards a shorter TTFT but significance was not reached (68 vs. 128 months p=0.060).
Four subgroups of MBL/stage A CLL with differing TTFT based on stereotype subset 2 and relationship to 97% germline identity
Four subgroups of MBL/stage A CLL with differing TTFT based on stereotype subset 2 and relationship to 97% germline identity
Multivariate analysis, selected 97% and >97% identity as independent predictors of shorter TTFT (HR 2.5; 95% CI 1.3–4.9; p=0.007 and HR 4.2; 95% CI 2.9–6.1; p<0.001 respectively) in a model including <97%, 97%, >97% identity to germline, age at diagnosis, gender, expression of ZAP70, expression of CD38, del11q, del17p, stereotypy and stereotype subset 2 (Table 1).
Further analyses were performed to investigate whether the differences in TTFT between cases with <97%, 97% or >97% identity could be explained by differences in IGHV gene usage.
Sixty-one percent of cases with 97% identity to germline utilised only five genes; IGHV3-21, IGHV3-23, IGHV3-48, IGHV3-53 and IGHV1-18 and these genes were significantly over-represented in cases with 97% compared to either, cases with <97% (p>0.001) or >97% (p>0.001). When subset 2 cases were excluded, there was no difference in TTFT between cases using the above 5 genes and all other IGHV genes at this identity (p=0.288). In contrast to previously published data we found no difference in TTFT between mutated IGHV3-23 cases and other mutated cases (using a 98% cut-off), but IGHV3-23 cases with 97% identity had a shorter TTFT than cases with <97% identity (p<0.001).
In conclusion the clinical course of cases with 97% identity, especially if diagnosed early in their disease, appears distinct from other cases defined as having mutated IGHV genes using the conventional 98% cut off. This is not accounted for by differences in IGHV gene usage, the incidence of stereotypy or other biomarkers and may reflect differences in response to BCR stimulation between cases with 97% and <97% identity.
Multivariate analysis for TTFT in MBL/stage A CLL
| Outcome . | Covariate . | Hazard Ratio (HR) . | 95% CI for HR . | Significance (p) . |
|---|---|---|---|---|
| TTFT | 97% identity | 2.5 | 1.3–4.9 | 0.007 |
| >97% identity | 4.2 | 2.9–6.1 | <0.001 | |
| Subset 2 | 3.7 | 1.8–7.4 | <0.001 | |
| Del11q | 1.7 | 1.1–2.7 | 0.014 | |
| CD38 | 1.5 | 1.0–2.0 | 0.028 | |
| Age at diagnosis | 0.98 | 0.96–0.99 | <0.001 |
Only covariates selected as significant are listed above.
No relevant conflicts of interest to declare.
Author notes
Asterisk with author names denotes non-ASH members.


