

Abstract
Abstract 3536
ΔNp73 is an alternative TP73 gene transcript lacking the transactivation (TA) domain that is generated via alternative splicing and/or P2 promoter. The encoded protein acts as a potent transdominant inhibitor of wild type TP53 and full-length TAp73. In several human malignancies the unbalanced expression of transcriptionally active (TAp73) and inactive (ΔNp73) variants correlates with treatment outcome. We have previously reported that higher ΔN/TA isoform expression ratio was associated with poorer prognosis and resistance to cytarabine induced apoptosis in patients with acute myeloid leukemia (AML) (Lucena-Araujo et al., 2008). In acute promyelocytic leukemia (APL), both isoforms are expressed, but the clinical significance remains unknown. The aim of this study was to determine whether the ΔN/TA expression ratio was associated with treatment outcome of APL patients and to investigate the mechanisms by which ΔNp73 may contribute to PML-RARa+ cell survival. Using isoform-specific probes for ΔNp73 and TAp73, their expression was analyzed in 166 APL patients by Real-time quantitative polymerase chain reaction (RQ-PCR). Patients were divided into tertiles for ΔN/TA expression ratio (median value=23.62; 33rd/66th percentiles=12.8/42.3) and their clinical and laboratory characteristics were compared. Patients in the highest tertile presented higher white blood cells (WBC) counts than those in intermediate/lower tertiles (p <0.001), but no significant differences were observed for age, gender, PML breakpoint, or platelets count. Higher ΔN/TA expression ratio values were significantly associated with the presence of FLT3-ITD (p =0.001). Treatment outcome was obtained for 131 APL patients enrolled in the APL99 (n=41) and IC-APL (n=90) trials. The mean follow-up was 29.1 months, ranging from 1 to 85.5 months. The mean overall survival (OS) of all patients was of 66.8 months [95%CI; 60.8 to 72.8], whereas it was of 67.1 months [56.5 to 77.7] for patients in the lower and 41.7 months [32 to 51.4] for those in the higher tertile for ΔN/TA expression ratio (p=0.014, Figure 1A). Univariate analysis identified WBC counts above 10,000/μl (p =0.003), FLT3-ITD mutation (p =0.011) and ΔN/TA expression ratio (p =0.014) as predictive factors for OS. However, in multivariate Cox analysis, these three prognostic factors were not independent. Until April 2011, a total of eight relapses (6.1%) were recorded. The disease free survival (DFS) rate at five-years for all patients was of 88.3% ± 4.2% and the mean DFS was of 76.1 months [71.2 to 80.9]. DFS was significantly shorter in patients at the higher tertile ΔN/TA expression ratio compared with patients at the lower tertile (72.1 ± 11.2% vs 97.1 ± 2.8%, respectively; p <0.001; Figure 1B) and was the only variable found to be significant in the univariate analysis. To test the functional significance of the association of PML-RARa with high ΔNp73 gene expression, primary murine bone marrow cells from hCG-PML-RARa transgenic mice were transfected with MSCV-based retroviral vector carrying the ΔNp73 cDNA upstream of IRES-GFP cassette (PML-pMIG-ΔN). Expression of ΔNp73 in PML-RARa+ cells increased cell proliferation rate by 2.5-fold compared to PML-RARa+ transfected with the empty vector (p =0.03). This increase resulted from accumulation of cells at the G2/M phase (5.79 ± 0.08% for PML-pMIG vs 9.8 ± 0.35% for PML-pMIG-ΔN, p <0.001), as well as at S phase of the cell cycle (27.74 ± 0.89% for PML-pMIG vs. 36.78 ± 0.81% for PML-pMIG-ΔN, p =0.001). In addition, transfection of ΔNp73 resulted in resistance to cytarabine-induced apoptosis. After 24h of culture with 50μg/ml of cytarabine (ED-50%), the fractional effect for the drug (% Anexin V-positive in (treated – untreated) cells /100 - % Anexin V-positive in non-treated cells) was 32.1% for PML-pMIG-ΔN and 54.8% for PML-pMIG (p <0.001). In conclusion, ΔN/TA expression ratio was associated with shorter OS and DFS in APL, which may reflect increased cell proliferation and apoptosis resistance due to ΔNp73 activity.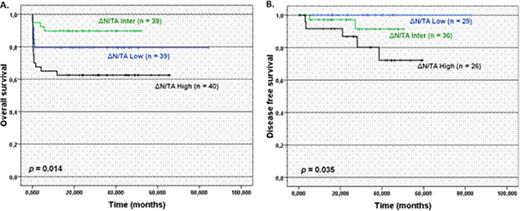 Close modal
Figure 1.

Overall (A) and disease-free survival (B) in acute promyelocytic leukemia patients according to ΔN/TA expression ratio.
Figure 1.
Overall (A) and disease-free survival (B) in acute promyelocytic leukemia patients according to ΔN/TA expression ratio.
Disclosures:
No relevant conflicts of interest to declare.
This icon denotes a clinically relevant abstract

