Abstract
We prospectively analyzed the prognostic relevance of positron emission tomography–computed tomography (PET/CT) at diagnosis, after thalidomide-dexamethasone (TD) induction therapy and double autotransplantation (ASCT) in 192 newly diagnosed multiple myeloma (MM) patients. Presence at baseline of at least 3 focal lesions (FLs; 44% of cases), a standardized uptake value (SUV) > 4.2 (46%), and extramedullary disease (EMD; 6%) adversely affected 4-year estimates of progression-free survival (PFS; ≥ 3 FLs: 50%; SUV > 4.2: 43%; presence of EMD: 28%). SUV > 4.2 and EMD were also correlated with shorter overall survival (OS; 4-year rates: 77% and 66%, respectively). Persistence of SUV > 4.2 after TD induction was an early predictor for shorter PFS. Three months after ASCT, PET/CT was negative in 65% of patients whose 4-year rates of PFS and OS were superior to those of PET-positive patients (PFS: 66% and OS: 89%). In a multivariate analysis, both EMD and SUV > 4.2 at baseline and persistence of fluorodeoxyglucose (FDG) uptake after ASCT were independent variables adversely affecting PFS. PET/CT involvement at diagnosis, after novel agent-based induction and subsequent ASCT is a reliable predictor of prognosis in MM patients. This study is registered at www.clinicaltrials.gov as NTC01341262.
Introduction
Incorporation of novel agents into autologous stem cell transplantation (ASCT) for multiple myeloma (MM) has affected unprecedented rates of complete response (CR), a gain which resulted in extended progression-free survival (PFS) and overall survival (OS).1-4 Although attainment of CR according to conventionally defined criteria and durable sustainment of CR5 remain important prognostic factors and primary endpoints of ongoing clinical trials, more sensitive techniques than negative immunofixation are needed to better evaluate the increasing depth of response afforded by novel agent-based therapies. In this context, elimination of minimal residual disease (MRD), as detected at the BM level by multiparametric flow cytometry or PCR, has been shown to more carefully prognosticate for improved clinical outcomes in comparison with standard CR.6 In addition, imaging techniques, such as magnetic resonance imaging (MRI) to detect the absence of focal lesions (FLs) potentially harboring viable monoclonal plasma cells7 have been proposed as an additional tool to increase the definition level of CR and its impact on prognosis.
Positron emission tomography (PET) integrated with computed tomography (PET/CT) using the positron-emitting radionuclide 18F labeled with fluorodeoxyglucose (18F-FDG) is a careful technique to detect, with high sensitivity and specificity, the presence of myeloma bone lesions and/or BM involvement at the onset of the disease.8-10 Moreover, FDG-PET has the advantage of demonstrating the presence of active or inactive disease and has thus been explored as a means to monitor response and to predict the outcome in various tumors, most extensively in lymphoma.11,12 In contrast, only a few reports exist on the potential role of this imaging technique as a prognostic factor in MM.13
We herein report the results of a prospective analysis of the prognostic implications of PET/CT performed at baseline and after treatment in a large series of patients with newly diagnosed MM who received thalidomide-dexamethasone (TD) incorporated into double ASCT.
Methods
Patients and treatment protocols
One hundred ninety-two previously untreated MM patients entered this prospective study which was conducted at the Universities of Bologna and Udine, Italy, from January 2002 to December 2008 and was aimed at evaluating the prognostic relevance of PET/CT imaging at baseline and after ASCT. These subjects were part of a larger series of patients who were enrolled in an Italian multicenter study and in a subsequent extension phase of the same protocol of TD incorporated into double ASCT as up-front therapy for symptomatic MM. Details of treatment program have been reported elsewhere.14 Briefly, thalidomide, 200 mg daily, was administered from the outset until the second ASCT to support high-dose melphalan, 200 mg/m2 (MEL-200). Thalidomide was transiently discontinued on the day before administration of cyclophosphamide to collect peripheral blood stem cells (PBSCs) and the first course of ASCT-supported MEL-200. On completion of PBSC harvest and recovery of hematopoiesis after the first ASCT, thalidomide was then resumed. Dexamethasone, 40 mg daily, for 4 days every 28 days was given in combination with thalidomide. Two added 4-day courses of dexamethasone were administered on days 9 through 12 and 17 through 20 during the first and third cycle of induction therapy. Thalidomide and/or dexamethasone dose adjustments were permitted for toxicity at the physician's discretion. After the second ASCT, patients received maintenance treatment with dexamethasone 160 mg/month, until progression. Minimum age for enrolment was 18 years, with the upper age limit of 65 years. All patients had signed an informed consent in accordance with the Declaration of Helsinki. The study was approved by the ethic committees at the 2 participating institutions and is registered with ClinicalTrials.gov (number NTC01341262).
Procedures
Imaging studies.
By study design, all patients were studied at baseline with whole-body x-ray (WBXR) and 18F-FDG PET-CT. PET/CT was repeated also after ASCT and during post-ASCT follow-up; its evaluation after induction treatment was not mandatory, but at the physician's discretion. MRI of the spine and pelvis was also performed at physician's discretion or on clinical need at baseline and during follow-up.
Whole-body (including skull, superior limbs, and femurs) PET/CT was carried out using standard procedures, as previously described.8 PET/CT scans were evaluated by a team of nuclear medicine physicians with extensive experience in MM field. Criteria to define PET/CT positivity included the following: either presence of focal areas of detectable increased tracer uptake within bones (eg, more intense than background BM uptake) excluding articular processes, with or without any underlying lesion identified by CT, or a standardized uptake value (SUV) maximum (max) based on body weight according to standard formula ≥ 2.5 within osteolytic CT areas exceeding 1 cm in size or > 1.5 within osteolytic CT areas ranging between 0.5 and 1 cm in size. In detail, we considered as positive each BM focal area visually detectable in at least 2 or more slices (to avoid a misinterpretation of BM mild inhomogeneous FDG uptake) regardless of the SUV max and in the absence of any underlying lytic lesion at CT images. In most of the cases in which an underlying lytic lesion could be detected, we considered the value of SUV max to standardize the differential diagnosis between active and inactive disease. We used the standard cutoff of 2.5 for lesions bigger than 1 cm in size and a cutoff of at least 1.5 for lesions between 0.5 and 1 cm in size because of the partial volume effect. The number, size, and location of hypermetabolic focal lesions (PET-FLs) were recorded. BM uptake on PET/CT was described as negative, diffuse, or focal according to the degree of FDG uptake. BM was considered diffusely involved if the tracer uptake was diffusely increased with a SUV max equal to, or greater than, the uptake in the spleen. In this case, SUV max was measured in the hottest area within the BM. The degree of FDG uptake was represented by SUV max in the hottest lesion. The presence of extramedullary disease (EMD), defined as FDG-avid tissue that, according to CT examination, was not contiguous to bone and arose in soft tissue, was described by location, size, number of lesion, and SUV. Paramedullary disease, arising from bone, was considered as a lesion but not as EMD. PET/CT scans were performed within 10 days from the end of induction treatment, after 3 months from the last ASCT, once a year during the follow-up phase and at the time of relapse.
Laboratory investigations.
Physical examination, blood cell count, renal and liver function, calcium level, serum protein electrophoresis with immunofixation, 24-hour urine analysis with electrophoresis and urinary immunofixation were evaluated before treatment, after induction treatment, after ASCT and every 3 months thereafter. BM aspirate was evaluated before treatment, at prespecified time points and to confirm the achievement of CR. FISH analysis of del(13q), t(4;14) del(17p) was performed at baseline. Additional prognostic parameters registered at baseline were the following: serum levels of β-2-microglobulin (β2M), C-reactive protein (CRP), albumin, and lactate dehydrogenase (LDH).
Definitions of response and relapse by laboratory and imaging.
Response to treatment was assessed according to European Group for Blood and Marrow Transplantation criteria,15 with the addition of near complete remission (nCR) and very good partial response (VGPR) categories. nCR was defined as no evidence of M protein in serum and urine electrophoresis with positive immunofixation, and VGPR as a > 90% reduction in serum or urine M protein.
Criteria for defining relapse from CR and progression after prior VGPR or less were those previously established; relapse from nCR was identified by the reappearance of M protein on routine electrophoresis. Two subsequent evaluations were required to validate the definition of relapse or progression.
PET/CT was considered negative if every area of increased tracer uptake found at baseline disappeared (PET/CT complete remission: PET-CR), while it was defined as improved (PET/CT partial remission: PET-PR) if the number of sites of FDG uptake decreased and/or the SUV of the lesions decreased. In particular, a decrease of at least 20% in SUV max was considered acceptable to define a PET response, in accordance to European Organization for Research and Treatment of Cancer (EORTC) criteria.
An increase of > 50% of residual PET-FLs or appearance of new FL(s) or EMD by PET/CT were additional criteria to define relapse or progression.
Statistical analysis
Kaplan-Meier analysis was used to estimate time to progression (TTP) or relapse (time from start of treatment to progression or relapse), PFS (time from start of treatment to progression or relapse, or death from any cause), and OS. Survivors were censored at the time of last contact. Posttreatment Kaplan-Meier curves were plotted applying landmark sets from the date of evaluation at the end-of-induction therapy (median: 10 days) and subsequent ASCT(s) (median: 3 months). Between-group comparisons were done using the log-rank test. Multivariate Cox regression analyses, applying landmark techniques regarding posttreatment information, were performed to identify baseline and posttreatment prognostic factors significantly affecting TTP, PFS, and OS. Responses after ASCT by laboratory investigations and PET/CT imaging were compared using the χ2 test. Comparisons between postinduction or post-ASCT(s) and baseline PET/CT were evaluated by use of McNemar test, which compares paired binary data before and after a specific event.
Investigators at Seràgnoli Institute of Hematology at the University of Bologna coordinated the study and contributed to study design, data collection, and analysis. All the authors had access to primary clinical trial data.
Results
Patient characteristics and response to treatment
Three hundred seventy-eight patients with newly diagnosed symptomatic MM were enrolled in the study of TD incorporated into double ASCT. Of these 378 patients, 192 for whom data of PET-CT scans at baseline and after ASCT were available were included in this analysis. The main characteristics at baseline of the whole population and of the 192 patients who formed the basis of the current analysis are summarized in Table 1. Median age of these latter patients was 56 years (range 35-66). Eight percent of them presented with renal impairment (creatinine > 2 mg/dL); 9% had hypercalcemia, while ISS stage II-III was diagnosed in 45%. Overall, 88% of the patients were screened for cytogenetic abnormalities by FISH analysis performed on CD138+ BM plasma cells; del(13q), t(4;14), and del(17p) occurred in 43%, 23%, and 15% of them, respectively. Notably, a higher incidence of t(4;14) and del(17p) was observed in the PET subgroup compared with the entire patient population.
Forty percent of the patients actually received a single ASCT, while in 60% a tandem ASCT was given to support 2 sequential courses of high-dose melphalan. These values were slightly different from those seen in the entire population (Table 1). With a median follow-up of 42 months, the best post-ASCT(s) rates of CR and at least VGPR were 52% and 80%, respectively; the corresponding values for the entire population were 34% and 61% (P = .000 for both response comparisons). Median durations of TTP and PFS were 58 and 56 months, respectively, versuss 58 and 46 months, respectively, in the whole population after a median follow-up of 65 months (P value for PFS comparison = 0.001). The 4-year estimate of OS was 88%, while it was 70% in the whole population, P = .000). The better outcomes observed in the PET subgroup of patients with respect to the whole population can be easily explained by the nature of analyses which were performed (per protocol analysis compared with intention to treat, respectively).
Imaging characteristics at baseline and their impact on clinical outcomes
Twenty-four percent of the patients had a negative PET/CT scan at diagnosis, while 32% showed 1 to 3 FLs and 44% had either a diffuse BM involvement or more than 3 FLs (Table 2). Eighty-five percent of the positive patients had an underlying lytic lesion by CT while 15% had only PET focal areas of increased tracer uptake. In nearly half of the patients (46%), baseline FDG uptake was severe (defined as SUV > 4.2). EMD was present in 6% of the cases. The cutoffs for FLs and SUV were identified after applying sequential log-rank test and selecting the most powerful values for discriminating the outcome.
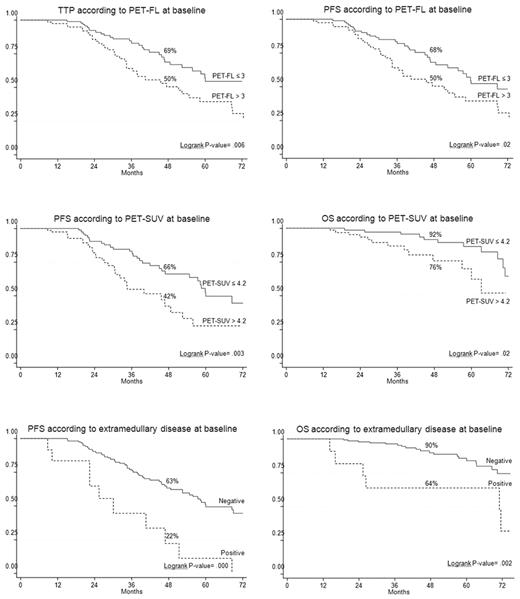
On univariate analysis, the presence of EMD disease, entity of PET/CT involvement, and the degree of FDG uptake at the time of diagnosis were unfavorable prognostic factors (Table 3). In particular, both EMD and severe FDG uptake were significantly associated with shorter PFS and OS. In more detail, patients with presence of EMD had 4-year estimates of PFS and OS of 22% and 64%, respectively, in comparison with corresponding values of 63% (P = .000) and 90% (P = .002) for those who lacked EMD (Figure 1). Similarly, 4-year estimates of PFS and OS for patients with baseline SUV max values superior to 4.2 were significantly shorter than those observed for patients with lower SUV max at the time of diagnosis (PFS: 42% vs 66%, respectively; P = .003; OS: 76% vs 92%, respectively; P = .02; Figure 1). In addition, the entity of PET/CT involvement influenced clinical outcomes. In particular, TTP and PFS values projected at 4 years were 50% each for patients who had either > 3 FLs or diffuse BM uptake compared with 69% (P = .006) and 68% (P = .02), respectively, for those with less severe PET/CT involvement (Figure 1).
In a Cox regression analysis of baseline prognostic factors, the presence of EMD along with a high tumor metabolism at diagnosis were independent predictors of worst TTP, PFS, and OS. TTP and PFS were also negatively influenced by unfavorable cytogenetic abnormalities (Table 4).
Posttreatment imaging characteristics and their prognostic relevance
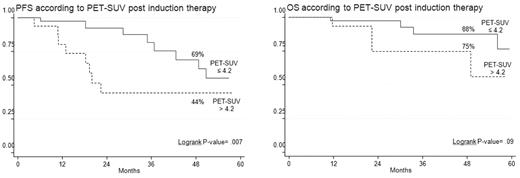
In half of the patients, PET/CT scans were repeated after induction treatment (Table 5). Thirty-seven percent of the patients achieved PET-CR, while the remaining 63% were still PET positive. Among these latter, 14% improved with respect to baseline, 43% were unchanged, and 6% worsened. Persistence of severe FDG uptake after induction therapy was an early predictor of worst long-term clinical outcomes (Table 3). Indeed, the 4-year estimates of PFS and OS for patients with a postinduction SUV max still superior to 4.2 were 44% and 75%, respectively, compared with 69% (P = .007) and 88% (P = .09) values among those with lower SUV max (Figure 2). Moreover, a strong correlation between clinical response and SUV max reduction was evident, the mean SUV value of patients achieving CR being significantly lower in comparison with that of patients reaching VGPR or partial response (PR; Cuzick trend test, P = .016).
After 3 months from ASCT, PET/CT was negative in 65% of patients while it remained positive in 35% who either improved (17%) or had PET/CT scans unchanged or worsened (18%; Table 5). A close relationship was evident between PET/CT findings and clinical response to ASCT because 95% of patients with a negative PET/CT had achieved at least a VGPR (P = .003). PET/CT scans were comparable in patients receiving either a single or a double ASCT.
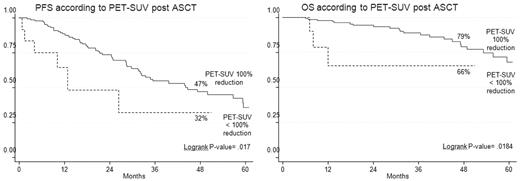
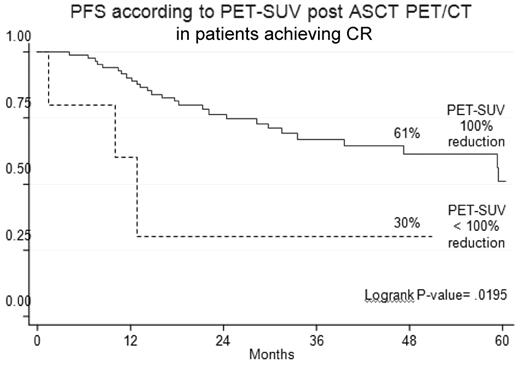
PET-CR after ASCT conferred superior PFS and OS in comparison with persistence of FDG uptake (Table 3). Indeed, the 4-year estimates of PFS and OS for PET/CT-negative patients were 47% and 79%, respectively, compared with values of 32% (P = .02) and 66% (P = .02), respectively, for PET/CT-positive patients (Figure 3). Notably, 23% of patients achieving a CR according to conventional criteria15 still had positive PET/CT scans, a finding which predicted for poorer prognosis. Indeed, the 4-year estimate of PFS for PET-positive patients was significantly shorter in comparison with that of PET-negative patients (30% vs 61%; P = .02; Figure 4).
Outcome according to post-ASCT PET/CT in patients achieving conventionally defined CR.
Outcome according to post-ASCT PET/CT in patients achieving conventionally defined CR.
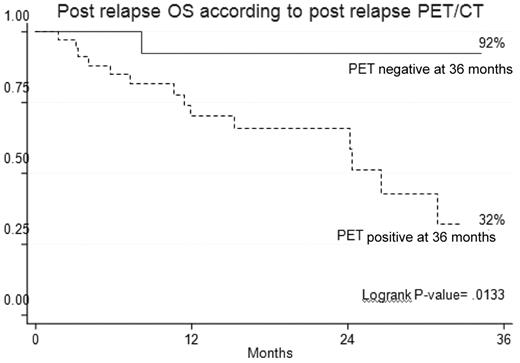
The prognostic value of PET/CT was retained also at the time of relapse. In fact, patients with a positive PET/CT (SUV > 0 and/or FLs > 1 and/or EMD) had a significantly shorter survival with respect to patients with a negative PET/CT scan (Figure 5).
On multivariate analysis, incomplete FDG suppression after ASCT was strongly associated with worst PFS and OS (Table 6). Moreover, presence of EMD at diagnosis, unfavorable cytogenetic abnormalities were additional independent predictors of shorter TTP and PFS.
Discussion
In this prospective study of 192 patients with previously untreated MM who were transplant-eligible and were studied both at baseline and after treatment with FDG PET/CT, we demonstrated that this imaging technique is a reliable predictor of prognosis. Several factors related to myeloma cell burden and/or to the biologic characteristics of the disease at the time of diagnosis have a well-defined prognostic role in MM patients. In particular, β2 microglobulin, albumin, CRP, LDH, cytogenetic abnormalities, and gene array defined profiles are commonly used to classify patients into different stages and risk subgroups.16-18
Despite WBXR still remains the standard tool for the evaluation of bone disease in MM patients,19,20 it is well recognized that this imaging technique underevaluates the extent of skeletal lesions. In a previous analysis, we provided demonstration that when MRI of the spine and pelvis was combined with PET/CT at the onset of MM the ability to detect active sites of the disease, both at the medullary and extramedullary levels, was as high as 92%.9 The impact of PET/CT at diagnosis on long-term clinical outcomes and its relationship with other imaging techniques and prognostic factors was investigated in a series of 239 newly diagnosed MM patients enrolled in Total Therapy 3 incorporating bortezomib and thalidomide into double ASCT.13 The number of PET-FLs was the most important independent variable associated with shorter survival, both overall and event-free. Differently from this study, no relationship between PET/CT involvement at baseline and presence of unfavourable cytogenetic abnormalities was seen in our series of patients.
In the present study, the entity of PET/CT involvement at diagnosis, as reflected by the number of FLs, the intensity of tumor metabolism represented by SUV value and the presence at baseline of EMD were strong predictors of unfavorable clinical outcomes for patients eligible to receive thalidomide-dexamethasone incorporated into double ASCT. In particular, the shortest 4-year estimates of PFS and OS were seen for patients with presence of EMD and high FDG-avidity. Both these factors, along with the presence of a high-risk cytogenetic profile, retained independent prognostic relevance in a multivariate regression analysis. EMD can be detected at the time of diagnosis of MM (eg, primary) or, more commonly, of subsequent relapse or progression (eg, secondary), particularly in patients with prior exposure to high-dose therapy and novel agents. Localizations of myeloma cells outside of the medullary cavity of the bone are a sign of metastatic spread of the disease and can more easily be detected using PET/CT than traditional imaging techniques. Patients with either primary or secondary extramedullary plasmacytomas have an especially dismal clinical outlook because of resistance to therapy, early relapse and shorter survival in comparison with those with conventional MM lacking EMD.13,21 Consistently with previously reported results,15 also in the present series, the risk of progression or death for patients with EMD at diagnosis was more than 5-fold higher than for those lacking EMD and OS duration was also significantly shorter.
Precocious FDG suppression after treatment is a reliable predictor of prognosis in malignant lymphomas, in particular Hodgkin lymphoma,22 and PET is now included in the new International Working Group Guidelines on Lymphoma.23 The potential value of PET/CT as an early predictor of the risk of relapse or progression in MM is less clear. FDG suppression before transplantation was previously identified as an independent favorable prognostic variable for durable disease control and survival, more potent than clinical CR, suggesting that persistent FLs can harbor myeloma cells that may not secret monoclonal protein. Despite PET/CT scans being available after induction therapy in only half of the patients included in the present analysis, permanence of high tumor metabolism before ASCT was associated with a significantly shorter PFS and a strong trend toward reduced OS was also observed.
After 3 months from ASCT, 65% of the patients had a complete normalization of PET/CT. Although PET/CT negativity was strictly linked to the achievement of VGPR or higher, complete FDG suppression after high-dose melphalan was an independent favorable prognostic factor for durable disease control and prolonged OS in a multivariate analysis. In particular, the PFS hazard ratio for patients with persistent FDG uptake was very close to that seen for patients with del(17p) and/or t(4;14). Moreover, PET/CT retained prognostic relevance also in patients achieving conventionally defined CR. In addition to what previously shown,15 in the present study, PET/CT involvement at the time of relapse identified a subset of patients with especially poor prognosis because of a shortened survival after relapse. Despite little differences between the present study and the US study, including the SUV cutoff value or the superior prognostic relevance of SUV versus the number of FLs for OS, PET/CT involvement at diagnosis retained an independent prognostic significance in 2 different series of patients. PET/CT appears also as a reliable tool for predicting the outcomes after treatment, with differences in the time points considered between the 2 studies (before ASCT in the US study, postinduction, and post-ASCT(s) in the present study).
With the availability of newer drugs and different therapeutic options in MM, interest in the evaluation of the depth of response to therapy, particularly CR, has progressively grown. The International Myeloma Working Group has recently proposed the addition of the “stringent CR” category, which requires normalization of the free light chain ratio and the absence of residual clonal cells in the BM by immunofluorescence or immunohistochemistry.24 More sensitive tools, such as multiparametric flow cytometry and PCR, are able to more carefully detect the presence of MRD at the BM level, but fail to identify the persistence of FL(s) potentially harboring nonsecretory MM cells or sites of active disease outside of the medullary cavity of the bone. In the present analysis, 23% of the patients in CR had a persistence of PET/CT FLs. In addition, the heterogeneous pattern of BM plasma cell infiltration represents a potential drawback of these techniques to which PET/CT scanning and/or total body MRI are complementary investigational tools of MRD evaluation.
One concern with the serial use of PET/CT in clinical trials could be the heterogeneity of the visual criteria and the lack of interobserver reproducibility in interpreting the results. Standardization of criteria for PET/CT imaging definitions and use of semi-quantitative SUV evaluations could be of help to consolidate the use of this technique as a prognostic tool.
In conclusion, our results show that PET/CT at diagnosis and after ASCT is a reliable technique for predicting long-term outcomes in autografted MM patients. If these data will be confirmed in larger trials, the serial use of PET/CT after induction treatment and subsequent ASCT could contribute to the design of individualized patients therapies, justifying changes to alternative treatments in those individuals with persistent PET positivity before and after autotransplantation. On the basis of our results, integrating PET/CT scanning into the algorithm of MM follow-up may improve disease management.
An Inside Blood analysis of this article appears at the front of this issue.
The publication costs of this article were defrayed in part by page charge payment. Therefore, and solely to indicate this fact, this article is hereby marked “advertisement” in accordance with 18 USC section 1734.
Acknowledgments
This work was partly supported by the University of Bologna through a Ricerca Fondamentale Orientata grant (M.C.) and by a BolognAIL grant (M.C.).
Authorship
Contribution: E.Z. designed the research study, performed the research, analyzed the data, and wrote the manuscript; F.P. and C.N. performed the research and contributed analytical tools; B.Z. performed the research and gave a substantial contribution in analyzing the data; E.E. helped in collecting data; A.P. performed statistical analysis and contributed to data interpretation; P.T., S.B., G.P., A.B., L.P., C.T., and F.C. performed the research and helped in collecting data; M.B., R.F., and S.F. contributed to data interpretation and approved the manuscript; S.B. and M.C. designed the research study, performed the research, analyzed the data, and critically revised the manuscript. All authors approved the final version of the manuscript and the submission.
Conflict-of-interest disclosure: The authors declare no competing financial interests.
Correspondence: Elena Zamagni, MD, Istituto di Ematologia “Seràgnoli”, Università degli Studi di Bologna–Policlinico S. Orsola-Malpighi, Via Massarenti, 9-40138 Bologna, Italy; e-mail: e.zamagni@unibo.it.

