Abstract
Smad4 is important in the TGF-β pathway and required for transcriptional activation and inhibition of cell growth after TGF-β1 stimulation. We demonstrate that miR-130a is differentially expressed during granulopoiesis and targets Smad4 mRNA. The transcript for Smad4 is present throughout neutrophil maturation, but Smad4 protein is undetectable in the most immature cells, where miR-130a is highly expressed. Two miR-130a binding sites were identified in the 3′-untranslated region of the Smad4 mRNA. Overexpression of miR-130a in HEK293, A549, and 32Dcl3 cells repressed synthesis of Smad4 protein without affecting Smad4 mRNA level. Repression of Smad4 synthesis in a granulocytic cell line by miR-130a reduced its sensitivity to TGF-β1–induced growth inhibition. This effect was reversed by inhibiting the activity of miR-130a with an antisense probe or by expressing a Smad4 mRNA lacking miR-130a binding sites. High endogenous miR-130a and Smad4 mRNA levels and low expression of Smad4 protein were found in the t(8;21)(q22;q22) acute myelogenous leukemia–derived cell line Kasumi-1. When miR-130a was inhibited by an antisense RNA, the amount of Smad4 protein increased in Kasumi-1 cells and rendered it susceptible for TGF-β1–mediated cell growth inhibition. Our data indicate that miR-130a is involved in cell cycle regulation of granulocytic cells through engagement of Smad4 in the TGF-β pathway.
Introduction
Mature neutrophils are generated in the bone marrow (BM) from myeloid precursor cells, the myeloblasts, which divide and mature along a tightly regulated path characterized by cessation of proliferation, nuclear condensation, and sequential acquisition of different types of granules,1 collectively known as granulopoiesis. Granulopoiesis is controlled by intrinsic and extrinsic factors to ensure both a strict control of the stepwise maturation of the cells and to control the rate of production and release to meet the requirements for an adequate defense against microbial infections.2 Under normal conditions, maturation of the neutrophil granulocyte precursors is accompanied by a progressive and differential expression of several transcription factors,3 which regulate cell division4,5 and formation of granules.1 In case of an increased demand for neutrophils, the differentiation process can be adjusted by external stimuli such as G-CSF,6 bacterial products,7 or proinflammatory cytokines8 that induce changes in the level and composition of the transcription factors that control cell proliferation and terminal differentiation.
TGF-β is a potent cytokine that affects many biologic functions such as proliferation, differentiation, and apoptosis, depending on the developmental state and type of cell.9 It has been shown that TGF-β1 inhibits proliferation in quiescent HSCs.10 Members of the TGF-β superfamily of growth factors, including TGF-βs, bind to TGF-β receptor I (TGFβRI) and TGFβRII expressed on the cell surface. Binding of ligands to TGFβRII induces formation of receptor complexes which phosphorylate and activate TGFβRI. The active form of TGFβRI then recruits and phosphorylates the receptor-activated Smads (R-Smad). Phosphorylated R-Smads assemble and form a hetero-oligomeric complex with a common-Smad (Co-Smad). This complex accumulates in the nucleus and binds to specific Smad-binding elements in the promoters of TGF-β–responsive genes where it recruits coactivators and corepressors and thus exerts both a positive and a negative regulation of target gene expression.11,12 Smad2 and Smad3 are R-Smads that transmit TGF-β1/activin-induced signals, whereas Smad1, Smad5, and Smad8 are R-Smads that transmit bone morphogenetic protein–induced signals. Smad6 and Smad7 are inhibitory Smads that regulate TGF-β1 signaling negatively by competitive binding to the TGF-β receptors or to the Co-Smad.12
Smad4 is the only known Co-Smad in mammals and thus plays a central role in the TGF-β–signaling pathway because all R-Smads must form a complex with Smad4 to generate an active transcriptional complex. Complete deficiency of Smad4 is embryonically lethal13 as shown in mouse models and testifies to the importance and central role of Smad4 for normal development. Mutations or deletions in the gene coding for Smad4 have been shown to result in pancreatic cancer14 and juvenile polyposis syndrome.15 A relation between aberrations in the TGFβ–signaling pathway and acute myelogeneous leukemia (AML) has also been reported.16-18
miRNAs are increasingly acknowledged as important regulators of translation and hence protein synthesis. miRNAs are 19-25 nucleotide noncoding RNA molecules that can regulate gene expression posttranscriptionally by binding to partially complementary sequences, mainly in the 3′-untranslated region (3′-UTR) of their target mRNA.19 Binding to the target mRNAs affects the translation or the stability of the transcripts.20,21 To date, > 1100 miRNAs have been predicted to be encoded in the human genome22 and may target > 60% of the mammalian mRNAs.19 Expression of miRNAs is altered in many types of cancer and may be the direct cause of dysregulation of important effecter molecules involved in cellular processes such as proliferation, differentiation, and apoptosis.23-25
Here, we show that the level of miR-130a is high in the most immature precursors of the granulocytic lineage and decreases dramatically when the cells reach the myelocyte stage of differentiation when cell division ceases. We demonstrate that miR-130a targets the transcript for Smad4 and that Smad4 protein is absent from immature granulocytic precursors and from t(8;21)(q22;q22) AML cells despite high expression of Smad4 mRNA. The repression of Smad4 synthesis caused by miR-130a renders the cells less sensitive to TGF-β1–induced growth-inhibition and may thus be a mechanism to control cell proliferation of normal and malignant granulocytic cells.
Methods
Cell cultures
HEK293 cells (ATCC CRL-1573) were cultured in complete Eagle MEM medium (Gibco BRL), 10% FBS (Gibco BRL), and 1% penicillin/streptomycin (P/S; Invitrogen). A549 cells (ATCC CCL-185) were cultured in HAM F12 medium, 10% FBS, and 1% P/S. 32Dcl3 cells (ATCC CRL-11 346) were cultured in RPMI 1640 medium (Invitrogen), 10% non–heat-inactivated FBS (Gibco BRL), 1% P/S, and 1 ng/mL murine IL-3 (Sigma-Aldrich). Kasumi-1 cells (ATCC CLR-2724) were cultured in RPMI 1640 medium with 20% FBS and 1% P/S.
Isolation of cells from blood and BM
BM samples and peripheral blood neutrophils were isolated as described previously3 from healthy donors who gave informed consent. Mononuclear cells were isolated from fresh BM samples of patients with AML with t(8;21)(q22;q22) by density centrifugation (Ficoll-Hypaque). The study was approved by The Danish National Committee on Biomedical Research Ethics.
Plasmid constructs
Human BM cDNA (Clontech) was used as template to clone SMAD4–3′-UTR segments containing the predicted miR-130a target sites by PCR amplification with the use of the following primers: Site-1, 5′-ACACTAGTGTATCTTGGGGCAAGACTGC-3′ and 5′-ACACGCGTAGATAATCAGGTCTATTTCTGC-3′; Site-2, 5′-ACACGCGTAGGAAAACCTTTGGTGAAGAC-3′ and 5′-ACAAGCTTTCACTTAGAATTTCAGAGCTGG-3′. The site-1 PCR product was digested with SpeI and MluI and cloned into pMIR-REPORT (Ambion) digested with the same enzymes. After the site-2 PCR product was digested with MluI and HindIII and was inserted into the pMIR-REPORT-siteI plasmid digested with the same enzyme generating pMIR-REPORT-wt1/wt2. Site-directed mutagenesis was performed with the QuickChange protocol (Stratagene) with the following primers: pMIR-mut1, 5′-TTTAAGATTTTTTTTTTCTTAACGTGATTTGAGTCCAATCTCAGTGATG-3′ and 5′-CATCACTGAGATTGGACTCAAATCACGTTAAGAAAAAAAAAATCTTAAAA-3, and pMIR-mut2, 5′-TGCTCTGG GTTGGGCCAGACAGAACGTGACTCTAGTTTGCCCTCTGCCA-3′ and 5′-TGGAGAGGGCAAACTAGAGTCACGTTCTGTCTGGCCCAACCCAGAGCCA-3′. The coding region of SMAD4 was PCR-amplified with IMAGE clone 2961238 (Source BioScience LifeSciences) as template with the use of the primers 5′-ACGGTACCGACAATATGTCTATTACGAATAC-′3 and 5′-ACGGATCCTCAGTCTAAAGG TTGTGGGTC-′3. The PCR product was digested with KpnI and BamHI and cloned into the expression vector pcDNA3.1 (Invitrogen) digested with the same enzymes. The correctness of the cloned fragments was confirmed by DNA sequencing. The expression plasmids pEGP-miR-130a, pEGF-miR-223, and pEGP-miR-Null were obtained from Cell Biolabs, pmiRZIP-130a and pmiRZIP-null were from System Bioscience, and pGIPZ-shSMAD4 and pGIPZ-control were from OpenBiosystems.
Cell transfection and reporter enzyme assay
HEK293 and A549 cells were transfected with pre–miR-130a/scrambled-miRNA (Ambion), anti–miR-130a-LNA/scrambled-LNA (Exiqon), or siRNA-Smad4/siRNA–negative control 1 (Ambion) with the use of Lipofectamine 2000 according to the manufacturer's recommendations. The cells were harvested 48 hours after transfection, and protein and RNA were purified for further analysis. A549 cells were cotransfected with the TGF-β1–inducible luciferase reporter plasmid CAGA12-MLP-Luc,26 the pGL4.74 control vector, and pre–miR-130a, scrambled-miRNA, siRNA-Smad4, or siRNA-negative control 1, respectively, with the use of Lipofectamine 2000. The cells were grown for 24 hours followed by 6 hours of stimulation with recombinant human TGF-β1 (20nM; eBioscience). Luciferase activity was measured 36 hours after transfection with the use of the Dual-Luciferase Reporter Assay System.
Electroporation
For stable transfection 32Dcl3 cells were transfected with 2 μg of linerized plasmid in 100 μL of Ingenio electroporation solution (Mirus) and were electroporated with the AMAXA nucleofection systems (program E-032) according to the manufacturer's recommendations. After electroporation, the cells were grown for 2 days and then selected for positive clones by adding 2 μg/mL of puromycin (Invitrogen) or 400 μg/mL G418 (Gibco, BRL). Transient transfection of 32Dcl3 cells with CAGA12-MLP-Luc and pGL4.74 as well as with the pMIR-REPORT constructs, pGL4.74, pre– miR-130a/scrambled-miRNA, or anti–miR-130a-LNA/scrambled-LNA were performed as described earlier. TGF-β1 stimulation and analysis of CAGA12-MLP-Luc–transfected 32Dcl3 cells were performed as described for A549 cells. Kasumi-1 cells were transiently transfected as mentioned earlier with the use of program W-01.
Cell growth analysis
Kasumi-1 cells, 32Dcl3 clones, or wild-type cells (50 000 cells/mL) were cultured in normal medium with or without 20nM TGF-β1. Cell number was measured by counting the cells at day 4 with the use of an automatic cell counter (Culter Z1; Beckman).
SDS-PAGE and immunoblotting
Cell samples were run on 12% SDS gel and transferred to nitrocellulose membrane. Proteins were detected with primary Ab against Smad4 (B8; Santa Cruz Biotechnology Inc) or β-actin (13E5; Cell Signaling) and HRP-conjugated secondary Abs (Dako). Quantification of the band intensities was performed with Quantity One 4.6 software (Bio-Rad).
RNA isolation
Cells were pelleted and resuspended in TRIzol Reagent (Invitrogen) for RNA isolation according to the manufacturer's instructions. The amount of RNA was measured on a NanoDrop (Thermo Scientific).
cDNA synthesis and mRNA detection
One microgram of RNA was transcribed into cDNA with the use of Superscript II Reverse Transcriptase (Invitrogen) according to the manufacturer's instructions. Real-time PCR was performed in triplicate with the use of 5 μL of cDNA diluted 1:25 in diethyl pyrocarbonate–treated water, 5 μL of TaqMan Universal PCR Master Mix (Applied Biosystems), and 0.5 μL of 20 × Assays-on-Demand Gene Expression Assay Mix (Applied Biosystems) specific for the mRNA transcript to be investigated (murine-Smad4, Mm01262405_m1; human-SMAD4, Hs00929647_m1; ELA2, Hs00236952_m1; and MPO, Hs00165162_m1). The samples were amplified and analyzed with the 3000-P real-time PCR machine (Stratagene). Either mouse (4352341E) or human (4326315E) β-actin endogenous control was used for normalization.
cDNA synthesis and miRNA detection
Reverse transcription of miRNA to first-strand cDNA stem-loop primers was performed according to the manufacturer's instructions (Applied Biosystems) with the use of the following reagents: miR-130a (RT454) and miR-223 (RT526) with RNU6B (RT1093) or SNO234 (RT1234) as internal normalizer in human and murine cells, respectively. Real-time PCR was performed in triplicate with the use of TaqMan MicroRNA Assays (20×) specific for the miRNA transcript to be investigated (miR-130a, TM454; miR-223, TM526; RNU6B, TM1093; and Sno234,TM 1234). The samples were analyzed on a 3000-P real-time PCR machine. All microarray data are available on the Gene Expression Omnibus under accession no. GSE33140.
Results
Expression of miR-130a and Smad4 during granulopoiesis
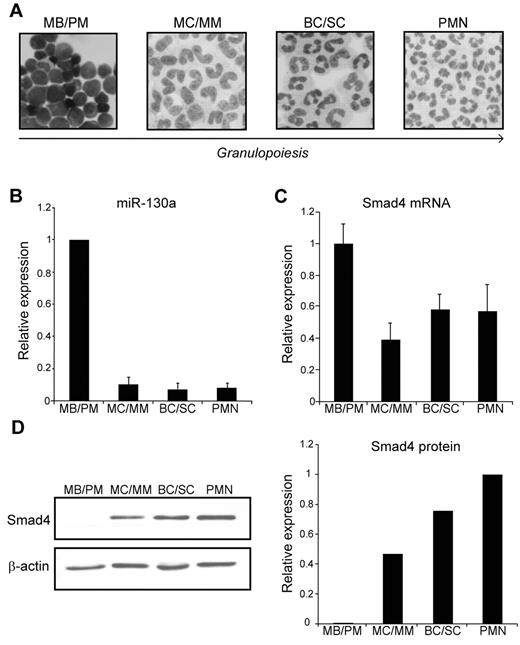
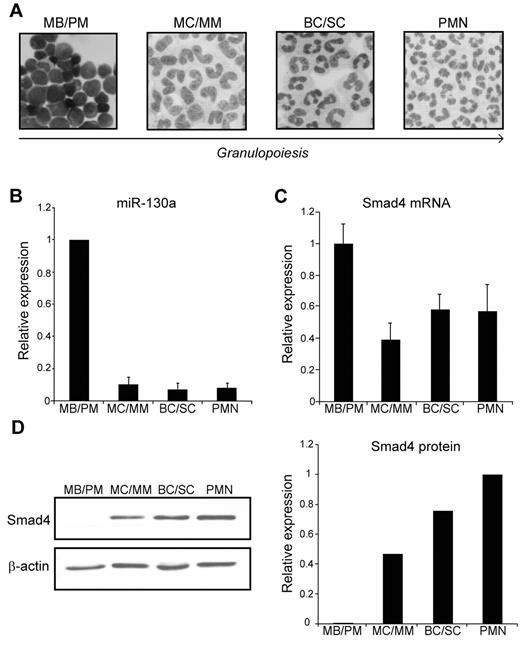
To study the expression profile of miRNAs and proteins during granulopoiesis, we separated neutrophil precursors from human BM by density centrifugation on a Percoll density gradient whereby we obtained 3 cell fractions enriched in myeloblasts and promyelocytes (MBs and PMs), myelocytes and metamyelocytes (MCs and MMs) and band cells and segmented cells (BCs and SCs), respectively.27 These cells were further purified by immunomagnetic depletion of nonneutrophilic cells, which resulted in neutrophil cell populations of 95%-99% purity.3 Mature polymorphonuclear neutrophils were isolated from peripheral blood by a similar technique3 (Figure 1A). RNA was isolated from the different cell populations and analyzed for miRNA expression by hybridization to an LNA-based miRNA microarray. We found that miR-130a was highly expressed in the most immature granulocyte precursor population (MB/PM) and displayed a significant lower expression in more mature granulocytic precursors (data not shown). This expression profile was confirmed by quantitative real-time PCR analysis (Figure 1B).
Expression of miR-130a and Smad4 during granulopoiesis. (A) Cytospins of purified cells displaying the structure of the 4 subpopulations isolated from BM (MBs and PMs, MCs and MMs, and BCs and SCs), and from peripheral blood (PMN). The arrow indicates cells of increasing maturity. Images were acquired on a Olympus BX51 (60×/1.40 PlanApopchromat oil objective, florescences free immersion oil (Applichem) microscope using Olympus DP 70 camera and analyzed with analySIS B software package (Olympus). (B) The average miRNA expression levels in 6 donors determined by real-time PCR. The SD refers to differences between donors. (C) The relative expression level of Smad4 mRNA in the isolated subpopulations determined by real-time PCR after normalization to β-actin. Data are shown as the mean ± SD from triplicate measurements. (D left) Representative immunoblot of Smad4 protein expression in the 4 isolated subpopulations. The right panel shows the relative expression of Smad4 normalized to β-actin expression. The experiment was repeated 3 times with similar results. The highest value among those being compared was assigned the value 1, and the relative expression of the other samples was recalculated accordingly.
Expression of miR-130a and Smad4 during granulopoiesis. (A) Cytospins of purified cells displaying the structure of the 4 subpopulations isolated from BM (MBs and PMs, MCs and MMs, and BCs and SCs), and from peripheral blood (PMN). The arrow indicates cells of increasing maturity. Images were acquired on a Olympus BX51 (60×/1.40 PlanApopchromat oil objective, florescences free immersion oil (Applichem) microscope using Olympus DP 70 camera and analyzed with analySIS B software package (Olympus). (B) The average miRNA expression levels in 6 donors determined by real-time PCR. The SD refers to differences between donors. (C) The relative expression level of Smad4 mRNA in the isolated subpopulations determined by real-time PCR after normalization to β-actin. Data are shown as the mean ± SD from triplicate measurements. (D left) Representative immunoblot of Smad4 protein expression in the 4 isolated subpopulations. The right panel shows the relative expression of Smad4 normalized to β-actin expression. The experiment was repeated 3 times with similar results. The highest value among those being compared was assigned the value 1, and the relative expression of the other samples was recalculated accordingly.
A computational analysis with the use of TargetScan predicted that miR-130a targets the mRNA for Smad4 as well as several other members involved in the signaling pathway induced by the TGF-β superfamily of regulatory proteins (Table 1). However, because Smad4 is the only known Co-Smad and thus plays an essential role in the TGF-β signaling pathway, we chose to focus our investigation on the effect of miR-130a on Smad4 mRNA and the possible biological consequence of this.
To examine the pattern of Smad4 mRNA expression during granulopoiesis, we analyzed the RNA from the 4 neutrophil cell populations by real-time PCR. As shown in Figure 1C, transcripts for Smad4 could be measured throughout granulopoiesis with a slightly higher expression in the MB/PM fraction. As mentioned earlier, miR-130a displays a strong expression only in the MB/PM precursor population. If Smad4 mRNA was a target for miR-130a, a lower expression of Smad4 protein would be expected in MBs/PMs than in the more mature neutrophil precursors. This is indeed the case as seen in Figure 1D, which shows a low Smad4 protein expression in the MB/PM cells and a progressively higher expression as the cells mature. These data support the idea that miR-130a is involved in translational repression of Smad4 mRNA.
Effect of miR-130a on Smad4 expression
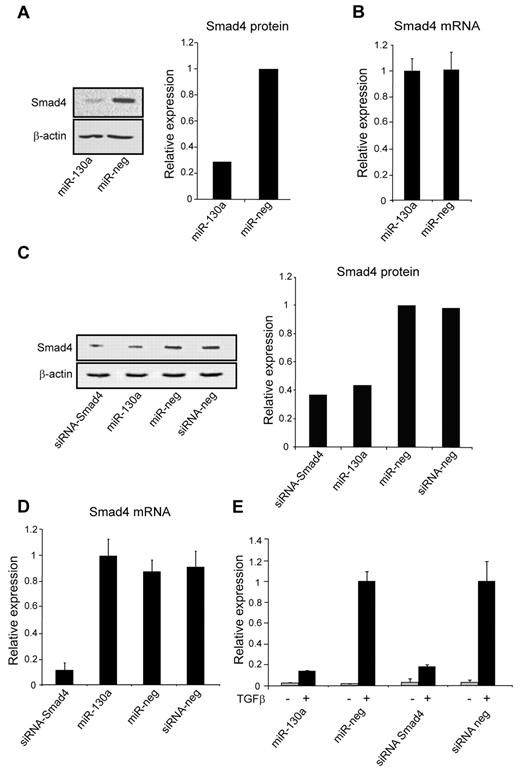
To examine whether Smad4 is a target for miR-130a, we transiently overexpressed miR-130a in 2 human derived cell lines with low (HEK293) and high (A549) levels of endogenous miR-130a, respectively (supplemental Figure 1, available on the Blood Web site; see the Supplemental Materials link at the top of the online article). HEK293 cells were transiently transfected with either pre–miR-130a or a scrambled pre-miRNA. Protein and mRNA were isolated 48 hours after transfection and analyzed. A 5-fold reduction of Smad4 protein was observed when miR-130a was overexpressed in HEK293 cells compared with mock-transfected cells, whereas the level of Smad4 mRNA was unaffected (Figure 2A-B). A549 cells were also transfected with pre–miR-130a as well as with an siRNA against SMAD4 that induces a cleavage of the transcript. As expected, this resulted in a decrease of Smad4 mRNA as assessed by quantitative RT-PCR (Figure 2D), and both the siRNA against SMAD4 and miR-130a induced a significant decrease in the level of Smad4 protein (Figure 2C). To further elucidate the effect of miR-130a on Smad4, we used the TGF-β1–inducible luciferase reporter plasmid (CAGA12-MLP-Luc) that carries the Smad-binding element of the plasminogen activator inhibitor-1 gene.26 We reasoned that if miR-130a reduced the endogenous level of Smad4, then luciferase expression from CAGA12-MLP-Luc should also be reduced on stimulation with TGF-β1. To investigate this, we cotransfected A549 cells with the CAGA12-MLP-Luc reporter construct along with pre–miR-130a, a scrambled miRNA, an siRNA against Smad4, or a scrambled siRNA, respectively. In the absence of TGF-β1, there was no or low luciferase expression, whereas a strong induction of luciferase activity was observed in cells stimulated with TGF-β1 (Figure 2E). The TGF-β1–induced expression was, however, 5-6 timers lower in the cells cotransfected with pre–miR-130a and siRNA-Smad4 compared with those transfected with scrambled miRNA or scrambled siRNA (Figure 2E). This shows that overexpression of miR-130a can decrease the Smad4 level sufficiently to reduce expression from a Smad4-dependent luciferase reporter plasmid.
Effect of miR-130a on Smad4 expression. (A) HEK293 cells were transfected with miR-130a and a scrambled pre-miR (miR-neg), respectively. The immunoblot shows down-regulation of Smad4 protein in cells transfected with pre-miR-130a compared with scramble pre-miR at 48 hours. The graph displays the relative expression of Smad4, normalized to β-actin expression. The experiment was repeated 3 times with similar results. (B) The relative expression of Smad4 mRNA in HEK293 cells transfected with pre–miR-130a and miR-neg as in panel A. The Smad4 mRNA level was measured by real-time PCR and normalized to β-actin expression. Data are shown as the mean ± SD from triplicate measurements. (C) Western blot analysis showing the expression level of Smad4 protein in A549 cells transfected with siRNA-Smad4, pre–miR-130a, miR-neg, or siRNA-neg at 48 hours after transfection. The graph shows the relative expression of Smad4 normalized to β-actin expression. (D) The relative expression level of Smad4 mRNA in A549 cells transfected with siRNA-Smad4, pre–miR-130a, miR-neg, or siRNA-neg at 48 hours after transfection. Smad4 mRNA expression was measured by real-time PCR and normalized to β-actin expression. Data are shown as the mean ± SD from triplicate measurements. (E) A549 cells were cotransfected with a TGF-β inducible firefly luciferase reporter plasmid (CAGA12-MLP-Luc) that carries the Smad-binding element of the plasminogen activator inhibitor-1 gene, a renilla luciferase reporter for normalization of transfection, and with siRNA-Smad4, pre–miR-130a, miR-neg, or siRNA-neg, respectively. The cells were cultured in standard medium for 24 hours and then incubated with or without human recombinant TGF-β1 (20nM) for an additional 6 hours before determination of luciferase activity by use of the Dual-Luciferase Reporter Assay System. The experiment was repeated 3 times with similar results. The highest value in the transfection series was assigned the value 1, and the relative expression of the other samples was recalculated accordingly.
Effect of miR-130a on Smad4 expression. (A) HEK293 cells were transfected with miR-130a and a scrambled pre-miR (miR-neg), respectively. The immunoblot shows down-regulation of Smad4 protein in cells transfected with pre-miR-130a compared with scramble pre-miR at 48 hours. The graph displays the relative expression of Smad4, normalized to β-actin expression. The experiment was repeated 3 times with similar results. (B) The relative expression of Smad4 mRNA in HEK293 cells transfected with pre–miR-130a and miR-neg as in panel A. The Smad4 mRNA level was measured by real-time PCR and normalized to β-actin expression. Data are shown as the mean ± SD from triplicate measurements. (C) Western blot analysis showing the expression level of Smad4 protein in A549 cells transfected with siRNA-Smad4, pre–miR-130a, miR-neg, or siRNA-neg at 48 hours after transfection. The graph shows the relative expression of Smad4 normalized to β-actin expression. (D) The relative expression level of Smad4 mRNA in A549 cells transfected with siRNA-Smad4, pre–miR-130a, miR-neg, or siRNA-neg at 48 hours after transfection. Smad4 mRNA expression was measured by real-time PCR and normalized to β-actin expression. Data are shown as the mean ± SD from triplicate measurements. (E) A549 cells were cotransfected with a TGF-β inducible firefly luciferase reporter plasmid (CAGA12-MLP-Luc) that carries the Smad-binding element of the plasminogen activator inhibitor-1 gene, a renilla luciferase reporter for normalization of transfection, and with siRNA-Smad4, pre–miR-130a, miR-neg, or siRNA-neg, respectively. The cells were cultured in standard medium for 24 hours and then incubated with or without human recombinant TGF-β1 (20nM) for an additional 6 hours before determination of luciferase activity by use of the Dual-Luciferase Reporter Assay System. The experiment was repeated 3 times with similar results. The highest value in the transfection series was assigned the value 1, and the relative expression of the other samples was recalculated accordingly.
Biologic effect of increased miR-130a expression
Next, we wanted to investigate whether miR-130a–induced repression of Smad4 expression would affect signaling through the TGF-β pathway and thus affect the growth of myeloid cells. Stimulation with TGF-β1 has been shown to inhibit proliferation and thus play an important role in constraining cellular growth.28 For this purpose, we used an immortalized murine myeloblast-like cell line (32Dcl3) that expresses a high level of Smad4 and is sensitive to TGF-β1.17
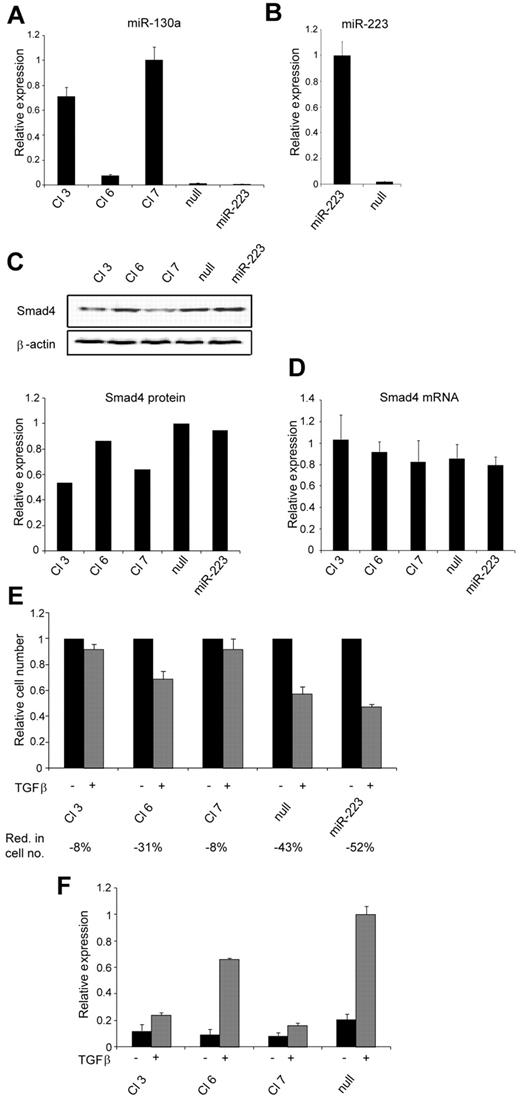
To ensure a permanent up-regulation of miR-130a that would allow us to investigate a possible biologic effect of this miRNA, we made stable transfections of 32Dcl3 cells with a plasmid that expresses miR-130a. As controls 32Dcl3 cells were transfected with an empty vector and with a plasmid that express miR-223 to ensure that our results were not because of off-target effects caused by overexpression of a microRNA. The level of miR-130a expression varied between the different clones (Figure 3A), and a correlation between the level of miR-130a and the amount of Smad4 protein in the cells was observed (Figure 3A,C). In cells with high miR-130a expression (clones 3 and 7) a low Smad4 protein level was found, whereas in cells with low miR-130a expression (clones 6, miR-null, and miR-223) a high amount of Smad4 protein was observed. Again, the differences in Smad4 protein levels in the clones were not caused by differences in the amount of Smad4 mRNA because almost identical transcript levels were seen in the cells (Figure 3D). Next, a proliferation assay was performed with the clones in the presence or absence of TGF-β1. Compared with unstimulated cells, the reduction in cell growth on TGF-β1 stimulation in clones with high miR-130a expression was not as prominent as in the cells with low or no miR-130a expression (Figure 3E). For the clones with a high miR-130a expression level only a slight reduction of cell number was observed after stimulation with TGF-β1 for 4 days (clones 3 and 7 both showed a mean reduction of 8%). In contrast, a strong repression of cell growth was observed for the clones with low miR-130a expression with a 31%, 43%, and 52% mean reduction of cell numbers at day 4 for clone 6, miR-null, and miR-223, respectively (Figure 3E). More cells were in the G1/G0 phase of the cell cycle when stimulated with TGF-β1, but the effect was less pronounced in cells with high miR-130a expression and consequently low Smad4 level (supplemental Figure 2). Increased expression of miR-130a did not induce apoptosis (supplemental Figure 3B) or granulocytic differentiation (all clones appeared myeloblast-like; supplemental Figure 3A) and did not express promyelocytic markers (supplemental Figure 4). As in epithelial cells the effect on Smad4 expression by miR-130a could also be monitored by the TGF-β1 reporter CAGA12-MLP-Luc (Figure 3F). Together, these results show that the reduced Smad4 level in cells with high miR-130a expression lowers the sensitivity to TGF-β1 stimulation and allows the cells to continue their proliferation at a higher rate without inducing apoptosis or granulocytic maturation.
Biologic effect of increased miR-130a expression. Stable transfection of 32Dcl3 cells with the pEGP-miR-130a, pEGP-miR-223, or pEGP-miR-Null vectors was performed, generating 3 pEGP-miR-130a (Cl 3, Cl 6, and Cl 7) clones, 1 pEGP-miR223 (miR-223) clone, and 1 pEGP-miR-null (null) clone. (A) Relative miR-130a expression in Cl 3, Cl 6, Cl 7, null, and miR-223 was determined by real-time PCR and normalized to Sno234 expression. (B) Relative miR-223 expression in clone miR-223 and null was determined by real-time PCR and normalized to Sno234 expression. (C) Immunoblot showing Smad4 protein expression in the Cl 3, Cl 6, Cl 7, null, and miR-223 clones. The graph shows the relative expression of Smad4 protein relative to the expression of β-actin. The highest value among those being compared was assigned the value 1, and the remaining values were recalculated accordingly. (D) The relative expression level of Smad4 mRNA in the Cl 3, Cl 6, Cl 7, null, and miR-223 clones was measured by real-time PCR and normalized to β-actin expression. Data are shown as the mean ± SD from triplicate measurements. (E) Cell proliferation assays were performed with the clones Cl 3, Cl 6, Cl 7, null, and miR-223 in the presence or absence of human recombinant TGF-β1 (20nM). The graph shows the relative number of cells after 4 days when TGF-β1–stimulated cells are compared with unstimulated cells for each clone. The mean reduction in cell number (Red. in cell no.) for TGF-β1–stimulated cells for each clone was 8% for Cl 3, 31% for Cl 6, 8% for Cl 7, 43% for null, and 52% for miR-223 (the values are based on 3 independent growth experiments). The cell number for the unstimulated cells was assigned the value 1, and the relative number of TGF-β1–stimulated cells was recalculated accordingly. (F) The clones Cl 3, Cl 6, Cl 7, and null were cotransfected with the TGF-β1–inducible firefly luciferase reporter plasmid CAGA12-MLP-Luc, along with a renilla luciferase reporter for normalization of transfection. The cells were cultured in standard medium for 24 hours and then incubated with or without human recombinant TGF-β1 (20nM) for an additional 6 hours before determination of luciferase activity by use of the Dual-Luciferase Reporter Assay System. The experiment was repeated 3 times with similar results. The highest value in the transfection series was assigned the value 1, and the relative expression of the other samples was recalculated accordingly.
Biologic effect of increased miR-130a expression. Stable transfection of 32Dcl3 cells with the pEGP-miR-130a, pEGP-miR-223, or pEGP-miR-Null vectors was performed, generating 3 pEGP-miR-130a (Cl 3, Cl 6, and Cl 7) clones, 1 pEGP-miR223 (miR-223) clone, and 1 pEGP-miR-null (null) clone. (A) Relative miR-130a expression in Cl 3, Cl 6, Cl 7, null, and miR-223 was determined by real-time PCR and normalized to Sno234 expression. (B) Relative miR-223 expression in clone miR-223 and null was determined by real-time PCR and normalized to Sno234 expression. (C) Immunoblot showing Smad4 protein expression in the Cl 3, Cl 6, Cl 7, null, and miR-223 clones. The graph shows the relative expression of Smad4 protein relative to the expression of β-actin. The highest value among those being compared was assigned the value 1, and the remaining values were recalculated accordingly. (D) The relative expression level of Smad4 mRNA in the Cl 3, Cl 6, Cl 7, null, and miR-223 clones was measured by real-time PCR and normalized to β-actin expression. Data are shown as the mean ± SD from triplicate measurements. (E) Cell proliferation assays were performed with the clones Cl 3, Cl 6, Cl 7, null, and miR-223 in the presence or absence of human recombinant TGF-β1 (20nM). The graph shows the relative number of cells after 4 days when TGF-β1–stimulated cells are compared with unstimulated cells for each clone. The mean reduction in cell number (Red. in cell no.) for TGF-β1–stimulated cells for each clone was 8% for Cl 3, 31% for Cl 6, 8% for Cl 7, 43% for null, and 52% for miR-223 (the values are based on 3 independent growth experiments). The cell number for the unstimulated cells was assigned the value 1, and the relative number of TGF-β1–stimulated cells was recalculated accordingly. (F) The clones Cl 3, Cl 6, Cl 7, and null were cotransfected with the TGF-β1–inducible firefly luciferase reporter plasmid CAGA12-MLP-Luc, along with a renilla luciferase reporter for normalization of transfection. The cells were cultured in standard medium for 24 hours and then incubated with or without human recombinant TGF-β1 (20nM) for an additional 6 hours before determination of luciferase activity by use of the Dual-Luciferase Reporter Assay System. The experiment was repeated 3 times with similar results. The highest value in the transfection series was assigned the value 1, and the relative expression of the other samples was recalculated accordingly.
Main effect of miR-130a on TGF-β1–mediated growth inhibition is through Smad4
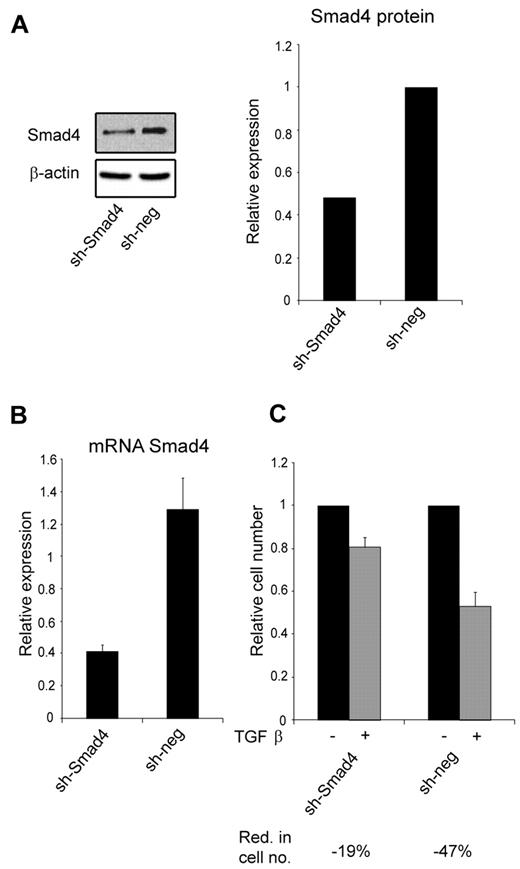
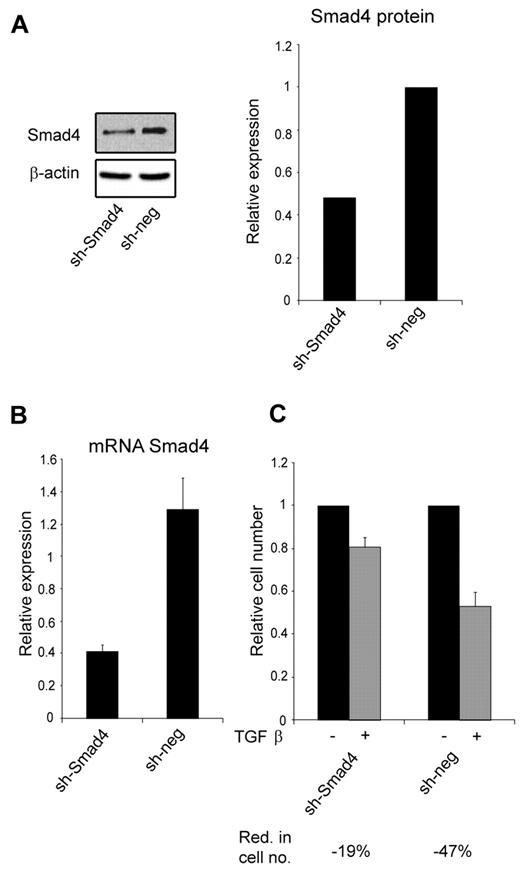
Because miR-130a potentially targets other members of the TGF-β–signaling pathway (Table 1), we transfected 32Dcl3 cells with a shRNA against SMAD4 to see whether it would mimic the effect of overexpressing miR-130a. This was indeed the case, because knockdown of Smad4 synthesis had a similar effect on TGF-β1–inhibited cell growth (Figure 4C) as high expression of miR-130a (Figure 3E).
The effect of knocking-down Smad4 expression with a shRNA against Smad4 mRNA. (A) Immunoblot showing Smad4 protein expression in 32Dcl3 stably transfected with a plasmid encoding a short hairpin against Smad4 (sh-Smad4) or a nonsilencing short hairpin (sh-neg), respectively. The graph shows the relative expression of Smad4 normalized to β-actin expression. (B) The relative expression level of Smad4 mRNA in the 32Dcl3 clones sh-Smad4 and sh-neg, respectively. Smad4 mRNA expression was measured by real-time PCR and normalized to β-actin expression. Data are shown as the mean ± SD from triplicate measurements. (C) Cell proliferation assays were performed with the 32Dcl3 clones sh-Smad4 and sh-neg in the presence or absence of human recombinant TGF-β1 (20nM). The graph shows the relative number of cells after 4 days when TGF-β1–stimulated cells are compared with unstimulated cells for each clone. The reduction in cell number (Red. in cell no.) for TGF-β1–stimulated cells for each clone was 19% for sh-Smad4 and 47% for sh-neg. The cell number for the unstimulated cells was assigned the value 1, and the relative number of TGF-β1–stimulated cells was recalculated accordingly.
The effect of knocking-down Smad4 expression with a shRNA against Smad4 mRNA. (A) Immunoblot showing Smad4 protein expression in 32Dcl3 stably transfected with a plasmid encoding a short hairpin against Smad4 (sh-Smad4) or a nonsilencing short hairpin (sh-neg), respectively. The graph shows the relative expression of Smad4 normalized to β-actin expression. (B) The relative expression level of Smad4 mRNA in the 32Dcl3 clones sh-Smad4 and sh-neg, respectively. Smad4 mRNA expression was measured by real-time PCR and normalized to β-actin expression. Data are shown as the mean ± SD from triplicate measurements. (C) Cell proliferation assays were performed with the 32Dcl3 clones sh-Smad4 and sh-neg in the presence or absence of human recombinant TGF-β1 (20nM). The graph shows the relative number of cells after 4 days when TGF-β1–stimulated cells are compared with unstimulated cells for each clone. The reduction in cell number (Red. in cell no.) for TGF-β1–stimulated cells for each clone was 19% for sh-Smad4 and 47% for sh-neg. The cell number for the unstimulated cells was assigned the value 1, and the relative number of TGF-β1–stimulated cells was recalculated accordingly.
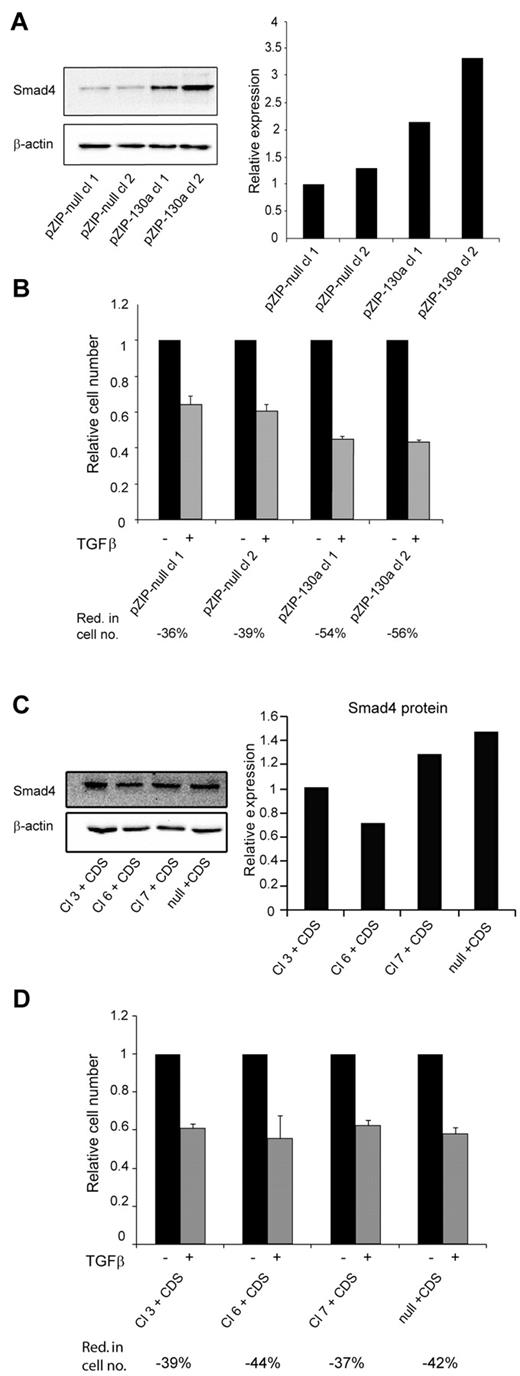
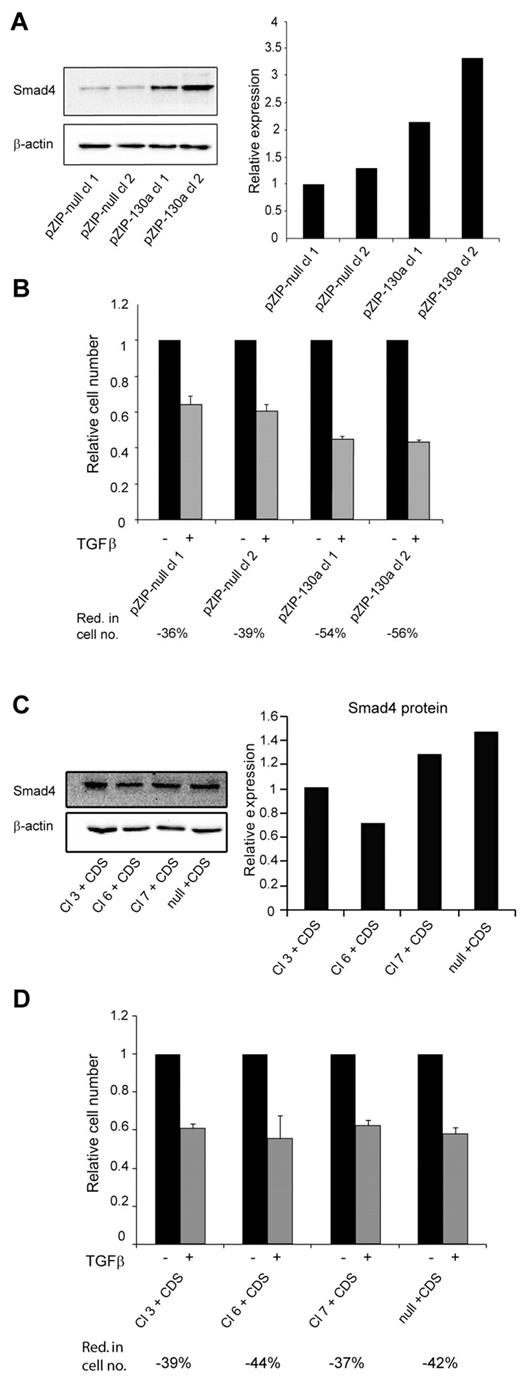
To further validate the importance of miR-130a we transfected 32Dcl3 cells with a vector (pmiRZIP-130a) encoding an antisense RNA to miR-130a. The level of Smad4 was higher in the 2 clones expressing anti–miR-130a than in the clones expressing nonsense RNA (Figure 5A). In accordance with our previous results the increased level of Smad4 rendered the pmiRZIP-130a clones more sensitive to TGF-β1–mediated growth inhibition as determined by cell number analysis (Figure 5B) and by cell cycle profiling (supplemental Figure 6). Finally, we wanted to determine whether the effects observed in the 4 miR-130a–expressing 32Dcl3 clones (3, 6, 7, and null) could be reversed by transfecting them with a plasmid that expresses a Smad4 mRNA lacking the miR-130a binding sites in its 3′-UTR. As shown in Figure 5C the level of Smad4 is quite similar in these cells, and the cells responded almost identically to TGF-β1 stimulation with a 40% reduction in cell number (Figure 5D) and an increase of cells in the G1/G0 phase (supplemental Figure 7).
TGF-β1 sensitivity is restored by antisense RNA against miRNA-130a or expression of a Smad4 mRNA lacking miR-130a–binding sites. (A) 2 32Dcl3 clones stably transfected with pmiRZIP-130a (pZIP-130a–cl 1 and pZIP-130a–cl 2) or pmiRZIP-null (pZIP-null–cl 1and pZIP-null–cl 2) were tested for Smad4 expression by immunoblotting. The graph shows the relative expression of Smad4 normalized to β-actin expression. (B) Cell proliferation assays were performed with pZIP-null–cl 1, pZIP-null–cl 2, pZIP-130a–cl 1, and pZIP-130a–cl 2 in the presence or absence of human recombinant TGF-β1 (20nM). The mean reduction in cell number (Red. in cell no.) for TGF-β1–stimulated cells for each clone was 36% for pZIP-null–cl 1, 39% for pZIP-null–cl 2, 54% for pZIP-130a–cl 1, and 56% for pZIP-130a–cl 2 (the values are based on 3 independent growth experiments). (C) The 4 clones stably transfected with pEGP-miR-130a (Cl 3, Cl 6, and Cl 7) and pEGP-null (null) were stably transfected with a plasmid expressing Smad4 mRNA with a 3′-UTR lacking the miR-130a-binding sites (CDS). The immunoblot shows Smad4 protein expression in the clones Cl 3 + CDS, Cl 6 + CDS, Cl 7 + CDS, and null + CDS. The graph shows the relative expression of Smad4 normalized to β-actin expression. (D) Cell proliferation assays were performed with the clones Cl 3 + CDS, Cl 6 + CDS, Cl 7 + CDS, and null + CDS in the presence or absence of human recombinant TGF-β1 (20nM). The cell number for the unstimulated cells was assigned the value 1, and the relative number of TGF-β1–stimulated cells was recalculated accordingly. The mean reduction in cell number (Red. in cell no.) for TGF-β1–stimulated cells for each clone was 39% for Cl 3 + CDS, 44% for Cl 6 + CDS, 37% for Cl 7 + CDS, and 42% for null + CDS (the values are based on 3 independent growth experiments).
TGF-β1 sensitivity is restored by antisense RNA against miRNA-130a or expression of a Smad4 mRNA lacking miR-130a–binding sites. (A) 2 32Dcl3 clones stably transfected with pmiRZIP-130a (pZIP-130a–cl 1 and pZIP-130a–cl 2) or pmiRZIP-null (pZIP-null–cl 1and pZIP-null–cl 2) were tested for Smad4 expression by immunoblotting. The graph shows the relative expression of Smad4 normalized to β-actin expression. (B) Cell proliferation assays were performed with pZIP-null–cl 1, pZIP-null–cl 2, pZIP-130a–cl 1, and pZIP-130a–cl 2 in the presence or absence of human recombinant TGF-β1 (20nM). The mean reduction in cell number (Red. in cell no.) for TGF-β1–stimulated cells for each clone was 36% for pZIP-null–cl 1, 39% for pZIP-null–cl 2, 54% for pZIP-130a–cl 1, and 56% for pZIP-130a–cl 2 (the values are based on 3 independent growth experiments). (C) The 4 clones stably transfected with pEGP-miR-130a (Cl 3, Cl 6, and Cl 7) and pEGP-null (null) were stably transfected with a plasmid expressing Smad4 mRNA with a 3′-UTR lacking the miR-130a-binding sites (CDS). The immunoblot shows Smad4 protein expression in the clones Cl 3 + CDS, Cl 6 + CDS, Cl 7 + CDS, and null + CDS. The graph shows the relative expression of Smad4 normalized to β-actin expression. (D) Cell proliferation assays were performed with the clones Cl 3 + CDS, Cl 6 + CDS, Cl 7 + CDS, and null + CDS in the presence or absence of human recombinant TGF-β1 (20nM). The cell number for the unstimulated cells was assigned the value 1, and the relative number of TGF-β1–stimulated cells was recalculated accordingly. The mean reduction in cell number (Red. in cell no.) for TGF-β1–stimulated cells for each clone was 39% for Cl 3 + CDS, 44% for Cl 6 + CDS, 37% for Cl 7 + CDS, and 42% for null + CDS (the values are based on 3 independent growth experiments).
Identification of miR-130a binding sites in the Smad4 mRNA
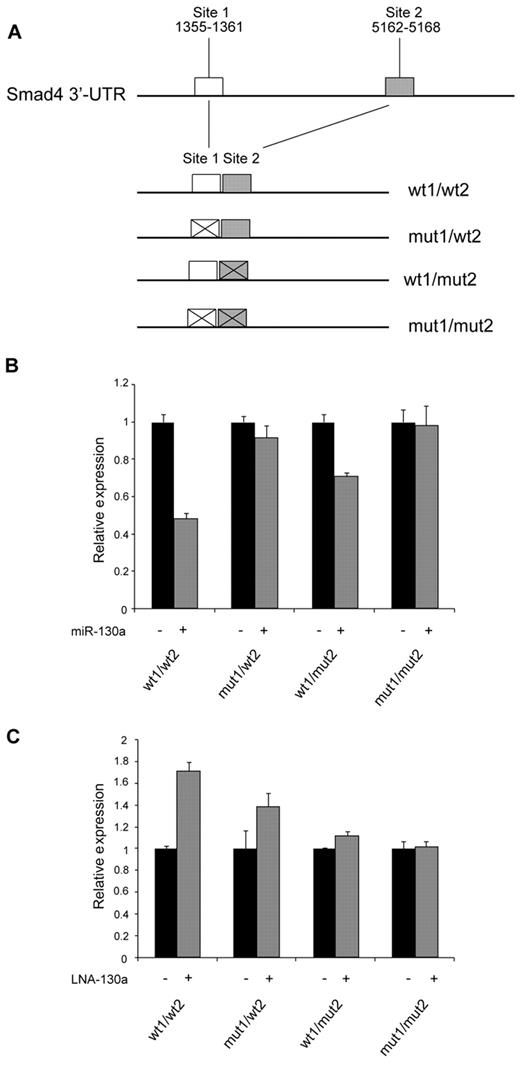
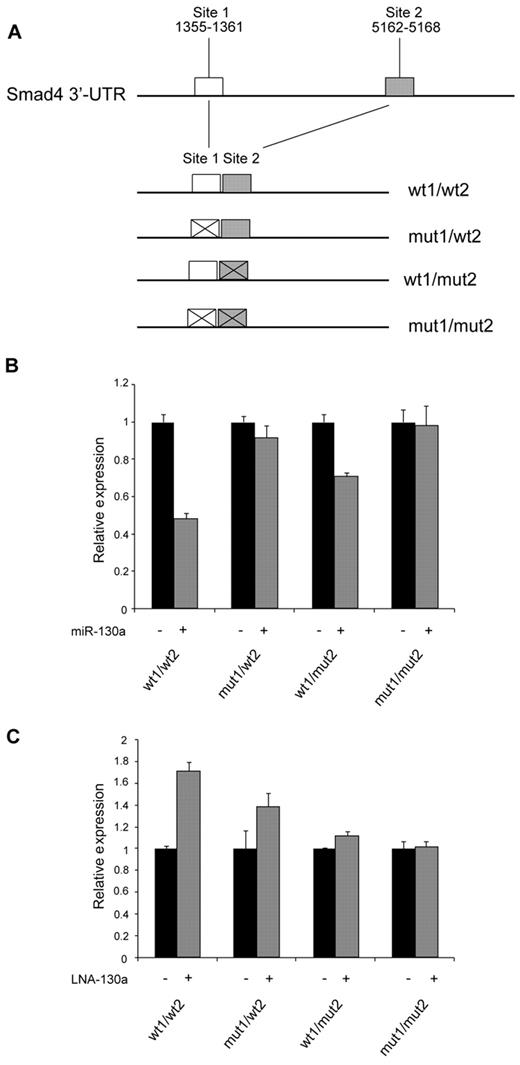
Two theoretical miR-130a target sites were identified within the 3′-UTR region of Smad4 mRNA by computational analysis (TargetScan; Figure 6A). To investigate whether these sites are involved in the regulation of Smad4 mRNA, we constructed an expression plasmid in which 2 fragments containing the predicted targets sites were cloned side-by-side downstream of the gene for luciferase in a eukaryotic expression plasmid, thus incorporating these sites in the 3′-UTR of the resulting luciferase mRNA. We also made constructs in which the proximal, the distal, or both miR-130a–binding sites were mutated. 32Dcl3 cells were cotransfected with these plasmids together with pre–miR-130a or a scrambled miRNA. Greater than 50% reduction in luciferase activity was observed from the construct containing both miR-130a–binding sites, whereas mutation of one or the other of the sites reduced the effect of miR-130a–mediated repression. No effect was seen for the construct with both sites mutated (Figure 6B). The reverse pattern was observed if the expression plasmids were cotransfected with an anti–miR-130a LNA probe that binds to miR-130a and thus reduces the free pool of endogenous miR-130a. A 70% increase in activity was observed for the construct with both miR-130a sites intact, a less pronounced effect was seen for the constructs with only one functional miR-130a binding site, and no effect was found for the construct with both miR-130a sites mutated (Figure 6C). Together, these results show that miR-130a appears to regulate Smad4 expression by binding to the 2 predicted target sites in SMAD4 3′-UTR.
Identification of miR-130a binding sites in the Smad4 mRNA. (A) Schematic drawing showing the cloning of the predicted miR-130a binding sites in the 3′-UTR of pMIR-REPORT. (B-C) 32Dcl3 cells were transfected individually with the firefly expression vector pMIR-REPORT containing 1 of the 4 different constructs (wt1/wt2, mut1/wt2, wt1/mut2, and mut1/mut2) along with a renilla luciferase vector (for normalization) and pre–miR-130a/scrambled miRNA (B) or LNA-130a/LNA-neg (C), respectively. Relative firefly luciferase activity is shown after normalizing to the renilla luminescence. Data are shown as the mean ± SD from triplicate measurements. The expression from the transfections with the controls (miR-neg and LNA-neg) was assigned the value 1, and the relative expression measured from the constructs cotransfected with miR-130a or LNA-130a was recalculated accordingly.
Identification of miR-130a binding sites in the Smad4 mRNA. (A) Schematic drawing showing the cloning of the predicted miR-130a binding sites in the 3′-UTR of pMIR-REPORT. (B-C) 32Dcl3 cells were transfected individually with the firefly expression vector pMIR-REPORT containing 1 of the 4 different constructs (wt1/wt2, mut1/wt2, wt1/mut2, and mut1/mut2) along with a renilla luciferase vector (for normalization) and pre–miR-130a/scrambled miRNA (B) or LNA-130a/LNA-neg (C), respectively. Relative firefly luciferase activity is shown after normalizing to the renilla luminescence. Data are shown as the mean ± SD from triplicate measurements. The expression from the transfections with the controls (miR-neg and LNA-neg) was assigned the value 1, and the relative expression measured from the constructs cotransfected with miR-130a or LNA-130a was recalculated accordingly.
miR-130a expression in AML
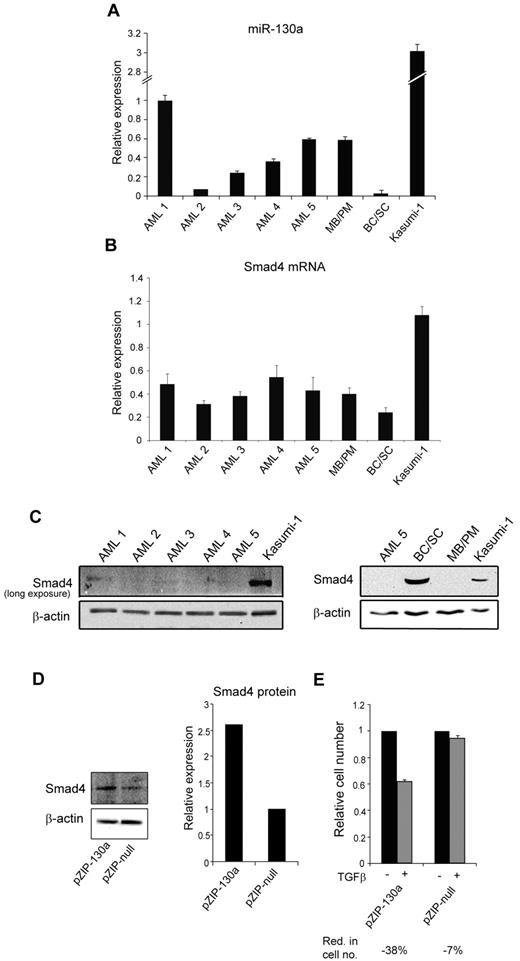
The TGF-β pathway is vital for normal granulopoiesis,29-31 and loss of transcriptional capacity of Smad4 as well as other disruptions of the TGF-β signaling pathway have been linked to development of AML.16,32 High expression of miR-130a in AML cells could contribute to keep the cells in a proliferative state. A recent screening of 52 AML samples showed that miR-130a was significantly up-regulated in ∼ 50% of t(8;21) and inv(16) AMLs.33
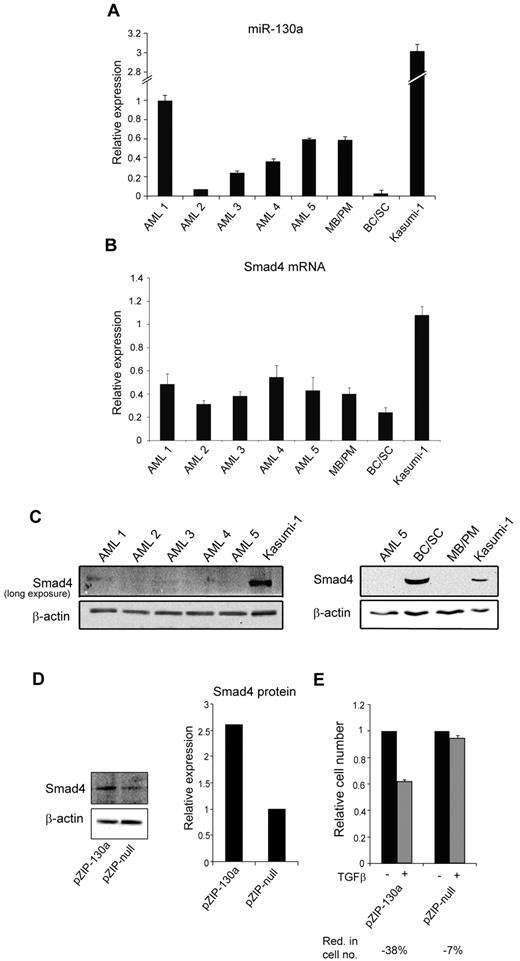
Examination of 5 t(8;21)AML samples showed a heterogeneous miR-130a expression pattern with only 2 (AML-1 and -5) having an expression level equal to or higher than that in MBs/PMs (Figure 7A). Although Smad4 mRNA levels displayed less variation among the AML samples (Figure 7B), only negligible Smad4 protein expression was detectable in these AML cells even though the Smad4 mRNA expression was higher compared with the expression in BCs/SCs (Figure 7C). Together these observations make it unlikely that miRNA-130a alone is responsible for translational silencing of Smad4 mRNA in these AML samples, but it does not rule out that miRNA-130a could play a role in some cases. We therefore examined the t(8;21)AML-derived cell line Kasumi-1. The amount of both miRNA-130a and Smad4 mRNA is higher in Kasumi-1 cells than in the AML samples and allows for a weak, but detectable, Smad4 protein expression (Figure 7C). To test whether silencing of miR-130a could affect the endogenous level of Smad4 we transfected Kasumi-1 cells with pmiRZIP-130. This caused a 2.5-fold increase of Smad4 (Figure 7D) and thereby rendered the Kasumi-1 cells responsive to TGF-β1–induced cell growth inhibition (Figure 7E). This shows that miR-130a does take part in regulating Smad4 in this AML-derived cell line.
miR-130a expression in AML t(8;21) and Kasumi-1 cells. The relative miR-130a expression in BM samples from 5 patients with AML with the t(8;21) chromosomal translocation, MB/PM and BC/SC cells from a healthy donor, and in Kasumi-1 cells was measured by real-time PCR with RNU6 as normalizer. Data are shown as the mean ± SD from triplicate measurements. (B) Relative expression of Smad4 mRNA in the same samples as in panel A after normalization to β-actin expression. Data are shown as mean ± SD from triplicate measurements. (C) Immunoblot of Smad4 protein expression in the 5 AML samples (AML 1-5) and Kasumi-1 cells. The exposure time was extended to get a signal in the AML samples. Immunoblot of AML5, BC/SC, MB/PM, and Kasumi-1 cells. β-actin was used a loading control. (D) Kasumi-1 cells were transiently transfected with pmiRZIP-130a (pZIP-130a) or pmiRZIP-null (pZIP-null), and Smad4 protein expression was determined by immunoblotting. The graph displays the relative expression of Smad4 normalized to β-actin expression. (E) Cell proliferation assays performed on Kasumi-1 cells transiently transfected with pmiRZIP-130a (pZIP-130a) or pmiRZIP-null (pZIP-null) in the presence or absence of human recombinant TGF-β1 (20nM). The graph shows the relative number of cells after 4 days when TGF-β1–stimulated cells are compared with unstimulated cells for each transfection. The mean reduction in cell number (Red. in cell no.) for TGF-β1–stimulated cells for each transfection was 38% for pZIP-130a and 7% for pZIP-null.
miR-130a expression in AML t(8;21) and Kasumi-1 cells. The relative miR-130a expression in BM samples from 5 patients with AML with the t(8;21) chromosomal translocation, MB/PM and BC/SC cells from a healthy donor, and in Kasumi-1 cells was measured by real-time PCR with RNU6 as normalizer. Data are shown as the mean ± SD from triplicate measurements. (B) Relative expression of Smad4 mRNA in the same samples as in panel A after normalization to β-actin expression. Data are shown as mean ± SD from triplicate measurements. (C) Immunoblot of Smad4 protein expression in the 5 AML samples (AML 1-5) and Kasumi-1 cells. The exposure time was extended to get a signal in the AML samples. Immunoblot of AML5, BC/SC, MB/PM, and Kasumi-1 cells. β-actin was used a loading control. (D) Kasumi-1 cells were transiently transfected with pmiRZIP-130a (pZIP-130a) or pmiRZIP-null (pZIP-null), and Smad4 protein expression was determined by immunoblotting. The graph displays the relative expression of Smad4 normalized to β-actin expression. (E) Cell proliferation assays performed on Kasumi-1 cells transiently transfected with pmiRZIP-130a (pZIP-130a) or pmiRZIP-null (pZIP-null) in the presence or absence of human recombinant TGF-β1 (20nM). The graph shows the relative number of cells after 4 days when TGF-β1–stimulated cells are compared with unstimulated cells for each transfection. The mean reduction in cell number (Red. in cell no.) for TGF-β1–stimulated cells for each transfection was 38% for pZIP-130a and 7% for pZIP-null.
Discussion
Granulopoiesis is characterized by a differential expression of transcription factors and cell cycle proteins.3,34 Dysregulation of these regulatory proteins may seriously compromise neutrophil development and function, as illustrated by the absence of neutrophil precursors in CEBPA knockout mice35 and by the functional and structural defects of neutrophils in mice36 or humans37 whereby C/EBP-ϵ is either lacking or expressed in a mutated form. Furthermore, several forms of AML develop as a result of chromosomal translocations or inactivating mutations that affect genes encoding transcriptional regulators such as Runx1, CBF-β, C/EBP-α, and HoxA9.38 Expression of many proteins is regulated not only at the transcriptional level but also posttranscriptionally by modulation of mRNA stability and by miRNAs that inhibit translation of mRNAs to their encoded proteins.20 For this reason we decided to examine if some miRNAs might also be differentially regulated during granulopoiesis and whether these miRNAs could be involved in controlling maturation of neutrophil granulocyte precursors.
We found that the amount of miR-130a varied considerably during granulopoiesis with high levels in the most immature granulocytic precursors followed by a steep decline at the transition to the myelocyte stage of differentiation. In silico analysis identified transcripts for many proteins of the TGF-β signaling pathway as theoretical targets of miR-130a. Most noticeable was the mRNA encoding Smad4 because this protein is central for cellular responses to TGF-β1 stimulation.
Despite a high level of Smad4 mRNA throughout granulopoiesis, Western blot analysis showed that Smad4 protein is virtually undetectable in the BM/PM fraction, whereas miR-130a is strongly expressed. In the more mature stages of neutrophil development, low amounts of miR-130a are accompanied by high levels of Smad4 protein. This expression pattern supports the idea that translation of Smad4 mRNA could be impaired by miR-130a. This was further corroborated by down-regulation of Smad4 protein both in epithelial cell lines (HEK293 and A549) and a myeloid cell line (32Dcl3) after transfection with miR-130a. These data are corroborated by our demonstration that the amount of Smad4 protein increases if the endogenous level of miR-130a is inactivated by an antisense probe. Recent data show that miRNAs, besides translational inhibition, in most cases (> 80%) also cause a destabilization of their target mRNAs.21 The data presented here, however, show that the level of Smad4 mRNA is unaffected by the introduction of miR-130a which indicates that miR-130a reduces the Smad4 protein level by translational silencing rather than by inducing degradation of the Smad4 mRNA.20
Two miR-130a binding sites were identified in the 3′-UTR of the Smad4 mRNA. Our data show that each site alone causes a modest response, whereas a strong effect on protein expression is observed when both sites are present. This phenomenon of synergetic translational repression is also known for other mRNAs with 2 miRNA-binding sites in their 3′-UTR.39
It is well documented that TGF-β produced locally in the BM is important for controlling proliferation of HSCs.10,30 Less is known about the role of TGF-β in controlling neutrophil development but such would be compatible with our observation that Smad4 emerges at the myelocyte stage where cell proliferation must cease for the cell to enter the terminal stages of neutrophil development. Growth factors and cytokines such as G-CSF,6 TNF-α, and IL-18 affect granulopoiesis in the BM by stimulating proliferation and the rate of terminal differentiation. Changes in the amount of TGF-β in the local environment of the BM could likewise be envisioned to influence the speed by which neutrophils progress from a proliferative state to the more mature stages of development. Karlsson et al has examined the effect of transplanting normal mice with HSCs that do not express Smad4.30 They found that the self-renewal capacity of HSCs lacking Smad4 was reduced compared with HSCs from wild-type mice but that the number Gr-1/Mac-1–positive myeloid cells was the same in both cases. However, because both Gr-1 and Mac-1 are found also on immature granulocytic precursors, it is possible that the maturity of these cells differ under the 2 conditions. It would be interesting to examine whether neutrophils originating from the mice that received a transplant of SMAD4−/− HSCs differ in maturity from those originating from mice that received a transplant with wild-type HSCs.
A sustained high expression of miR-130a in neutrophil precursors will suppress Smad4 expression and render the cells insensitive to TGF-β1–induced cell cycle repression. This would help keep the cells in a proliferative state and may thus potentially act as a leukemogenic factor. Disruption of the TGF-β signaling pathway has been associated with leukemic transformation in several cases. One example is the RUNX1–Evi-1 fusion protein generated by the t(3;21) translocation that may be seen at blast cell crisis of chronic myelogenous leukemia. RUNX1–Evi-1 interacts with Smad3 and represses its ability to form an active transcriptional complex with Smad2 and Smad4 and thus renders the cells insensitive to growth inhibition by TGF-β1.17 In a survey of 34 AML samples, 2 were found to carry a mutation of the SMAD4 gene, whereby the Smad4 protein became incapable of acting as an activator of transcription16 or caused the Smad4 protein to be unstable.18 It was shown that expression of these mutated Smad4 proteins in myeloid cell lines makes the cell less responsive to TGF-β1–mediated cell growth inhibition.16 Our data have shown various amounts of miR-130a in the 5 t(8;21)AML samples tested but quite similar levels of Smad4 mRNA. Because no Smad4 protein could be detected, an effective posttranscriptional silencing must take place in these AMLs involving more than just miR-130a–mediated transcriptional silencing. Our data from the Kasumi-1 cell line, however, indicate that miR-130a may in some cases play a role in translational silencing of the Smad4 mRNA.
A role as regulators of granulocyte proliferation has also been shown for other microRNAs. The gene encoding miR-223 is regulated by the transcription factor C/EBP-α, which stimulates transcription, and by NFI-A, that acts as a repressor of miR-223 expression. Replacement of NFI-A with C/EBP-α causes the level of miR-223 to increase during granulopoiesis, a process that is favored by a negative feedback loop in which miR-223 represses translation of the NFI-A mRNA.40 The transcription factors MEF2C and E2F1, which both promote granulocyte precursor proliferation, are also targets of miR-223. This can thus explain how an increased expression of miR-223 is able to promote terminal differentiation of the granulocyte.41 Several miRNAs have been shown to have a role in AML. Li et al have shown that miR-126/126* expression is increased in AML subgroups t(8;21) and inv(16) and that the main target is PLK2 (Polo-like kinase 2).33 It has been suggested that PLK2 functions as a tumor suppressor gene by its involvement in cell-cycle progression and DNA damage-induced checkpoints. miR-29b has also been shown to be differentially expressed in AML subgroups t(8;21) and inv(16), and a decreased expression of miR-29b indirectly increases the expression of the tyrosine kinase KIT, which regulates cell survival, proliferation, or differentiation of granulocytic cells.42,43
In conclusion, our data have shown that miR-130a is expressed at a high level in immature neutrophil precursors which results in suppression of Smad4 protein synthesis despite a high expression of the transcript encoding this protein. Overexpression of miR-130a in a granulocytic cell line resulted in down-regulation of the endogeneous level of Smad4 and rendered the cells less sensitive to TGF-β1–induced growth repression. Regulating the cellular level of miR-130a may thus control neutrophil cell growth in the BM under normal circumstances. One can speculate whether aberrations that cause a sustained high expression of miR-130a in early granulocytic precursors might be a leukemogenic factor that could contribute to development of AML.
The online version of this article contains a data supplement.
The publication costs of this article were defrayed in part by page charge payment. Therefore, and solely to indicate this fact, this article is hereby marked “advertisement” in accordance with 18 USC section 1734.
Acknowledgments
The authors thank Carl-Henrik Heldin who kindly provided the CAGA12-MLP-Luc plasmid. The technical assistance of Tessa Hornsyld is greatly appreciated.
This work was supported by grants from the Lundbeck Foundation, the Danish Cancer Society, the Novo Nordisk Foundation, the Danish Medical Research Council, and the Swedish Research Council.
Authorship
Contribution: M.H. designed the research, performed experiments, analyzed data, made figures, and wrote the paper; C.C.P. performed experiments, analyzed microarray data, and wrote the paper; C.H. and K.G. performed experiments and analyzed microarray data; M.T.L. performed experiments; M.K.A. provided the AML samples; H.J. analyzed microarray data; N.B. wrote the paper; and J.B.C. designed the research, analyzed data, and wrote the paper.
Conflict-of-interest disclosure: The authors declare no competing financial interests.
Correspondence: Jack B. Cowland, Granulocyte Research Laboratory, Rigshospitalet, Department 93.2.2 Blegdamsvej 9, DK-2100 Copenhagen, Denmark; e-mail: jack.cowland@rh.regionh.dk.

