Abstract
B-cell receptor and microenvironment-derived signals promote accumulation of chronic lymphocytic leukemia (CLL) cells through increased proliferation and/or decreased apoptosis. In this study, we investigated the regulation of BIM, a proapoptotic BCL2-related protein, which is tightly regulated by phosphorylation. Surface IgM stimulation increased phosphorylation of 2 BIM isoforms, BIMEL and BIML, in a subset of CLL samples. In contrast, in normal B cells, anti-IgM triggered selective phosphorylation of BIMEL only. In CLL, anti-IgM–induced BIM phosphorylation correlated with unmutated IGHV gene status and with progressive disease. Strikingly, it was also associated with progressive disease within the mutated IGHV gene subset. BIM phosphorylation was dependent on MEK1/2 kinase activity, and we identified BIMEL serine 69, previously linked to pro-survival responses, as the major site of phosphorylation in CLL and in Ramos cells. BIMEL/BIML phosphorylation was associated with release of the pro-survival protein MCL1. Coculture of CLL cells with HK cells, a model of the CLL microenvironment, promoted CLL cell survival and was associated with MEK1/2 activation and BIMEL phosphorylation. Hence, BIM phosphorylation appears to play a key role in apoptosis regulation in CLL cells, potentially coordinating antigen and microenvironment-derived survival signals. Antigen-mediated effects on BIM may be an important determinant of clinical behavior.
Introduction
Chronic lymphocytic leukemia (CLL) is a relatively common B-cell malignancy with a highly variable clinical course.1,2 A valuable marker for predicting disease behavior is the mutational status of the B-cell receptor (BCR) immunoglobulin variable region genes. Those with unmutated IGHV genes (U-CLL) have a relatively poor prognosis compared with patients with mutated IGHV genes (M-CLL).3,4 Expression of ZAP-70 and the cell surface activation marker CD38 is also associated with poorer clinical outcome.5
Antigen signaling plays a key role in the accumulation of CLL cells through increased cell survival and proliferation.6-8 Engagement of antigen appears to be ongoing in CLL,9-11 and differences in responses to surface IgM (sIgM) stimulation may be a key determinant of clinical behavior.7,8 For example, U-CLL is generally more open to sIgM signaling responses in vitro, whereas more M-CLL cases have reduced sIgM signal capacity, displaying a stronger “anergic” phenotype.10,12 Antigen-mediated activation of downstream signaling pathways, which lead to proliferation and survival, may contribute to accumulation of malignant cells in vivo and to disease progression. Hence, these pathways are an attractive target for therapeutic attack.7 Microenvironment signals derived from stromal cells and immunocytes also play a key role in CLL, promoting cell survival and supporting proliferation in vivo.13
One key target for survival signals in CLL cells is MCL1, a pro-survival BCL2 family protein. MCL1 is induced in cells stimulated with anti-IgM,14-16 and its expression is associated with poor clinical outcome.17,18 MCL1 also plays an important role in microenvironment-derived signaling19,20 and is essential for survival of CLL cells cocultured with HK cells, a follicular dendritic cell line.21 A further potential player is the proapoptotic BCL2 family protein BIM, a preferred dimerization partner of MCL1. BIM is expressed as 3 isoforms (BIMEL, BIML, and BIMS; supplemental Figure 1, available on the Blood Web site; see the Supplemental Materials link at the top of the online article) and is a critical regulator of apoptosis in normal and malignant B cells.22 BIM functions as a tumor suppressor in B-cell malignancies23-25 and is a key determinant of BCR-induced apoptosis in normal B cells, where it is required for the deletion of autoreactive cells in vivo.23,26
BIM function is positively and negatively regulated by transcription, phosphorylation, and degradation.27 The best understood pathway involves ERK1/2-mediated phosphorylation of BIMEL at S69, which has been shown to promote cell survival.28,29 In murine B cells, this occurred after stimulation via IgM.30 S69 phosphorylation triggers release of survival molecules, such as MCL1, from sequestration by BIMEL,31 and also enhances proteosomal degradation of BIMEL,29,31,32 although it is not clear whether degradation is an inevitable consequence of phosphorylation. In contrast to S69, inducible phosphorylation at other sites enhances the proapoptotic function of BIM. For example, phosphorylation at T56 in BIML (equivalent to T116 in BIMEL) promotes apoptosis via reduced binding to cytoskeleton components and increased sequestration of BCL2.33-35
Given the key role of BCR signaling in CLL and the known involvement of BIM downstream of the BCR in other systems, we have investigated regulation of BIM in CLL. Previous studies have shown that CLL cells express variable levels of BIM isoforms.16,36-38 Moreover, BIM has been shown to be functionally important in apoptosis control in CLL cells. In particular, studies using BH3-mimetic peptides have demonstrated that BIM triggers the release of cytochrome c from mitochondria unless it is effectively sequestered by high levels of BCL2, a feature of CLL cells.36 Two previous studies have investigated BIM regulation in CLL cells; and although they have demonstrated modulation of the level and/or phosphorylation of BIMEL by anti-IgM,37,38 the clinical significance and mechanisms of BIM modulation remain unclear.
In this study, we demonstrate that BIM isoforms undergo phosphorylation in CLL cells stimulated with anti-IgM or cocultured with HK cells, a model for microenvironment support. BIM phosphorylation was dependent on MEK1/2 (the upstream activating kinase for ERK1/2) and was associated with release of MCL1. Importantly, the extent of anti-IgM–induced BIM phosphorylation was strongly associated with IGHV mutation status and with disease progression, even within M-CLL, suggesting that this pathway may be an important determinant of disease behavior.
Methods
CLL samples and normal B cells
A summary of the clinical background of the CLL samples used is provided in Table 1. The study was performed after approval from the Southampton and Southwest Hampshire Research Ethics Committee, and informed consent was provided in accordance with the Declaration of Helsinki. Blood was obtained from CLL patients who attended outpatient clinics at the University Hospitals of Leicester, Royal Wolverhampton Hospitals, Southampton University Hospitals Trust, Royal Berkshire NHS Foundation Trust, and the Queen Alexandra Hospital, Portsmouth (all United Kingdom). The majority of samples were obtained at diagnosis/before therapy. Where treatment had taken place, this was at least 3 months before sample collection.
Blood samples were processed as previously described.10 After cryopreservation, cells were allowed to recover by incubation for 1 hour at 37°C in RPMI 1640 (PAA Laboratories) supplemented with 10% (volume/volume) FBS (PAA Laboratories), 1mM pyruvate, 2mM glutamine, and nonessential amino acids (all from Lonza). Cell viability determined by trypan blue exclusion was more than or equal to 90%. The proportion of CD5+/CD19+ CLL cells was more than 90% in the majority of samples (range, 86%-99%). Normal B cells were isolated from peripheral blood of healthy donors using the B cell Isolation Kit II (Miltenyi Biotec) according to the manufacturer's protocol.
IGHV mutation status, expression of cell surface CD5, CD19, CD38, and sIgM, and intracellular ZAP-70 were determined as previously described.10,12 IgM signaling capacity was determined by measuring the percentage of cells fluxing calcium after stimulation with goat F(ab′)2 anti-IgM as described elsewhere (Table 1).10 Samples with more than 5% of responding cells were classed as positive intracellular Ca2+ signalers.10 Disease was considered “progressive” if the patient went on to receive treatment at any point after diagnosis.
Ramos cells were obtained from the European Collection of Cell Cultures. The HK cell line was a kind gift from Dr Yong Sung Choi (Laboratory of Cellular Immunology, New Orleans, LA). Both cell lines were cultured in supplemented RPMI 1640. For coculture experiments, cells were plated at a CLL:HK cell ratio of 20:1.
Cell treatments
For sIgM stimulation, CLL cells were cultured at 1 × 10⁷/mL and incubated with soluble 20 μg/mL goat F(ab′)2 anti–human IgM (Southern Biotechnology) as previously described.12 In experiments using chemical inhibitors, cells were pretreated with U0126 (10μM; Sigma-Aldrich), PD0325901 (100nM; Merck Chemicals), or MG-132 (1μM; Merck Chemicals) for 1 hour before stimulation with anti-IgM.
Immunoblot and PhosFlow analysis
For immunoblotting experiments, cells were lysed directly in SDS sample loading buffer (Cell Signaling Technology) containing DTT, protease inhibitors, and phosphatase inhibitors (both from Sigma-Aldrich). After sonication, lysates were resolved on 10% to 20% Tris-HCl gradient gels (Bio-Rad), and immunoblotting was performed with the following antibodies: anti-BIM (2819), anti-S69 phospho-BIM (4581), anti-ERK1/2 (9102), anti-T202/Y204 phospho-ERK1/2 (9101), anti-HA (C29F4 all from Cell Signaling Technology), anti-ubiquitin (P4D1), anti-MCL1 (S-19, both from Santa Cruz Biotechnology), anti-MCL1 (clone 22; BD Biosciences) and anti–β-actin (2066; Sigma-Aldrich). Secondary HRP-conjugated antibodies were from GE Healthcare. Densitometry analysis of images was performed using Quantity One Version 4.6.9 software (Bio-Rad). For quantitation of BIM phosphorylation, the faster migrating (nonphosphorylated) and slower migrating (phosphorylated) isoforms were quantified separately. For each BIM isoform, the proportion of phosphorylation was determined by calculating the amount of phosphorylated BIM as a percentage of total BIM. Maximal levels of BIM phosphorylation after stimulation with anti-IgM were used for further comparisons.
Induction of ERK1/2 phosphorylation was also determined by intracellular flow cytometry, using anti-T202/Y204 phospho-ERK1/2 conjugated to AlexaFluor-488 (BD Biosciences), as described elsewhere.39
Immunoprecipitations
Cell pellets of 5 × 10⁶ Ramos cells were resuspended in 500 μL NP40 lysis buffer (1% [volume/volume] NP-40, 50mM Tris-HCl pH 8.0, 150mM NaCl, 2mM EDTA, protease inhibitors, and phosphatase inhibitors), lysed on ice for 15 minutes, and clarified by centrifugation. The lysate was rotated overnight at 4°C with 2 μg rat monoclonal anti-BIM (14A8; Millipore) or isotype control rat IgG2a (a kind gift of Professor M. J. Glennie, Southampton, United Kingdom). Alternatively, the lysate was incubated with 2 μg anti-MCL1 raised in rabbit (S-19; Santa Cruz Biotechnology) or with 2 μg anti-MCL1 raised in mouse (clone 22; BD Biosciences) and the appropriate isotype controls; polyclonal rabbit IgG (Abcam) or mouse IgG1 (BD Biosciences). Protein G-Sepharose beads (GE Healthcare) were then added; and after 6 hours, the immune complexes were collected by centrifugation. The beads were washed 4 times in NP-40 lysis buffer, and bound proteins eluted in 50 μL of elution buffer (200mM glycine, pH 2.8). Densitometry analysis allowed quantitation of coprecipitated proteins. For comparison between experiments, levels were set to 1.0 in unstimulated cells, and any effects of IgM stimulation are shown as proportional to this amount.
Plasmids and transfections
pCAN-HA vectors containing HA-tagged wild-type or mutant rat BIMEL have been described.28 For transfection, 8 × 10⁶ Ramos cells were resuspended in 250 μL Optimem (Invitrogen) and electroporated at 250 V, 1050 μF, 900c in the presence of 15 μg of plasmid DNA. Equibio's Easyject Plus D2000 was used for electroporations. Cells were incubated at 1 × 10⁶/mL for 24 hours and then recounted before anti-IgM stimulation.
Measurement of apoptosis
Cells were permeabilized in ice-cold 70% (volume/volume) ethanol and, after overnight storage at 4°C, washed and resuspended in phosphate-citrate buffer (0.2M Na2HPO4, 0.1M citric acid). After 10 minutes of incubation with 100 μg/mL RNase (QIAGEN), propidium iodide (PI; BD Biosciences) was added at 50 μg/mL. Cells were analyzed on a FACSCalibur flow cytometer (BD Biosciences). Alternatively, nonpermeabilized cells were resuspended in 300 μL annexin V binding buffer (BD Biosciences) containing 1.25 μL annexin V–FITC (Protein Core Facility, University of Southampton) and 0.05 μg PI. After 15 minutes of incubation in the dark, cells were analyzed on a FACSCalibur flow cytometer.
Statistics
Statistical analyses were performed using GraphPad Prism Version 4.03 software. Mann-Whitney and paired t tests were 2-tailed with 95% confidence intervals.
Results
Expression of BIM isoforms in CLL
We analyzed the expression of BIM in CLL using immunoblotting. Consistent with previous publications,16,36-38 CLL cells expressed readily detectable levels of the 2 major BIM isoforms, BIML and BIMEL (Figure 1A). Expression of the smallest isoform (BIMS) was very low and generally only detected after long exposures of immunoblots. Using RT-PCR analysis, we confirmed that the isoforms expressed in CLL cells corresponded to the 3 major BIM splice variants (BIMEL, BIML, and BIMS), and there was no evidence for expression of substantial levels of other, noncanonical splice variants (data not shown).
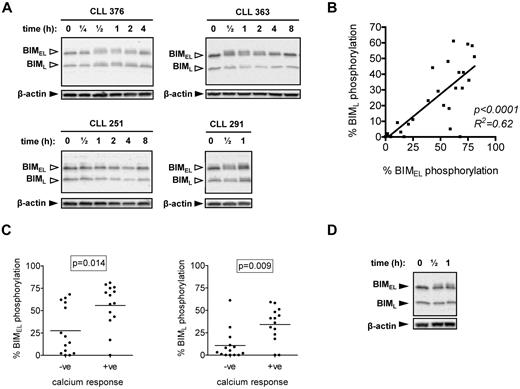
Induction of BIM phosphorylation after stimulation with anti-IgM. (A) CLL samples were treated with 20 μg/mL anti-IgM for the indicated times, and expression of BIM and β-actin was analyzed by immunoblotting. BIMEL and BIML isoforms are indicated by closed arrowheads. Open arrowheads indicate phosphorylated forms. Data are representative of a total of 28 samples analyzed and illustrate the various patterns of BIMEL/BIML phosphorylation observed in this cohort. For example, CLL 376 shows > 5% increased phosphorylation of both BIMEL and BIML, whereas CLL 363 shows increased > 5% phosphorylation of BIMEL only. CLL 251 shows no response and CLL 291 has > 5% basal phosphorylation of BimEL and BimL, which increased after stimulation. (B) Correlation between maximum anti-IgM–induced BIMEL phosphorylation and BIML phosphorylation. Results of linear regression are shown. (C) Correlation between maximum anti-IgM–induced BIMEL/BIML phosphorylation and intracellular Ca2+ responses. (D) Normal B cells were treated with anti-IgM for half an hour or 1 hour, and expression of BIM and β-actin was analyzed by immunoblotting. Results are representative of 3 different B-cell preparations.
Induction of BIM phosphorylation after stimulation with anti-IgM. (A) CLL samples were treated with 20 μg/mL anti-IgM for the indicated times, and expression of BIM and β-actin was analyzed by immunoblotting. BIMEL and BIML isoforms are indicated by closed arrowheads. Open arrowheads indicate phosphorylated forms. Data are representative of a total of 28 samples analyzed and illustrate the various patterns of BIMEL/BIML phosphorylation observed in this cohort. For example, CLL 376 shows > 5% increased phosphorylation of both BIMEL and BIML, whereas CLL 363 shows increased > 5% phosphorylation of BIMEL only. CLL 251 shows no response and CLL 291 has > 5% basal phosphorylation of BimEL and BimL, which increased after stimulation. (B) Correlation between maximum anti-IgM–induced BIMEL phosphorylation and BIML phosphorylation. Results of linear regression are shown. (C) Correlation between maximum anti-IgM–induced BIMEL/BIML phosphorylation and intracellular Ca2+ responses. (D) Normal B cells were treated with anti-IgM for half an hour or 1 hour, and expression of BIM and β-actin was analyzed by immunoblotting. Results are representative of 3 different B-cell preparations.
BIM phosphorylation and sIgM signaling
We analyzed basal and sIgM-induced BIM phosphorylation in a cohort of 28 CLL samples comprising 11 U-CLL and 17 M-CLL, of which 14 were anti-IgM signaling responsive (intracellular Ca2+) and 14 were nonresponsive (Table 1). Consistent with previous signaling studies,10 the percentage of cells fluxing intracellular Ca2+ after stimulation with anti-IgM correlated positively with the presence of unmutated IGHV genes (P = .024), demonstrating that this cohort is representative of those previously studied (data not shown).
Immunoblot analysis revealed variable levels of basal and induced phosphorylation of BIMEL and/or BIML, detected by accumulation of slower migrating isoforms (Figure 1A). BIM phosphorylation was quantified using digital image analysis. Repeat analyses of 6 CLL samples in up to 4 independent experiments demonstrated that quantitation of BIM phosphorylation was highly reproducible (SD values for repeat measurements ranged from 0.2% to 5.8%). We therefore selected a cut-off of more than 5% to categorize samples as positive for basal (ie, > 5% BIMEL/BIML phosphorylation in unstimulated cells) or induced BIMEL/L phosphorylation (ie, > 5% maximal increase in BIM phosphorylation in stimulated cells). We also compared anti-IgM–induced BIM phosphorylation in fresh and cryopreserved material from 3 samples, which showed a range of BIMEL responses (7.1%-45% BIMEL phosphorylation) to ensure that responses were not affected by cryopreservation. Overall, the results were similar for fresh and cryopreserved cells, and the variation in the percentage induced phosphorylation of BIMEL and BIML was less than or equal to 4%.
Basal BIMEL and BIML phosphorylation was detected in several samples but only exceeded the 5% cut-off in a small proportion (5 of 28; 18%; eg, CLL 291 in Figure 1A). In most cases, anti-IgM stimulation was associated with increased phosphorylation of BIMEL and/or BIML (Figure 1A for representative examples; and Table 1). Increased phosphorylation was rapid (within 30 minutes) but transient and typically lost 2 to 4 hours after stimulation (Figure 1A). Using the more than 5% cut-off, increased BIMEL/BIML phosphorylation was detected in 22 of 28 samples (79%) after stimulation with anti-IgM. In general, changes in BIMEL and BIML were highly correlated (Figure 1B), but a small number of samples (3 of 28) showed selective phosphorylation of BIMEL. In the samples with constitutive BIMEL/BIML phosphorylation, anti-IgM stimulation caused a further increase in phosphorylation. Overall, there was a close correlation between intracellular Ca2+ and BIM phosphorylation responses (P = .014 and P = .009 for BIMEL and BIML, respectively; Figure 1C), although there appeared to be a subset of intracellular Ca2+ nonresponsive samples that did show substantial BIM phosphorylation (especially for BIMEL).
We also investigated BIM modulation in polyclonal B cells from blood of healthy donors. In contrast to CLL cells, anti-IgM induced selective phosphorylation of BIMEL with no evidence of phosphorylation of BIML (n = 3; Figure 1D).
Correlations between anti-IgM–induced BIM phosphorylation and clinical features of CLL
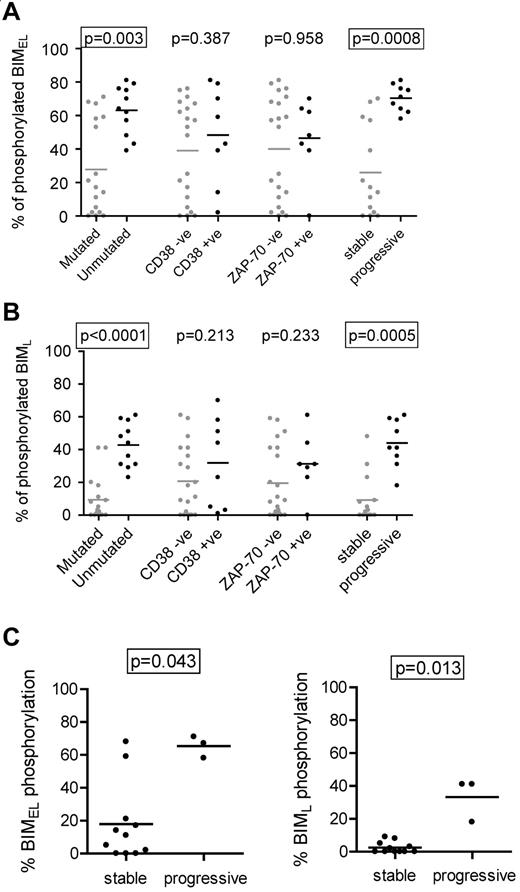
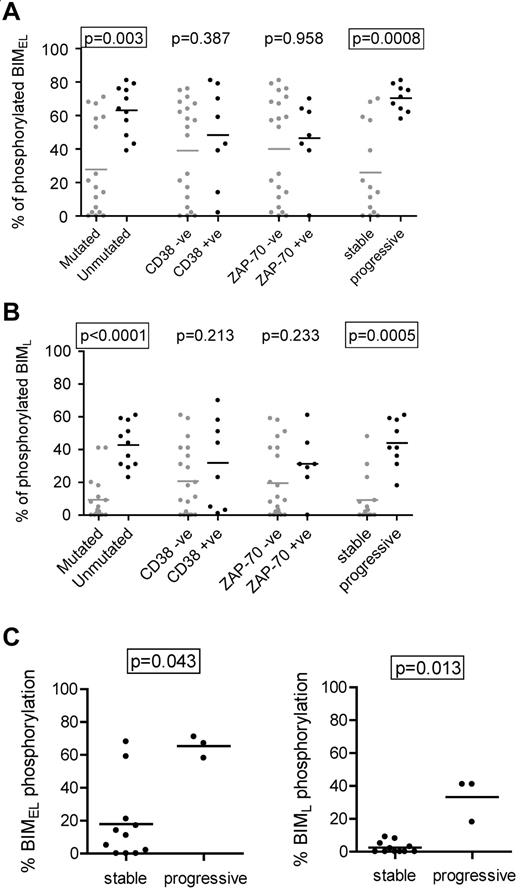
We next compared induction of BIMEL/BIML phosphorylation with the clinical features of CLL (Figure 2A-B). The results showed a strong correlation between high levels of phosphorylation and unmutated IGHV genes (P = .003 and P < .0001 for BIMEL and BIML, respectively). The levels of BIMEL/BIML phosphorylation were higher in CD38+ or ZAP-70+ cases, but this did not reach statistical significance. There was a striking correlation between BIM phosphorylation and clinical behavior. Using requirement for treatment at any time after diagnosis as a surrogate marker of progressive disease, there was a very strong correlation between higher levels of induced BIMEL phosphorylation and progressive disease (P = .0008). The same was true for BIML (P = .0005). The strong correlations remained if the stage A cases were considered alone (ie, one stage C and 2 stage B samples eliminated; P = .0009 and P = .0012 for BIMEL and BIML, respectively; data not shown).
Correlations with anti-IgM–induced BIM phosphorylation in CLL cells. Correlations between maximum IgM-induced phosphorylation of (A) BIMEL or (B) BIML and prognostic markers and stable/progressive disease. (C) Correlations in the M-CLL subset, between maximum anti-IgM–induced phosphorylation of BIMEL and BIML and stable/progressive disease. Graphs all show individual data points as well as means (horizontal line). Statistically significant differences between groups according to the Mann-Whitney statistical test are boxed (P < .05).
Correlations with anti-IgM–induced BIM phosphorylation in CLL cells. Correlations between maximum IgM-induced phosphorylation of (A) BIMEL or (B) BIML and prognostic markers and stable/progressive disease. (C) Correlations in the M-CLL subset, between maximum anti-IgM–induced phosphorylation of BIMEL and BIML and stable/progressive disease. Graphs all show individual data points as well as means (horizontal line). Statistically significant differences between groups according to the Mann-Whitney statistical test are boxed (P < .05).
All cases of U-CLL showed increased anti-IgM–induced BIM phosphorylation (Figure 2A-B). In contrast, M-CLL fell into 2 relatively discrete subsets, particularly for BIMEL, with 6 of 17 cases having a substantial response (> 50% phosphorylation) and 11 of 17 having much lower responses (< 25%). Interestingly, this was associated with progressive disease. Within the M-CLL subset, statistically significant correlations were found between BIMEL/BIML phosphorylation and progressive disease (P = .043 and P = .013, for BIMEL and BIML, respectively; Figure 2C).
Thus, higher levels of anti-IgM–induced BIM phosphorylation are a feature of U-CLL and are associated with progressive disease. In addition, the minor proportion of M-CLL cases with progressive disease appear to correlate with higher levels of sIgM-induced BIM phosphorylation.
ERK1/2 activation and anti-IgM–induced BIM phosphorylation
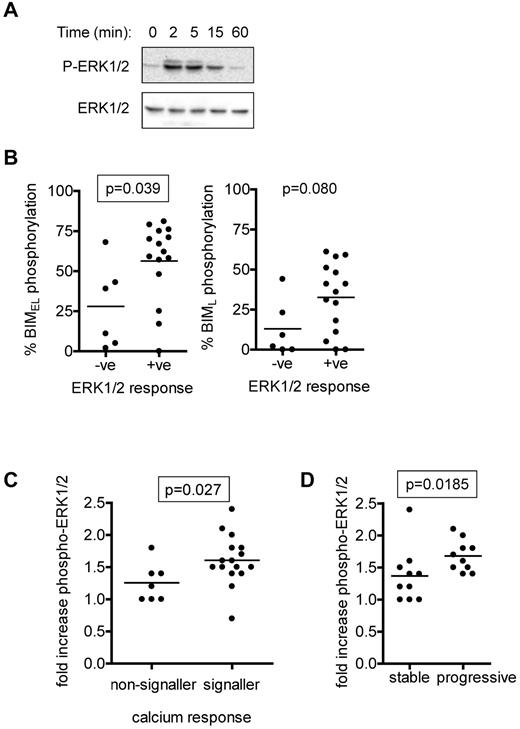
ERK1/2 is activated downstream of sIgM in normal and CLL B cells and is a key upstream regulatory kinase for BIMEL.15,28,40 We therefore analyzed IgM-induced phosphorylation of ERK1/2 in CLL cases and compared these responses with BIM phosphorylation. Semiquantitative immunoblot analysis demonstrated an increase in phosphorylation of ERK1/2 at T202/Y204 within 2 to 5 minutes, which then declined at later time points (Figure 3A). Intracellular flow cytometry was used to quantify ERK1/2 as described previously (Table 1).39 ERK1/2 phosphorylation increased rapidly in the majority of CLL samples after stimulation with anti-IgM. Consistent with previous results in CLL cells,15 we rarely detected anti-IgM induced activation of JNK1/2, a known BIM kinase33 , and where present, it was extremely weak (immunoblot analysis; data not shown).
Analysis of anti-IgM–induced ERK1/2 phosphorylation. (A) Immunoblot analysis of ERK1/2 phosphorylation in a representative CLL sample stimulated with anti-IgM (n = 12). (B) Correlations between maximum anti-IgM–induced phosphorylation of BIMEL and BIML and phospho-ERK1/2 signaling responses as measured by flow cytometry. A 1.2-fold cutoff (compared with unstimulated cells) was used to assign cases P-ERK1/2–negative or –positive. (C) Correlation between fold increase in ERK1/2 phosphorylation (measured by flow cytometry) and intracellular Ca2+ responses. (D) Correlation between fold increase in ERK1/2 phosphorylation (measured by flow cytometry) and stable/progressive disease. Graphs show individual data points as well as means (horizontal line) and the statistical significance of any differences (Mann-Whitney test). Differences that reached statistical significance (P < .05) are boxed.
Analysis of anti-IgM–induced ERK1/2 phosphorylation. (A) Immunoblot analysis of ERK1/2 phosphorylation in a representative CLL sample stimulated with anti-IgM (n = 12). (B) Correlations between maximum anti-IgM–induced phosphorylation of BIMEL and BIML and phospho-ERK1/2 signaling responses as measured by flow cytometry. A 1.2-fold cutoff (compared with unstimulated cells) was used to assign cases P-ERK1/2–negative or –positive. (C) Correlation between fold increase in ERK1/2 phosphorylation (measured by flow cytometry) and intracellular Ca2+ responses. (D) Correlation between fold increase in ERK1/2 phosphorylation (measured by flow cytometry) and stable/progressive disease. Graphs show individual data points as well as means (horizontal line) and the statistical significance of any differences (Mann-Whitney test). Differences that reached statistical significance (P < .05) are boxed.
Using an arbitrary cut-off value of more than 1.2-fold compared to unstimulated cells, ERK1/2 responses were detected in 15 of 21 (71%) samples analyzed by intracellular flow cytometry. Phospho-ERK1/2 signaling capacity was positively associated with BIMEL phosphorylation (P = .039; Figure 3B). There was a trend toward increased BIML phosphorylation and phospho-ERK1/2 responses, but this failed to reach significance (P = .080). The extent of ERK1/2 phosphorylation correlated with intracellular Ca2+ responses (P = .027; Figure 3C). Similar to BIM phosphorylation, phospho-ERK1/2 responses correlated positively with progressive disease (P = .0185; Figure 3D).
MEK1/2-dependent sIgM-induced phosphorylation of BIMEL at S69
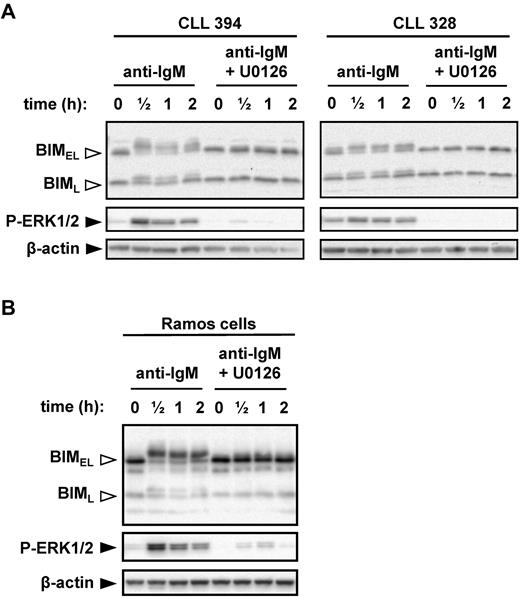
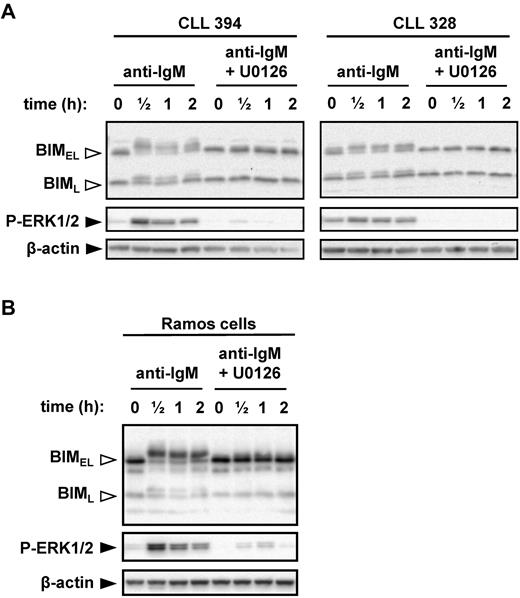
Given the positive correlations between anti-IgM–induced ERK1/2 phosphorylation, BIM phosphorylation, and progressive disease, we directly investigated the role of MEK1/2 in anti-IgM–induced BIM phosphorylation. MEK1/2 directly activates ERK1/2. CLL cells were pretreated with the MEK1/2 inhibitor U0126 before stimulation with anti-IgM. U0126 completely abrogated the increase in BIMEL phosphorylation induced by anti-IgM (Figure 4A). Surprisingly, U0126 also prevented induction of BIML phosphorylation, even though this isoform lacks the ERK-docking domain found within BIMEL (supplemental Figure 1). Immunoblot analysis of phospho-ERK1/2 confirmed that U0126 effectively inhibited MEK1/2 activity in CLL cells.
MEK1/2-dependent induction of BIM phosphorylation after stimulation with anti-IgM. (A) CLL samples and (B) Ramos cells were cultured in the presence or absence of U0126 (10μM) for 1 hour before stimulation with anti-IgM. Expression of BIM, phospho-ERK1/2, and β-actin was analyzed by immunoblotting. Open arrowheads indicate phosphorylated BIM forms. Data are representative of a total of 6 CLL samples and 3 independent Ramos cell experiments.
MEK1/2-dependent induction of BIM phosphorylation after stimulation with anti-IgM. (A) CLL samples and (B) Ramos cells were cultured in the presence or absence of U0126 (10μM) for 1 hour before stimulation with anti-IgM. Expression of BIM, phospho-ERK1/2, and β-actin was analyzed by immunoblotting. Open arrowheads indicate phosphorylated BIM forms. Data are representative of a total of 6 CLL samples and 3 independent Ramos cell experiments.
We selected Ramos cells as a transfectable cell line model to probe mechanisms and responses to BIM phosphorylation. Previous studies have used Ramos cells to study BIM phosphorylation.29 To validate Ramos cells as an appropriate model, we first investigated their response to anti-IgM. Similar to CLL cells, engagement of IgM induced rapid phosphorylation of ERK1/2, BIMEL, and BIML, and inhibition of MEK1/2 ablated phosphorylation of both BIM isoforms (Figure 4B).
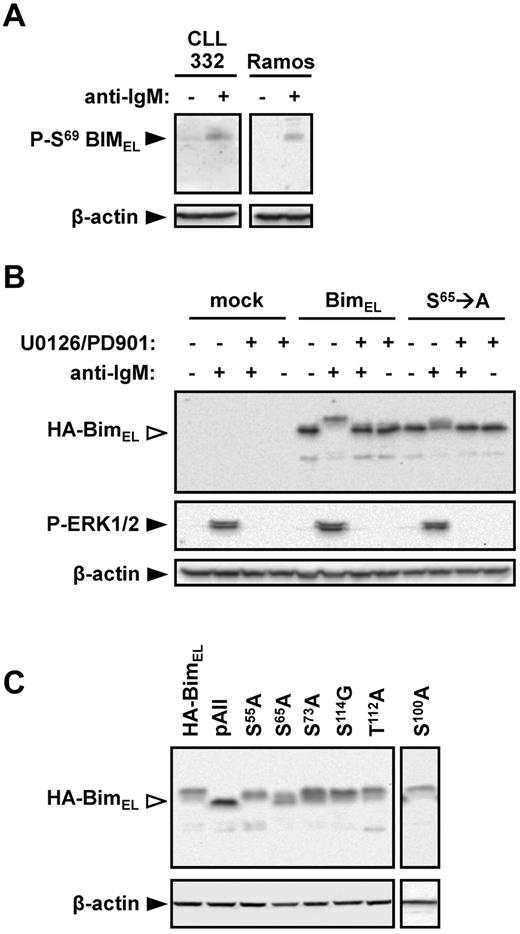
An antibody specific for S69-phosphorylated BIM was used to determine whether this site was undergoing phosphorylation in anti-IgM–treated cells. Stimulation of Ramos cells with anti-IgM clearly increased the levels of S69-phosphorylated BIMEL (Figure 5A). A similar response was observed in CLL cells from case CLL332.
Identification of BIMEL phosphorylation sites in CLL and Ramos cells. (A) Ramos and CLL 332 cells were treated with anti-IgM for 30 minutes. Expression of S69-phosphorylated BIM and β-actin was analyzed by immunoblotting. (B) Ramos cells were transfected with wild-type rat HA-tagged BIMEL or S65 → A mutant rat HA-BIMEL expression plasmids, or were mock transfected as a control. After 24 hours, cells were treated with anti-IgM in the presence or absence of U0126 and PD0325901. Expression of HA-tagged BIM, phospho-ERK1/2, and β-actin was analyzed 30 minutes after IgM stimulation by immunoblotting. Open arrowheads indicate phosphorylated BIM. Data are representative of 3 independent experiments. (C) Ramos cells were transfected with wild-type rat HA-BIMEL or mutant rat HA-BIMEL expression plasmids and 24 hours later treated with anti-IgM. After 30 minutes, expression of HA-tagged BIM and β-actin was analyzed by immunoblotting. Open arrowheads indicate phosphorylated BIM. Data are representative of 3 independent experiments. pAII indicates rat HA-BIMEL with combined mutations at amino-acid residues 55, 65, 73, 100, 112, and 114.
Identification of BIMEL phosphorylation sites in CLL and Ramos cells. (A) Ramos and CLL 332 cells were treated with anti-IgM for 30 minutes. Expression of S69-phosphorylated BIM and β-actin was analyzed by immunoblotting. (B) Ramos cells were transfected with wild-type rat HA-tagged BIMEL or S65 → A mutant rat HA-BIMEL expression plasmids, or were mock transfected as a control. After 24 hours, cells were treated with anti-IgM in the presence or absence of U0126 and PD0325901. Expression of HA-tagged BIM, phospho-ERK1/2, and β-actin was analyzed 30 minutes after IgM stimulation by immunoblotting. Open arrowheads indicate phosphorylated BIM. Data are representative of 3 independent experiments. (C) Ramos cells were transfected with wild-type rat HA-BIMEL or mutant rat HA-BIMEL expression plasmids and 24 hours later treated with anti-IgM. After 30 minutes, expression of HA-tagged BIM and β-actin was analyzed by immunoblotting. Open arrowheads indicate phosphorylated BIM. Data are representative of 3 independent experiments. pAII indicates rat HA-BIMEL with combined mutations at amino-acid residues 55, 65, 73, 100, 112, and 114.
To further investigate the role of S69 in BIMEL phosphorylation, Ramos cells were transfected with expression plasmids encoding wild-type and mutant (S65 → A) rat HA-tagged BIMEL proteins. Rat BIM expression plasmids were used because these have been used in previous BIM phosphorylation studies.28 Rat S65 is equivalent to human S69. In cells transfected with wild-type HA-BIMEL, anti-IgM induced high levels of phosphorylation with 78% ± 8% (mean ± SD of 3 experiments) of the detected HA-BIMEL protein present as slower migrating forms (Figure 5B). In contrast, anti-IgM stimulation of cells transfected with the S65 → A mutant expression construct resulted in significantly reduced HA-BIMEL phosphorylation (26% ± 6%, mean ± SD of 3 experiments). Anti-IgM induced phosphorylation of either protein was completely blocked by the MEK1/2 inhibitors U0126 and PD035901 (Figure 5B). (PD035901 was used in combination with U0126 to ensure complete inhibition of MEK1/2 activity in Ramos cells.) The presence of phosphorylated HA-BIMEL in the S65 → A mutant demonstrates that BIMEL is phosphorylated on additional sites to S65, and the inhibitor data show that all of these phosphorylations are dependent on MEK1/2.
As mutation of S65 failed to ablate BIMEL phosphorylation, we extended the analysis to other potential phosphorylation sites. Combined mutation of S55 → A, S65 → A, S73 → A, S100 → A, T112 → A, and S114 → G (rat amino acid numbering) completely ablated BIMEL phosphorylation (Figure 5C). Mutation of S73 → A or S100 → A alone caused a modest (16% ± 5% and 9% ± 2%, respectively) decrease in BIMEL phosphorylation relative to wild-type (mean ± SD, n = 3; Figure 5C). Mutation of S55 → A had no effect on BIMEL phosphorylation. Mutation of other individual phospho-acceptor sites gave variable results, which did not provide evidence for an important role.
In summary, BIMEL S69 appears to be a major target for MEK1/2-dependent phosphorylation downstream of sIgM, although other sites are probably involved.
Anti-IgM–induced BIM phosphorylation is associated with reduced MCL1 binding but not with degradation
Consequences of BIMEL S69 phosphorylation include reduced binding to pro-survival molecules and BIMEL degradation.27 However, we did not observe any substantial changes in BIMEL expression in CLL cells after stimulation with anti-IgM for up to 8 hours, a time point by which BIM phosphorylation is typically reversed (Figure 1A). Longer time course experiments confirmed that, consistent with the transient nature of BIMEL phosphorylation in CLL cells, BIMEL expression did not decrease after sIgM stimulation, even after incubation times up to 40 hours (supplemental Figure 2). Moreover, cotreatment of cells with the proteasome inhibitor MG-132 also did not increase BIMEL expression (supplemental Figure 2). This suggests BIM phosphorylation is not linked to substantial degradation in anti-IgM–stimulated CLL cells under these conditions.
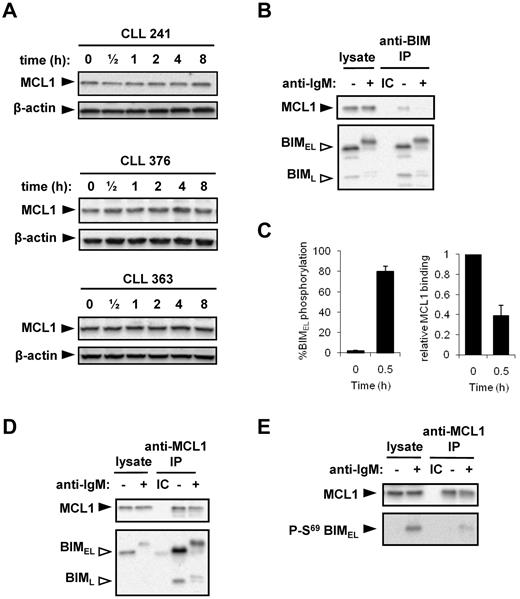
MCL1 is a preferred binding partner for BIM. Similar to a previous study,15 analysis of MCL1 in primary CLL samples (Figure 6A) and Ramos cells (Figure 6B; and data not shown) demonstrated that sIgM stimulation with soluble anti-IgM did not trigger significant changes in MCL1 expression. Given that BIM phosphorylation is known to influence binding to prosurvival BCL2-family proteins, we used Ramos cells to analyze the effect of IgM-induced BIM phosphorylation on the association between BIM and MCL1. We focused on MCL1 because the molecular events controlling this interaction are relatively well characterized.31 MCL1 was detected in BIM immunoprecipitates, confirming that these 2 proteins interact in unstimulated cells (Figure 6B). After 30 minutes of stimulation with anti-IgM, BIMEL phosphorylation substantially increased to 80% ± 5% (n = 6, mean ± SD; Figure 6C). Concurrent with this increase in BIM phosphorylation, the relative level of MCL-1 coprecipitated by BIM was reduced from 1.0 in unstimulated cells to 0.39 ± 0.10 (mean ± SD, n = 6; Figure 6C, representative example in Figure 6B). This demonstrates that anti-IgM–induced BIM phosphorylation is associated with reduced BIM/MCL1 binding.
BIM phosphorylation and binding to MCL1. (A) CLL samples were treated with 20 μg/mL anti-IgM for the indicated times, and expression of MCL1 and β-actin was analyzed by immunoblotting. Figure shows results obtained with 3 CLL samples and is representative of a total of 6 samples. (B) Ramos cells were incubated in the presence or absence of anti-IgM for 30 minutes. Lysates were prepared and immunoprecipitations (IP) performed using an anti-BIM antibody or an isotype control (IC). The immunoprecipitates and a portion of the lysates were analyzed by immunoblotting using antibodies specific for MCL1 or BIM, as indicated. Open arrowheads indicate phosphorylated BIM isoforms. (C) Quantitation of BIMEL phosphorylation and the proportion of MCL1 associated with BIM in Ramos cells treated with anti-IgM for 30 minutes. The amount of MCL1 bound to BIM in unstimulated cells was set to 1.0. Data are derived from 6 independent experiments (mean ± SD). (D) Ramos cells were incubated for 30 minutes with or without IgM stimulation. The IP was performed using rabbit anti-MCL or the appropriate IC, and the precipitates/cell lysates were probed with anti-BIM and anti-MCL1 antibodies. (E) IP was performed with a mouse anti-MCL1 antibody or the appropriate IC, to enable immunoblotting with a rabbit S69 phospho-BIM–specific antibody. (D-E) Data are representative of 3 independent experiments.
BIM phosphorylation and binding to MCL1. (A) CLL samples were treated with 20 μg/mL anti-IgM for the indicated times, and expression of MCL1 and β-actin was analyzed by immunoblotting. Figure shows results obtained with 3 CLL samples and is representative of a total of 6 samples. (B) Ramos cells were incubated in the presence or absence of anti-IgM for 30 minutes. Lysates were prepared and immunoprecipitations (IP) performed using an anti-BIM antibody or an isotype control (IC). The immunoprecipitates and a portion of the lysates were analyzed by immunoblotting using antibodies specific for MCL1 or BIM, as indicated. Open arrowheads indicate phosphorylated BIM isoforms. (C) Quantitation of BIMEL phosphorylation and the proportion of MCL1 associated with BIM in Ramos cells treated with anti-IgM for 30 minutes. The amount of MCL1 bound to BIM in unstimulated cells was set to 1.0. Data are derived from 6 independent experiments (mean ± SD). (D) Ramos cells were incubated for 30 minutes with or without IgM stimulation. The IP was performed using rabbit anti-MCL or the appropriate IC, and the precipitates/cell lysates were probed with anti-BIM and anti-MCL1 antibodies. (E) IP was performed with a mouse anti-MCL1 antibody or the appropriate IC, to enable immunoblotting with a rabbit S69 phospho-BIM–specific antibody. (D-E) Data are representative of 3 independent experiments.
Reverse immunoprecipitations using an MCL1 specific antibody confirmed that both BIMEL and BIML isoforms were present in MCL1 complexes in untreated cells (Figure 6D). After stimulation with anti-IgM, the relative amount of BIM coimmunoprecipitated with MCL1 was reduced from 1.0 in unstimulated cells to 0.16% ± 0.07% for BIMEL and 0.22% ± 0.03% for BIML (mean ± SD, n = 3; representative immunoblot experiment shown in Figure 6D). Residual BIM/MCL1 complexes contained phosphorylated BIMEL/BIML, demonstrating that phosphorylated BIM isoforms retain some ability to bind to MCL1. To specifically investigate the binding between MCL1 and S69-phosphorylated BIMEL, MCL1 immunoprecipitates were immunoblotted using the S69-phospho-specific antibody (Figure 6E). This analysis revealed an apparent low-level residual interaction between MCL-1 and S69-phosphorylated BIMEL. Therefore, phosphorylation of both BIMEL and BIML is associated with a release of the MCL1 survival protein.
Modulation of BIMEL phosphorylation in CLL cells after coculture with HK cells
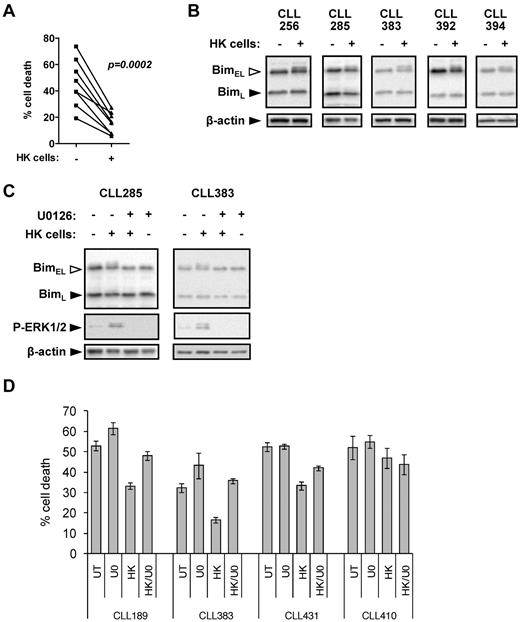
In addition to antigen, microenvironment-derived signals also play an important role in maintaining the survival of CLL cells.13 HK cells are a well-validated model to investigate pro-survival effects of the microenvironment on CLL cells.21 As previously shown, coculture with HK cells alone reduced spontaneous apoptosis of CLL cells (Figure 7A). In 6 of 10 samples, HK cell coculture was associated with detectable increases in phosphorylation of BIMEL, but not BIML (Figure 7B). In general, levels of BIMEL phosphorylation were lower than those induced by anti-IgM (median increase in responders was ∼ 50% for anti-IgM and ∼ 15% for HK cell coculture). Culture with HK cells increased ERK1/2 phosphorylation in the CLL cells, and U0126 completely prevented induction of BIMEL phosphorylation (Figure 7C), demonstrating that the HK-induced BIMEL phosphorylation detected is MEK1/2 pathway dependent.
BIM phosphorylation in CLL cells after coculture with HK cells. (A) CLL samples (n = 8) were cultured in the presence or absence of HK cells for 72 hours. Cell death was analyzed by PI staining in permeabilized cells. (B) CLL samples were cultured in the presence or absence of HK cells for 6 hours, and expression of BIM and β-actin was analyzed by immunoblotting. Data are representative of the responding cases. (C) CLL samples were cultured in the presence or absence of HK cells ± U0126 (10μM) for 6 hours, and expression of BIM, phospho-ERK1/2, and β-actin was analyzed by immunoblotting. (D) CLL samples were pretreated with U0126 (U0; 10μM) or left untreated as a control, before coculture with HK cells. After 48 hours, cell death was determined by annexin V/PI staining. Data are means of triplicate repeats (± SD).
BIM phosphorylation in CLL cells after coculture with HK cells. (A) CLL samples (n = 8) were cultured in the presence or absence of HK cells for 72 hours. Cell death was analyzed by PI staining in permeabilized cells. (B) CLL samples were cultured in the presence or absence of HK cells for 6 hours, and expression of BIM and β-actin was analyzed by immunoblotting. Data are representative of the responding cases. (C) CLL samples were cultured in the presence or absence of HK cells ± U0126 (10μM) for 6 hours, and expression of BIM, phospho-ERK1/2, and β-actin was analyzed by immunoblotting. (D) CLL samples were pretreated with U0126 (U0; 10μM) or left untreated as a control, before coculture with HK cells. After 48 hours, cell death was determined by annexin V/PI staining. Data are means of triplicate repeats (± SD).
Effects of MEK1/2 inhibition on CLL cell survival
Our results implicate modulation of BIM by ERK1/2 as an important survival response in CLL cells, and we therefore investigated whether MEK1/2 inhibition influenced CLL cell apoptosis. We first focused on the effects downstream of IgM engagement. In some samples, inhibiting MEK1/2 with U0126 enhanced apoptosis, but overall there was not a consistent response (data not shown). As previously described, anti-IgM stimulation increased, decreased, or had no effect on apoptosis, depending on the specific sample investigated.14,15,40-42 The variable effect of U0126 presumably reflects the overall heterogeneity of responses to anti-IgM stimulation.
We therefore next investigated the effects of U0126 on HK cell-mediated CLL cell survival, where survival responses were relatively homogeneous (Figure 7A). In 2 samples (CLL189 and CLL383), U0126 treatment alone increased levels of apoptosis; and in 3 samples (CLL189, CLL383, and CLL431), U0126 reduced the pro-survival effects of HK cell coculture (Figure 7D). In the fourth sample (CLL410), HK cell coculture had a modest pro-survival effect, but apoptosis levels were unaffected by U0126. These results demonstrate the importance of the MEK1/2 pathway and its downstream effect on ERK1/2 and BIM phosphorylation for CLL cell survival.
Discussion
Multiple lines of evidence support a role for antigen signaling and the microenvironment in development and progression of CLL.7,8,13 There is a strong indication that CLL cells resist apoptosis, but the mechanisms potentially linking BCR signaling to this resistance are not completely understood. Previous studies of signaling have generally focused on upstream kinases. However, it is the impact of these pathways on downstream regulators of cell survival that ultimately influences disease behavior. In this study, we focus on the pivotal role of the proapoptotic molecule BIM. We find that the 2 major isoforms, BIMEL and BIML, undergo phosphorylation in CLL cells stimulated with anti-IgM and that activation of this pathway in vitro is closely associated with disease behavior. Coculture with HK cells alone also promotes BIMEL phosphorylation, suggesting that BIM may serve to coordinate microenvironment and antigen-mediated survival signals.
Clinical significance
A key observation from this study is the close association between the ability of sIgM to induce BIM phosphorylation and progressive disease. This observation is to some extent expected, given the association between signaling and markers of poor prognosis disease, such as unmutated IGHV genes. However, the striking new observation is that IgM-induced BIM phosphorylation also correlated with progressive disease when analyzed specifically within the M-CLL subset. Previously, studies from our group and those of others, using a range of signaling measures including intracellular Ca2+ fluxes, have demonstrated that sIgM responses in vitro were more common in U-CLL.10,12,42 In M-CLL, the overall frequency of such responses was reduced, but a significant proportion of individual M-CLL samples retained signaling ability.10 No clear association of the operation of this signaling pathway with prognosis in M-CLL emerged. In contrast, our present findings suggest that sIgM-mediated BIM phosphorylation may reveal a subset of M-CLL at increased risk of progression. Because BIM phosphorylation is more directly coupled to regulation of apoptosis than intracellular Ca2+ fluxes, it may provide a particularly strong marker of functionally relevant responses to antigen engagement, and hence of clinical behavior.
Mechanisms of BIM regulation
Multiple BIM phosphorylation sites have been identified which are linked to both suppression and induction of apoptosis. We confirmed previous findings,37 demonstrating that BIMEL S69 was phosphorylated in anti-IgM–treated CLL cells, and this was also shown in Ramos cells. Using site-directed mutagenesis, we have now demonstrated that S69 is probably the major site but that there are potential roles for S77 and S104, indicating that, as in other systems, multisite phosphorylation of BIMEL occurs after sIgM stimulation. MEK1/2 inhibition blocked all BIMEL phosphorylation, confirming ERK1/2 as the likely principal regulatory kinase. Consistent with this, anti-IgM–induced ERK1/2 phosphorylation correlated with BIMEL phosphorylation, and also with disease progression.
We did not find strong evidence for anti-IgM–induced BIMEL degradation in CLL cells, despite S69 phosphorylation. This could be explained by our use of soluble rather than solid-phase anti-IgM. It is difficult to know the molecular form of candidate antigens in vivo, but they might include bacteria and/or apoptotic cells43,44 and immobilized anti-IgM appears to have a stronger pro-survival effect in vitro.15,41 It is possible that, in cells treated with soluble anti-IgM, ERK1/2-mediated phosphorylation fails to engage RSK1/2 phosphorylation activity at S93, S94, and S98, which is required for binding of the E3 ubiquitin ligase βTrCP and subsequent BIMEL degradation.45 Regardless, BIMEL phosphorylation appears to be a survival response because it was associated with release of MCL1. Interestingly, we detected a low level of interaction between MCL1 and S69 phosphorylated BIMEL, suggesting that, in contrast to BIMEL-overexpressing HEK293 cells,31 S69 phosphorylation is not sufficient to prevent MCL1 binding, but favors dissociation.
We also detected MEK1/2-dependent BIML phosphorylation in most responsive anti-IgM–treated CLL cells, and in Ramos cells. This is surprising because BIML lacks the serine residue equivalent to BIMEL S69 and the ERK docking domain required for BIMEL phosphorylation.46 Compared with BIMEL, there was a weaker correlation between levels of BIML and ERK1/2 phosphorylation, which may reflect a requirement for additional intermediates to effectively engage ERK1/2 signaling in the absence of an ERK-docking domain. It is possible that ERK1/2 “gains access” to BIML by binding to partner proteins, such as MCL1, which also undergoes MEK1/2-dependent phosphorylation. Differential expression of “cofactors” specifically required for BIML phosphorylation may also explain why BIMEL was selectively phosphorylated in sIgM-stimulated normal B cells. Alternatively, the selective phosphorylation of BIMEL may be related to signal strength because BIML was not phosphorylated in CLL cells cocultured with HK cells, where overall levels of BIM phosphorylation were low compared with anti-IgM–treated cells. Further characterization of the mechanisms and functional consequences of BIML phosphorylation are required, but this response is also probably linked to survival because coimmunoprecipitation demonstrated that BIML also sequestered MCL1 and anti-IgM stimulation was associated with release of MCL1 from both BIMEL and BIML in Ramos cells.
Apoptosis regulation in CLL
Engagement of sIgM in vivo by antigen, within the context of specific tissue microenvironments, is thought to play a key role in CLL, at least in part by activation of survival pathways leading to suppressed apoptosis and resistance to therapy. Previous studies have revealed a role for increased MCL1 expression in mediating both microenvironment and sIgM-mediated survival signals triggered by immobilized anti-IgM.14-16,21 Our studies using soluble anti-IgM indicate that modulation of BIM phosphorylation is a parallel pathway activated in CLL cells and that coordinated regulation of the BIM:MCL1 complex is probably a regulatory “node,” critical for controlling CLL cell apoptosis in response to multiple signals (supplemental Figure 3). Thus, whereas sIgM and microenvironment signaling pathways can up-regulate MCL1 expression, parallel phosphorylation of BIM prevents inhibition of this pro-survival protein, by releasing it from sequestration.
Whereas previous studies have shown PI3K/AKT signaling to play a major role in the induction of MCL1 in response to sIgM stimulation,14,15 our work suggests that MEK1/2/ERK1/2 signaling also functions as a survival pathway in CLL cells. Consistent with this, a recent study demonstrated that the Raf inhibitor sorafenib promotes apoptosis in CLL cells and overcomes survival effects of coculture with nurse-like cells.47 However, it is unclear to what extent this is mediated via effects on the downstream ERK1/2 pathway, or to off-target effects of the inhibitor that can inhibit additional kinases. Moreover, inhibition of PI3Kδ using CAL-101 interferes with anti-IgM–induced ERK1/2 activation, demonstrating that ERK1/2 may lie downstream of PI3K after sIgM stimulation in CLL cells.48 Thus, PI3K may coordinate survival signaling via both ERK1/2/BIM- and MCL1-dependent pathways. Our recent immunohistochemical studies have demonstrated ERK1/2 phosphorylation in proliferation centers of small lymphocytic lymphoma/CLL lymph nodes, confirming that this pathway is activated in vivo.49 In this study, we have shown that MEK1/2 inhibition reverses the survival effect of coculture with HK cells, at least in cases where HK-mediated survival was evident. MEK1/2 inhibition results were more complex in cells treated with anti-IgM, perhaps expectedly as the effect of sIgM stimulation alone results in highly variable responses in vitro. The PI3Kδ inhibitor CAL-101 has shown impressive responses in early clinical trials, especially in CLL.50 Dual inhibition of PI3K and MEK1/2 may be an effective therapeutic strategy to deprive CLL cells of sIgM and microenvironment-derived survival signaling in vivo.
The online version of this article contains a data supplement.
The publication costs of this article were defrayed in part by page charge payment. Therefore, and solely to indicate this fact, this article is hereby marked “advertisement” in accordance with 18 USC section 1734.
Acknowledgments
The authors thank Dr Yong Sung Choi (New Orleans, LA) for the gift of HK cells; Professor Martin Glennie (Southampton, United Kingdom) for the gift of rat IgG2a antibody; Drs Vlad Malykh, Helen McCarthy, Abe Jacob, Ben Kennedy, and Henri Grech, and Mr Richard Palmer and colleagues for providing CLL samples and associated data; the patients who donated clinical samples; Mrs Isla Henderson for characterization of CLL samples; Professor Christian Ottensmeier for support; and Dr Andrew Steele for helpful comments.
A.P. was supported by a PhD studentship from the University of Southampton. This work was also supported by Kay Kendall Leukaemia Fund, Cancer Research UK, the Southampton Experimental Cancer Medicine Centre, and Tenovus Solentside.
Authorship
Contribution: A.P., C.I.M., J.E.A., S.K., A.S.D., and K.N.P. performed the research and analyzed data; A.P., K.N.P., S.J.C., F.K.S., and G.P. designed the research and analyzed data; A.P. and G.P. wrote the initial draft of the manuscript; and all authors contributed to the modification of the draft and approved the final submission.
Conflict-of-interest disclosure: The authors declare no competing financial interests.
Correspondence: Graham Packham, Somers Cancer Sciences Building, Southampton General Hospital (MP824), Southampton, SO16 6YD, United Kingdom; e-mail: gpackham@soton.ac.uk.


