Abstract
Abstract 1231
Current methods for defining and isolating human hematopoietic stem and progenitor cells using surface markers enrich for unique functional properties of these populations. However, significant functional heterogeneity in these compartments remains with important implications for understanding normal and altered hematopoiesis. Using flow sorting to enrich >10,000 cells as progenitor subpopulations, we previously characterized the gene expression signature of normal human HSC (Majetiet al 2009 PNAS 106(9):3396–3401). We hypothesized that interrogation of the transcriptomes of single cells from this compartment could resolve remaining heterogeneity and help identify and better define features of progenitor cells and hematopoietic stem cells (HSCs).
Using normal human bone marrow aspirates and a FACS Aria II instrument equipped with a specialized single-cell sorting apparatus, we sorted cells enriched for HSCs based on expression of Lin-CD34+CD38-CD90+CD45RA− into 1-cell, 10-cell, 100-cell, and 40000-cell (bulk) representations. We used at least 5 replicates per group and verified single cell deposition by direct visualization. We amplified cDNA from these corresponding inputs using an exponential whole transcriptome amplification (WTA) scheme (Miltenyi SuperAmp), and evaluated gene expression profiles by two microarray platforms (Agilent/GE Healthcare 60K, and Affymetrix U133 plus 2.0), and by RNA-Seq (Illumina). We used gene expression correlation between replicates within and between microarrays as means of assessing methodological reproducibility and estimating population heterogeneity.
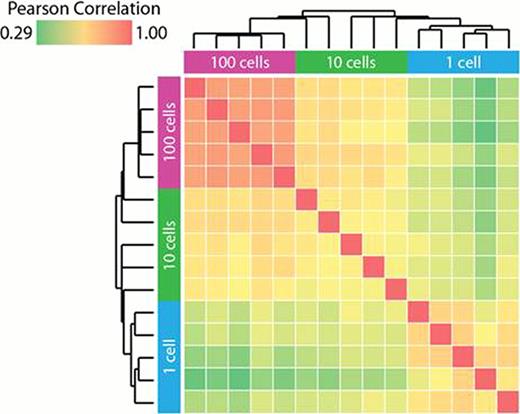
Whole transcriptome amplification yielded cDNA ranging from 0.2–1 kb for 10 and 100 cells, with significantly lower size distribution of amplified cDNA observed for single cells. Gene expression profiles had significantly better replicate reproducibility and array coverage with the Agilent microarray platform when compared with the Affymetrix U133 Plus 2.0 platform (gene coverage of 84 % for 100 cells, 73 % for 10 cells and 50% for 1 cell for Agilent vs 24 % for 100 cells, 11 % for 10 cells and 5.7% for 1 cell for Affymetrix). RNA-Seq profiling of the same populations is ongoing with major technical optimizations focused on reducing amplification of non-human templates while maintaining library complexity and representation. Using biological replicates for each input size, we observed high inter-replicate correlation levels for expression profiles obtained for bulk sorted HSCs from 8 healthy donors (∼40000-cells, average r=0.97) and for 100-cell and 10-cell inputs from a single donor (r=0.96–0.99, respectively). While intra-array concordance of replicate measurements (n=14642) was high (r>0.91) within each of 5 single cells from a single donor, comparison of 5-single cells from the same donor identified significant heterogeneity, when compared to the 10-cell and 100-cell sub-clusters (Figure 1). Individual genes characteristically expressed by these heterogeneous single cell populations are currently being investigated by FACS and Fluidigm arrays. A larger experiment characterizing 192 single progenitor cells, employing Agilent microarrays and RNA-Seq is currently in progress.
Single cell transcriptome profiling is feasible, with best performance on 60-mer microarrays. Single cell transcriptomes exhibit lower, but reasonable levels of reproducibility (r>0.7) and precision as compared with higher cell numbers. Gene expression profiles of single cells capture gene expression heterogeneity in HSCs.
Inter-array replicate correlation suggests heterogeneity in single cells. Inter-array replicate correlations (minimum log2 intensity = 7) with all pair-wise comparisons of 5 replicates for each cell number group (100, 10, 1 cell) were hierarchically clustered and plotted in a heat map, with the dendrograms shown above and to the left of the group labels. High inter-array replicate correlation was observed within the 100 cell group and to a lesser extent in the single cell group.
Inter-array replicate correlation suggests heterogeneity in single cells. Inter-array replicate correlations (minimum log2 intensity = 7) with all pair-wise comparisons of 5 replicates for each cell number group (100, 10, 1 cell) were hierarchically clustered and plotted in a heat map, with the dendrograms shown above and to the left of the group labels. High inter-array replicate correlation was observed within the 100 cell group and to a lesser extent in the single cell group.
No relevant conflicts of interest to declare.
Author notes
Asterisk with author names denotes non-ASH members.


