Abstract
Secondary Acute Myeloid Leukemia (sAML) is associated with prior treatment for other malignancies, particularly chemotherapy (Chemo) or radiation therapy (RT), and characterized by very bad prognosis due to high-risk features and poor clinical outcomes.
We identified 1073 patients (pts) at MDACC since March 1976 to Sept. 2011 with sAML, who were diagnosed with 1 (n=943), 2 (n=117), or 3 (n=12) Prior Malignancies (PM). Pts' characteristics, including age; type of PM; number and treatments for PM; and characteristics at sAML diagnosis such as % bone marrow and blood blasts, WBC, hemoglobin, platelet and neutrophil count, FAB, and karyotype were analyzed and correlated with survival outcome. A prognostic score for survival was developed using significant variables identified in multivariable analysis (MVA).
Median time to sAML was 64 months (mo) and 46 (p=0.000) for pts with 1 or >1 PM, respectively; longer for pts with untreated PM (62 vs 27, mo p=.008) and correlated with type of PM (p=0.001) and previous monotherapy (Surgery vs RT vs Chemo, p=.006). Median age at sAML was 66 years; 54% (n=574) were male; and pts had 1, 2 or 3 PM in 88, 11 and 1% cases, respectively. All FAB categories were represented. Median baseline characteristics at sAML were as follows: HGB 9 g/dL (2.6–17.5), PLT 49K/μL (1–1,518), WBC 4K/μL (.02–367.2), ANC 890/μL (0–84100), blood blasts 8% (0–99), and bone marrow blasts 40% (0–99). Type of prior malignancy reflected prior treatment: breast (21%), hematological (20%), prostate (14%), and skin (10%) were the most represented as 1st malignancies; 728 underwent prior surgery, 468 received prior RT, and 563 pts received prior Chemo alone or in combination, 40 pts were untreated for their PM. For pts with sAML who had only undergone prior surgery (n=310), favorable-, intermediate-, and poor-risk karyotype was reported for 9, 49, and 32%, respectively. Pts with sAML previously treated with RT only (n=72) had favorable-, intermediate-, and poor-risk karyotype in 8, 56, and 24% cases, respectively. Those who had previously received only Chemo (n=124) had favorable-, intermediate-, and poor-risk karyotype in 6, 21, and 57% cases, respectively. Univariable (UVA) and MVA analysis for survival are shown in the Table.
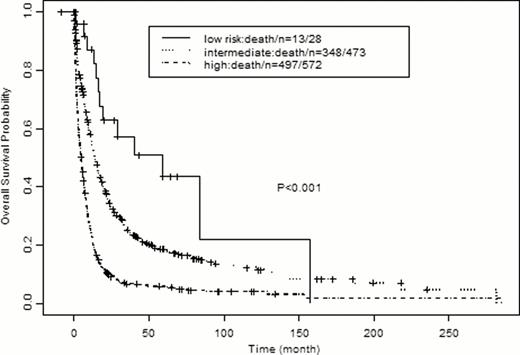
We identified 3 survival risk-categories (Figure) according to a sum total score in which a point was given for each of the following significant variables identified in the MVA: PM Treatment (other than surgery), Age ≥60, Plt <50, Hgb <10, WBC ≥10, blood blasts >20%, and Kayotype int; 2 points was given for bad Karyotype. The estimated median OS was 58.6 (19.4, NA) mos for Group 1 (0–1 points), 13.9 (12.1, 16.2) mos for Group 2 (2–4 points), and 4.8 (4.1, 5.72) mos for Group 3 (5–8 points).
Patients diagnosed with sAML are high-risk for poor survival. Characteristics independently associated with short survival were identified and a prognostic score system was developed. Unfavorable karyotype remains a major factor associated with short survival. Validation of this model will come from prospective studies and additional insights should come from gene sequencing studies.
| Variable . | UVA . | MVA . | ||||
|---|---|---|---|---|---|---|
| Survival (mos) . | p . | HR . | 95% CI . | p . | ||
| #PM | ≥1 vs. 1 | 5.2 vs. 8.6 | <0.01 | 1.29 | 1.04 – 1.60 | 0.02 |
| PM Treatment | (CHT vs RT) vs. Surgery | (3.5 vs. 5) vs. 11.7 | <0.01 | 1.37 | 1.16 – 1.34 | <0.01 |
| Karyotype | Bad vs. Good | 4.7 vs. 58.6 | <0.01 | 3.33 | 2.27 – 5 | <0.01 |
| Bad vs. Int | 4.7 vs. 12 | <0.01 | 1.79 | 1.52 – 2.08 | <0.01 | |
| Age | ≥60 vs. <60 | 7.1 vs. 10.5 | <0.01 | 1.79 | 1.5 – 2.14 | <0.01 |
| PLT | <50 vs. ≥50 | 6.5 vs. 9.6 | <0.01 | 1.32 | 1.12, 1.54 | <0.01 |
| HGB | <10 vs. ≥10 | 7.5 vs. 9.8 | 0.02 | 1.2 | 1.01 – 1.43 | 0.03 |
| WBC | ≥10 vs. <10 | 5 vs. 9.6 | <0.01 | 1.5 | 1.23 – 1.82 | <0.01 |
| PB blast | ≥20 vs. <20 | 5.3 vs. 10 | <0.01 | 1.27 | 1.07 – 1.5 | 0.01 |
| BM blast | ≥20 vs. <20 | 7.4 vs. 13.7 | <0.01 | 1.06 | 0.81 – 1.41 | 0.65 |
| ANC | <1000 vs. ≥1000 | 6.6 vs. 9.4 | <0.01 | 1.12 | 0.95 – 1.33 | 0.19 |
| GENDER | Male vs Female | 7.2 vs. 8.9 | 0.11 | NA | NA | NA |
| Type of PM | Hematologic vs Others | 5.9 vs 8.2 | 0.05 | 1.06 | 0.87 – 1.29 | 0.56 |
| FAB | Others vs M3 | 7.6 vs. 61.3 | <0.01 | 1.47 | 0.86 – 2.5 | 0.16 |

No relevant conflicts of interest to declare.

This icon denotes a clinically relevant abstract
Author notes
Asterisk with author names denotes non-ASH members.


