Abstract
Abstract 1721
The Nordic scoring system is commonly used to predict response to ESA's in MDS patients and is comprised of two weighted elements, patient's endogenous erythropoietin levels and transfusion dependency status, and three predictive categories of ESA response rates (E. Hellstrom-Lindberg et al., BJH 1997). We set out to validate the Nordic scoring system using the modified IWG erythroid response criteria for MDS 2006 (BD Cheson et al. Blood 2006) and identify any other clinical elements of prognostic importance.
We conducted a retrospective review of 135 patients in a prospectively maintained MDS database of 400+ patients enrolled between the years of 2005 and 2012. Patients flagged as having had previous ESAs were included and categorized as ESA naive erythropoietin (EP), ESA naïve darbepoetin (DP), ESA non-naive EP and ESA non-naive DP. Nordic scores were calculated (when possible) using patient transfusion status and erythropoietin levels preceding ESA use, and actual response rates were determined using electronic medical records and transfusion histories. We recorded doses and schedules and evaluated the impact of WHO classification (3 groups) and IPSS risk score (L, Int-1 and Int-2) on overall response as well. We excluded patients who converted to AML during ESA trial, Jehovah witnesses and those with high risk MDS. We did not calculate Nordic scores in patients concurrently on ESA when referred to our center.
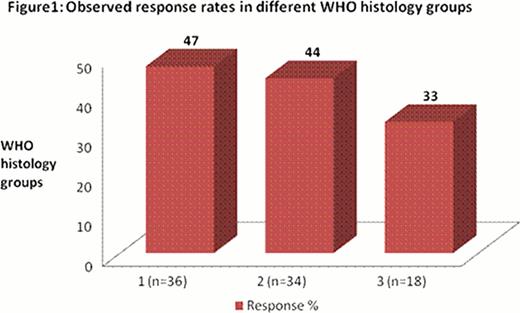
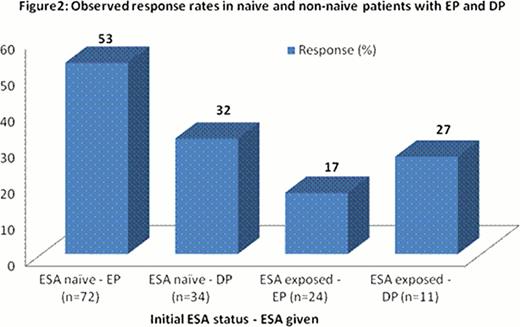
The patient population had a median age of 76 with 59% male. Out of 135 patients, 90 were put on EP, 35 put on DP and 10 put on both, with DP following EP in the 10 patients. Starting dose for most EP patients (59%) was 40,000 units q week with escalation to 60,000 units in non/suboptimal responders. GCSF was added concurrently in 36 (27%) patients. Starting dose for 71% of DP patients was 500 ug q3 weeks with increase to Q2 weeks for suboptimal response. The Nordic score was ‘calculatable’ in 109 patients pre ESA. Table 1 summarizes the response rates by Nordic score, IPSS transfusion dependence and type of ESA. Figures 1 and 2 depict response rates by ESA exposure and by WHO categories 1–3(see legend). We were not able to accurately document response durations.
The Nordic scoring system is still valid for predicting response to ESA using IWG erythroid response criteria 2006 with slightly lower response rates at the highest score of > +1 than previously reported of 74%. We observed higher erythroid response rates in EP treated (42%) versus DP treated (31%) patients even after adjusting for Nordic scores. As expected, transfusion dependent MDS patients had lower responses to ESA than those independent of transfusions.
Response rates by Nordic score, IPSS, Transfusion status and ESA
| Patient Categories* . | Sample size . | Response (%) . |
|---|---|---|
| All patients | 135 | 39 |
| Nordic scores | ||
| >+1 | 65 | 54 |
| -1 to +1 | 42 | 31 |
| <-1 | 3 | 67 |
| IPSS groups | ||
| Low | 23 | 52 |
| Intermediate-1 | 28 | 18 |
| Intermediate-2 | 7 | 14 |
| Transfusion | ||
| Dependent | 60 | 28 |
| Independent | 75 | 48 |
| ESA | ||
| EP | 100 | 42 |
| Nordic >+1 | 37 | 62 |
| Nordic -1 to +1 | 34 | 38 |
| DP | 45 | 31 |
| Nordic >+1 | 27 | 37 |
| Nordic -1 to + 1 | 8 | 0 |
please note that Nordic scores, WHO classifications and IPSS scores could not be determined in all patients.
Legend:
Unclassified+5q+RA+RARS+MDS-U+RCUD-A
RCMD+RCMD-RS
RAEB1+RAEB2+CMML1+CMML2
Legend:
Unclassified+5q+RA+RARS+MDS-U+RCUD-A
RCMD+RCMD-RS
RAEB1+RAEB2+CMML1+CMML2
Wells:Alexion: Honoraria, Research Funding; Janssen Ortho: Honoraria, Research Funding; Celgene: Honoraria, Research Funding; Novartis: Honoraria, Research Funding. Buckstein:Celgene: Honoraria, Research Funding.
Author notes
Asterisk with author names denotes non-ASH members.


