Abstract
Abstract 3778
The EUTOS score has recently been developed by the European Leukemia-Net (ELN) to predict the achievement of an 18-month complete cytogenetic response (CCyR) and progression-free survival in imatinib-treated early chronic phase (ECP) chronic myeloid leukemia (CML) patients. The score uses the percentage of basophils and spleen size to divide patients in 2 groups of low- and high-risk. Since its publication in 2011, however, there have been conflicting reports about the efficacy of EUTOS score. Moreover, scanty data are available on the power of this scoring system to foresee optimal response to imatinib, as defined by ELN recommendations.
To test the power of EUTOS score in predicting achievement of optimal response to imatinib, as defined by ELN, time to imatinib failure (TTF) and progression-free survival (PFS), we evaluated 265 ECP CML patients treated with front-line standard dose imatinib (400 mg daily) at 5 major hematology centres in the north-eastern area of Italy. Partial cytogenetic response (PCyR) and CCyR were defined as 1–35% and 0% Ph+ metaphases, respectively; major molecular response (MMR) was defined as BCR-ABL <0.1%IS. TTF was measured from the start of imatinib to the date of any of the following events: progression to accelerated or blastic phase, death for any cause at any time, imatinib dose increase (≥ 600 mg/day) for primary or secondary hematologic or cytogenetic resistance. PFS was measured from the start of imatinib to the date of progression to accelerated or blastic phase or death for any cause at any time. Survival probabilities were estimated by the Kaplan-Meier method and compared by log rank test; differences among variables were evaluated by the Fisher's exact test or by Student's t-distribution.
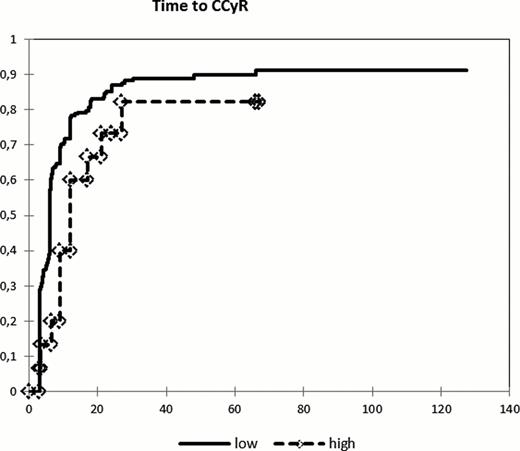
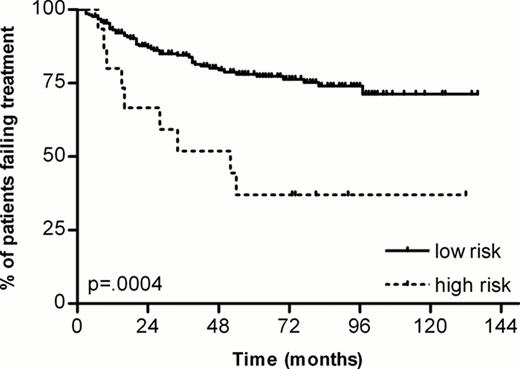
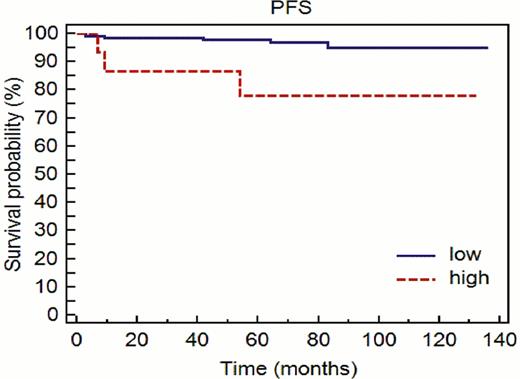
A total of 265 consecutive patients with ECP CML were included in this study. The median age was 55 years (range 19–84), with 149 males and 116 females. The median follow-up was 61 months (range 6–136). The median time from diagnosis to imatinib therapy was 0.7 months (range 0 – 7.6). The distribution according to the EUTOS score was: 248 patients (93.6%) in the low risk group and 17 patients (6.4%) in the high risk group. The “optimal response” endpoints to imatinib (i.e. PCyR at 6th months, CCyR at 12th months and MMR at 18th months) were higher in low-risk patients, but did not achieve statistical significance. Specifically, the values were as following: PCyR 86% vs 67% (p=0.055), CCyR 80% vs 63% (p=0.117) and MMR 61% vs 36% (p=0.126). Cumulative incidence of CCyR was comparable in the two groups (88%% in low-risk and 80% in high risk), but time to CCyR was shorter in low-risk patients (6 months) compared to the one in high-risk patients (9 months) (p=0.048) [figure 1]. More importantly, EUTOS score was able to predict long term response to therapy. Indeed, 59% of patients in the high-risk group experienced imatinib failure, compared to 30% in the low-risk group (p=0.027). Moreover also TTF was significant shorter in the high-risk group [figure 2]. Fifty-three patients in the low-risk group (21%) were switched to 2nd-generation TKIs (29 dasatinib, 22 nilotinib, 1 bosutinib, 1 ponatinib), compared to six (35%) in the high-risk group (4 dasatinib, 2 nilotinib). Also PFS rate was significantly worse in patients with high EUTOS score, with 11/248 events (4%) in the low-risk group and 4/17 (23%) in the high-risk cases (p=0.01) [figure 3].
In our study group, the EUTOS score was predictive for long-term outcome of imatinib therapy, both in terms of treatment failure and of progression-free survival. Taking into consideration the ELN definitions of optimal response, there was a trend toward better cytogenetic and molecular response in low-risk patients; the lack of statistical significance could be due to the relatively small number of high-risk cases.
Time to CCyR (p=0.048)
Time to treatment failure (p=0.0004)
Progression-free survival (p=0.01)
No relevant conflicts of interest to declare.
Author notes
Asterisk with author names denotes non-ASH members.


