Abstract
Abstract 4231
In the US, understanding the costs associated with Myelodysplastic Syndromes (MDS) is challenging given that multiple channels including pharmacy, ambulatory, and inpatient hospitalization (IPH) settings make up the total expenses to manage patients. Recent studies suggest that MDS patients under active medical management experience fewer cytopenia-related medical problems compared to untreated, transfusion dependent (TD) patients who require more medical treatments, often for recurrent infections and bleeding complications. It is clear that persistence of drug therapy is essential to achieve optimal clinical responses for MDS patients and we sought to determine if continued therapy also optimized costs related to the disease.
To evaluate the relationship between treatment persistence with AZA and health care costs encountered for patients with MDS.
Commercial and Medicare Advantage enrollees with a diagnosis of high grade MDS (ICD-9, 238.73) who initiated AZA with pharmacy and medical benefits in the prior 6 months and who had a variable follow up period from initiation of AZA to disenrollment or end of study were identified in a US health plan claims database (1/1/2007-6/30/2010). The number of AZA “cycles” was calculated by dividing the total number of AZA administrations by 7 days, with a sensitivity analysis for 5 day administration, - commonly utilized in the “real-world”. Persistence was defined as the number of cycles of AZA. Eligible patientshad to have at least 2 AZA cycles. An independent analysis identified health care costs for the same patients during periods of transfusion-dependence (TD) - defined as periods in which they received 2 transfusions in an 8 week period and did not receive erythropoietin-stimulating agents (ESAs) or AZA. Average Per Patient Per Month (PPPM) costs were examined among patients with various lengths of TD periods, up to 1 year. Linear models were used to examine the relationship between persistence on AZA and PPPM health care costs. Healthcare costs included both payer and patient paid amounts under the medical and pharmacy benefit. Medical costs were further broken out into IPHs, ambulatory, and other costs captured. Several sensitivity analyses were performed to confirm the robustness of the results such as excluding patients with IPH prior to AZA initiation, and including patients with <2 cycles of AZA.
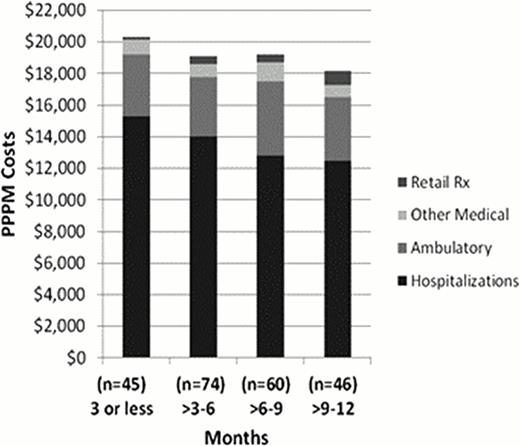
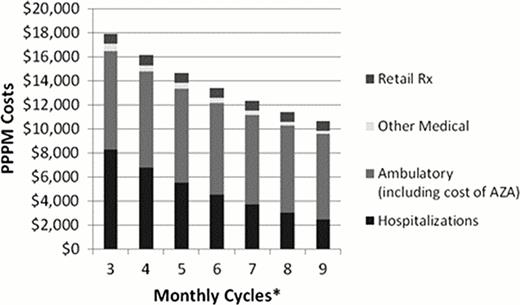
The baseline cost breakdown for MDS patients (n=225) who were transfusion dependent and not receiving treatment are outlined in Figure 1. Interestingly, the largest proportion of the medical costs for TD patients comes from IPHs. In fact, the PPPM IPH costs among TD periods account for approximately 65–75% of total health care costs - even at one year of their diagnosis. A similar analysis was done for patients completing at least 2 cycles of AZA (n = 100) which suggested that the proportion of cost related to IPHs was closer to 40%. This cohort averaged 6.3 cycles (median = 5) with 24% of patients completing at least 8 cycles. Importantly, completion of every additional AZA cycle (baseline 7day analysis) was found to be associated with, on average, a 6% decrease in medical care costs (p=0.005) driven largely by an 18% decrease in IPH costs (p<0.001; Figure 2) due to fewer medical events. Even a single additional AZA cycle was found to be associated with 5% lower total health care cost (p=0.006). These results also hold in the sensitivity analyses. As expected, an examination of medical needs of both TD and AZA treated patients led infections as a frequent driver of IPHs.
Patients who persist with AZA therapy have lower PPPM medical costs, driven by decreased expenditures on IPHs. This is consistent with results identified in the AZA-001 clinical trial in which patients receiving AZA experienced reduced IPHs driven by less transfusions and need for IV antibiotics, antifungals, and antivirals. These lower overall costs offset the expected increase in continuing therapy based on the cost of drug alone. Improving duration of therapy of AZA may not only optimize clinical outcomes but may decrease cumulative costs of care among high risk MDS patients.
Avg. Monthly Hospitalization Costs Remain Steady during TD Periods of up to 12 Months.
Avg. Monthly Hospitalization Costs Remain Steady during TD Periods of up to 12 Months.
PPPM (Per Patient Per Month) Healthcare Costs per MDS Patient as a Function of AZA Persistence
PPPM (Per Patient Per Month) Healthcare Costs per MDS Patient as a Function of AZA Persistence
Smith:Celgene: Consultancy. Mahmoud:celgene: Employment. Dacosta Byfield:Celgene: Consultancy. Henk:Celgene: Consultancy.
*assuming 7-day administration cycles
Author notes
Asterisk with author names denotes non-ASH members.


