Abstract
Abstract 4921
Lenalidomide, a novel therapeutic agent, has been found to be effective for the treatment of relapsed or refractory myeloma. However, the ideal lenalidomide dose to obtain sufficient therapeutic efficacy without causing hematologic toxicity is yet to be determined. Although Dimopoulos et al. reported that the initial lenalidomide dose can determined on the basis of renal function (i. e., creatinine clearance) and peripheral blood cell counts (namely, neutrophil and platelet counts), dose adjustments, particularly after drug administration, were necessary in some cases because of interindividual differences in pharmacokinetics. We believe that it might be possible to determine the ideal dose by measuring the plasma concentration of lenalidomide.
We aimed to develop an equation for the predicted total area under the observed plasma concentration–time curve (AUC) of lenalidomide and to set the ideal lenalidomide dose in patients with multiple myelomas by using only 1 or 2 sampling points.
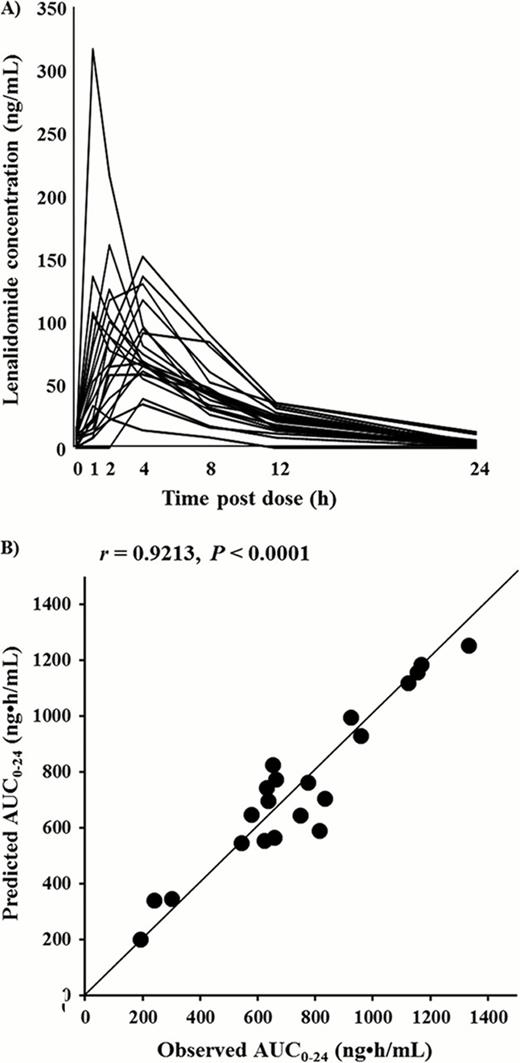
Twenty-one myeloma patients treated with lenalidomide according to the dose recommended by Dimopoulos et al. were enrolled in this study after obtaining written informed consent. Plasma concentrations of lenalidomide from samples obtained just prior to and 1, 2, 4, 8, and 12 h after oral administration of lenalidomide were analyzed using high-performance liquid chromatography (HPLC) (Figure A). Pharmacokinetic analysis of lenalidomide was carried out with a standard non-compartmental method using WinNonlin (Pharsight Co., CA, version 4. 0. 1). The AUC0–24 was calculated using the linear trapezoidal rule.
The plasma concentrations of lenalidomide at 2 and 4 h (C2h and C4h, respectively) after its administration were highly correlated with the AUC0–24 value for lenalidomide. The correlation observed between the measured and predicted AUC0–24 values for lenalidomide by using only the C2h and C4h sampling points in the equation (predicted AUC0–24 = 2. 0·C2h + 6. 8 ·C4h +55. 3) is shown in Figure B. The coefficient of determination between the predicted and measured AUC0–24 values was 0. 9213 (P < 0. 0001). In 4 patients for whom the drug was discontinued or administered at a lower dose because of the development of hematologic toxicity in a subsequent course of therapy, the measured AUC0–24 values were significantly higher than the corresponding values in 17 patients who continued to receive lenalidomide (1162 ng·h/ml vs. 646 ng·h/ml, P = 0. 004). Moreover, the results of receiver-operating characteristic curve (ROC) analysis of best sensitivity (100%) and specificity (94. 1%) showed that the ideal AUC0–24 of lenalidomide could be set below 940 ng·h/ml to avoid hematological toxicity. The area under the ROC curve was 0. 985 +-0. 023.
The predicted AUC0–24 value might be a new indicator for the management of lenalidomide therapy. In this study, the threshold predicted AUC0–24 values suggested that 4 of 21 patients (19%) should have received a lower initial dose than that recommended by Dimopoulos, et al. It is possible to adjust the ideal dose by using the equation for AUC0–24 with the C2h and C4h values in a test before lenalidomide therapy is actually initiated. Therapeutic drug management (TDM) of lenalidomide can be performed by establishing the minimum effective concentration and the minimum toxic concentration in a large prospective study in the future. These findings should provide economic benefits and facilitate personalized medicine in myeloma therapy with lenalidomide.
A) Plasma concentration-time profiles of lenalidomide in 21 patients.
B) Correlation between the observed area under the concentration-time curve (AUC0–24) and the predicted AUC0–24 calculated with an equation involving concentration at 4 h (C4h) after lenalidomide administration.
A) Plasma concentration-time profiles of lenalidomide in 21 patients.
B) Correlation between the observed area under the concentration-time curve (AUC0–24) and the predicted AUC0–24 calculated with an equation involving concentration at 4 h (C4h) after lenalidomide administration.
No relevant conflicts of interest to declare.
Author notes
Asterisk with author names denotes non-ASH members.


