Abstract
Abstract 5176
Disturbances of thyroid function is known to frequently occur in Thalassemia Major (TM); its types prevalence and severity vary in different cohorts. Primary hypothyroidism is caused by failure of thyroid function, while central (secondary) hypothyroidism by inefficient secretion of thyroid-stimulating hormone (TSH) due to pituitary gland dysfunction or reduced thyrotropin-releasing hormone (TRH) secretion from the hypothalamus. TSH levels in primary hypothyroidism are increased, while levels of free T4 (FT4) are decreased or within normal range. In secondary hypothyroidism FT4 levels are low and TSH levels normal or low.
The main objective of this retrospective study was to assess the prevalence of central and primary hypothyroidism in a cohort of 364 Greek patients with TM (mean age 33. 0±9. 9 years, range: 1–56 years).
Data from sequential laboratory evaluation on thyroid function in 364 patients with TM were retrospectively collected and analyzed. Assessment of thyroid function included measurements of TSH, T4, T3, FT4, FT3, anti-TPO, anti-TG by classical methods. Diagnostic criteria for primary hypothyroidism consisted of two consecutive measurements of low T4 or FT4 with increased TSH levels or two consecutive abnormally high levels of TSH despite normal levels of FT4, FT3, T4 and T3. The criteria for diagnosis of central hypothyroidism consisted of two consecutive measurements of low levels of T4 or FT4 with normal or low levels of TSH. In addition the age and ferritin levels at diagnosis of the hypothyroidism, as well as the type of thyroid treatment and chelation were recorded. To study the longitudinal prevalence of thyroid dysfunction, patients were stratified into 3 groups, according to the year of birth (Group A=1960–1970, 49 patients; Group B =1971–1980, 195 patients; Group C=1981–1990, 75 patients). As thyroid dysfunction increases with age, the incidence of thyroid disorders was compared between all three groups for patients ≤30years old, and for patients ≤40 years old between the groups A and B. Statistical analysis as well as BoxPlot values and regression lines presentation were performed using the STATGRAPHICS Centurion XVI. Statistical significance was set at p<0. 05.
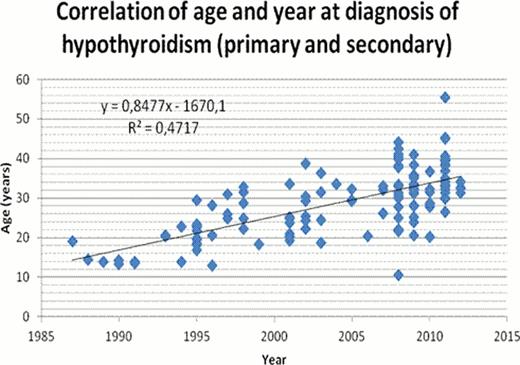
A total of 364 patients (mean age 33. 0±9. 9 years, 180 females, 184 males) with TM were evaluated. Relevant data on the type and prevalence of thyroid dysfunction in all three groups of patients are summarized in table 1. Figure 1 illustrates the correlation between the age and the year of diagnosis of hypothyroidism.
Comparing the data of the three age groups no significant differences in the overall prevalence of hypothryroidism was found. A significantly higher incidence of central hypothyroidism was found in group C compared to groups B and A (p=0. 00087, p=0. 0097 respectively) and higher prevalence of primary hypothyroidism in group A (for patients aged <40 years) in comparison with group B (p=0. 012). Ferritin levels at the time of diagnosis were significantly lower in group A compared to B and C and in group B compared to C (A/B p=0. 0014; B/C p=0. 0342; A/C p<0. 0001).
A significant correlation (R2 =0. 47) was found between the age at diagnosis of hypothyroidism and the year of diagnosis (figure 1).
The study demonstrated that thyroid disorders remain a frequent problem in Greek patients with TM with a trend of increasing prevalence with age and modification of the ratio of primary to secondary hypothyroidism. The increased incidence of central hypothyroidism in recent years could be attributed to an increased awareness and a more precise evaluation of this condition. The fact that ferritin levels at diagnosis were significantly higher in the younger age cohort may be suggestive that novel iron chelation modalities are more protective against iron-induced thyroid toxicity. Nevertheless, as toxicity may occur in early stages, the impact of these modalities in the incidence and severity of thyroid dysfunction may take years to be apparent.
Types and prevalence of thyroid dysfunction in three age cohorts of 364 TM patients
| Type of Thyroid Dysfunction . | Group A (n=49) . | Group B (n=195) . | Group C (n=75) . | ALL (n=364) . |
|---|---|---|---|---|
| Primary % (n) | 16.3 (8) | 20 (39) | 21.3(16) | 17.6 (64) |
| Secondary % (n) | 28.6 (14) | 21.5 (42) | 9.3 (7) | 17.3 (63) |
| Thyroiditis % (n) | 4.0 (2) | 1.5 (3) | 1.3 (1) | 1.6 (6) |
| Thyroid Cancer % (n) | 4.0 (2) | 0.5 (1) | 0 | 0.8 (3) |
| Normal thyroid function % (n) | 46.9 (23) | 56.4 (110) | 68.0 (51) | 62.6 (228) |
No relevant conflicts of interest to declare.
Author notes
Asterisk with author names denotes non-ASH members.


