Abstract
Chromosome translocation 8q22;21q22 [t(8;21)] is commonly associated with acute myeloid leukemia (AML), and the resulting AML1-ETO fusion proteins are involved in the pathogenesis of AML. To identify novel molecular and therapeutic targets, we performed combined gene expression microarray and promoter occupancy (ChIP-chip) profiling using Lin−/Sca1−/cKit+ cells, the major leukemia cell population, from an AML mouse model induced by AML1-ETO9a (AE9a). Approximately 30% of the identified common targets of microarray and ChIP-chip assays overlap with the human t(8;21)–gene expression molecular signature. CD45, a protein tyrosine phosphatase and a negative regulator of cytokine/growth factor receptor and JAK/STAT signaling, is among those targets. Its expression is substantially down-regulated in leukemia cells. Consequently, JAK/STAT signaling is enhanced. Re-expression of CD45 suppresses JAK/STAT activation, delays leukemia development, and promotes apoptosis of t(8;21)–positive cells. This study demonstrates the benefit of combining gene expression and promoter occupancy profiling assays to identify molecular and potential therapeutic targets in human cancers and describes a previously unappreciated signaling pathway involving t(8;21) fusion proteins, CD45, and JAK/STAT, which could be a potential novel target for treating t(8;21) AML.
Introduction
Acute myeloid leukemia (AML) is a common hematologic malignancy characterized by an abnormal accumulation of myeloid precursors in the bone marrow and blood. Similar to many other types of cancer, genetic abnormalities are associated with the development of AML, particularly chromosomal translocations that result in novel fusion proteins. One of the common translocations implicated in AML is the 8q22;21q22 translocation [t(8;21)].1 Based on the French-American-British (FAB) classification of leukemic cells, t(8;21) is associated with nearly 40% of the AML cases with the FAB M2 phenotype.2
t(8,21) involves the AML1 (RUNX1) gene on chromosome 21 and the ETO (MTG8, RUNX1T1) gene on chromosome 8.3-5 AML1 is the DNA-binding subunit of the core binding factor (CBF) transcription factor complex. Its N-terminus contains a highly conserved DNA binding domain called the runt homology domain (RHD). t(8;21) fuses the N-terminus of AML1 including RHD in-frame with almost the entire ETO protein to form AML1-ETO.3-6 This fusion protein acts as a dominant negative form of AML1 during embryogenesis.7,8 It functions as a transcriptional repressor by interacting with NCoR/SMRT/HDAC.9,10 AML1-ETO was shown to activate expression of BCL-2 and p21, possibly via interacting with p300.11-13
AML1-ETO promotes stem cell renewal and blocks hematopoietic differentiation.14-16 However, its role in blocking cell-cycle progression and promoting apoptosis contradicts its function in promoting leukemogenesis and therefore requires secondary mutagenic events for full transformation.17,18 We previously identified a single nucleotide insertion that resulted in a truncated AML1-ETO protein (AML1-ETOtr or AEtr), which rapidly promoted leukemia.19 Subsequently, we identified a C-terminally truncated variant of AML1-ETO named AML1-ETO9a (AE9a), resulting from alternative splicing and found to coexist with full-length AML1-ETO in most analyzed t(8;21) AML patients.20 Similar to AEtr, AE9a causes a rapid onset of leukemia in mice,20 which provides a useful mouse model to study the molecular biology of t(8;21) leukemia.
To understand the molecular mechanism of AML1-ETO–related leukemia development and to explore novel therapeutic targets to treat this type of leukemia, in this study we combined gene expression microarray and promoter occupancy (ChIP-chip) analyses to identify genes directly modulated by AE9a in primary murine leukemia cells. Among the common targets of microarray and ChIP-chip assays, approximately 30% show human t(8;21)–specific up or down-regulation compared with AML that have other chromosomal abnormalities. CD45, a protein tyrosine phosphatase and a negative regulator of cytokine/growth factor receptor and JAK/STAT signaling,21-23 is among those targets. Its expression is down-regulated in AE9a leukemia cells. Consequently, JAK/STAT signaling is enhanced in these leukemia cells. We show that re-expression of CD45 suppresses JAK/STAT activation, delays leukemia development by AE9a and results in apoptosis of t(8;21)–positive cells. This study highlights the benefit of combining genomic applications of gene expression and promoter occupancy profiling assays to identify potential therapeutic targets in human disease. In addition, we uncovered a previously unappreciated signaling pathway involving t(8;21) fusion proteins, CD45 and JAK/STAT, which could be a potential novel target for treating t(8;21) AML.
Methods
For more details on materials and methods, see supplemental Methods (available on the Blood Web site; see the Supplemental Materials link at the top of the online article).
Animals
MF-1 mice, as previously described,19 and C57BL/6 mice were used in this study. Animal housing and research were approved by the Institutional Animal Care and Use Committee of the University of California, San Diego, CA.
Microarray analysis
Total RNA was extracted from sorted wild-type or leukemia LK cells with the RNeasy Mini Kit (QIAGEN). Two hundred ng of total RNA from each sample were used for microarray analysis (GeneChip Mouse Genome 430 2.0 Array, Affymetrix) with the MessageAmp II-biotin enhanced single round aRNA amplification kit (Ambion). Experiments were performed in triplicates using 3 independent sets of RNA samples with a total of 6 arrays. Data normalization was performed using robust multichip average (RMA)24 within RMA Express 1.0 (http://rmaexpress.bmbolstad.com). The group comparisons were performed using BRB-ArrayTools (http://linus.nci.nih.gov/BRB-ArrayTools.html) with a 2-sample t test separately for each gene with a univariate test significance of 0.001. The false discovery rate (FDR) was calculated for each gene using the Benjamini-Hochberg correction for multiple testing.25 For a gene to be considered significantly induced or repressed, the P value of the univariate test should be < .001, the fold difference ≥ 1.5, and the signal intensity ≥ 100 in at least 1 of the arrays. The data have been deposited in the Gene Expression Omnibus (GEO) database as the series accession no. GSE15195.
ChIP and ChIP-chip assays
ChIP and ChIP-chip assays were performed as previously described.26 Briefly, a total of 109 AE9a leukemia splenocytes were fixed with formaldehyde and disrupted by sonication to generate 500 to 2000 bp chromatin fragments. To enrich for target genes bound to the HA-tagged AE9a, we immunoprecipitated the resulting chromatin fragments (2 mg) with 10 μg of rabbit–anti-HA (Santa Cruz) or rabbit–anti-AML1.20 A control experiment was performed with rabbit-immunoglobulin (Ig)G (Sigma-Aldrich). After reversal of crosslinks and purification, the enriched DNA was amplified by ligation-mediated polymerase chain reaction (PCR) and subsequently labeled with the Cy5 fluorophore by random priming. For normalization, the chromatin DNA that was not enriched by immunoprecipitation was also amplified by ligation-mediated PCR and labeled with the Cy3 fluorophore. The ChIP enriched and nonenriched (input) pools of DNA were cohybridized under stringent conditions to a 385K mouse MM5 condensed tiling promoter/regulatory sequence array set, which contains 24 939 regions of expected promoter activity on 2 arrays (Roche NimbleGen). Signal intensity data were extracted from the scanned images of each array using Roche NimbleGen NimbleScan Version 2.4 software. The log2 ratio of signals for the ChIP and input samples that were cohybridized to the array was computed and scaled to center the ratio data around zero. Scaling was performed by subtracting the bi-weight mean for the log2-ratio values for all features on the array from each log2-ratio value. Using NimbleScan software, peak data were generated from the scaled log2-ratio data. NimbleScan software detects peaks by searching for 4 or more probes whose signals are above the specified cutoff values, ranging from 90% to 15%, using a 500-bp sliding window. If there are fewer than 4 probes per window, NimbleScan software searches for 3 then 2 probes in the window (with 2 being the minimum). The cutoff values are a percentage of a hypothetical maximum, which is the mean +6 (SD). The ratio data are then randomized 20 times to evaluate the probability of “false positive.” Each peak is then assigned an FDR score based on the randomization. Peaks with an FDR score ≤ 0.05 often represent the highest-confidence protein binding sites. Peaks with an FDR score between 0.05 and 0.2 are also indicative of a binding site. Peaks with an FDR score > 0.2 are generally not considered high-confidence binding sites. In this study, we used an FDR score ≤ 0.1 as the cutoff for AE9a binding site identification.
Plasmids
MSCV-IRES-EGFP (MigR1), MSCV-IRES-puromycin (MIP), MigR1-HA-AML1-ETO, MIP-HA-AML1-ETO, MigR1-HA-AE9a, MIP-HA-AE9a, and MIP-HA-AE9a-R174Q were previously described.20,27 The mouse CD45.2 ORF clone in the pENTR223.1 vector (clone ID: 100068112) was purchased from Open Biosystems. Then an SfiI-SfiI fragment containing the CD45.2 ORF was blunt-ended and cloned into the HpaI site of MIP to generate MIP-CD45.2. MSCV-CD45.2 and MSCV-CD45.2 ΔC were constructed by replacing the internal ribosome entry site–enhanced green fluorescent protein (IRES-EGFP) sequence of MigR1 via the BglII/SalI sites with the full-length CD45.2 and the truncated CD45.2 lacking the C-terminal phosphatase domains, respectively, amplified from MIP-CD45.2 by PCR. MSCV-CD45.1 was generated by replacing the XhoI/ApaI fragment of MSCV-CD45.2 with CD45.1-specific sequences amplified by PCR from bone marrow cDNA of Pep3 mice. The MSCVneo-NUP98-NSD1-3× Flag and MSCVneo-Flag-MEIS1-IRES-HOXA9 retroviral constructs were kindly provided by Dr Mark Kamps (University of California, San Diego, CA).28
AE9a/CD45 coexpression for serial replating assays and bone marrow transplantation
Fetal liver cells (embryonic day 14.5) or bone marrow lineage negative cells from MF-1 or C57BL/6 mice were transduced with retroviruses expressing MigR1-AE9a or coexpressing MigR1-AE9a and MSCV-CD45.1. EGFP+ and EGFP+/CD45.1+ cells were sorted by fluorescence-activated cell sorter (FACS), respectively, and cultured in methylcellulose media for serial replating assays (MethoCult GF M3434; StemCell Technologies) at 7-day intervals. AML1-ETO experiments were done in the same way with the MigR1-HA-AML1-ETO construct. For bone marrow transplantation, EGFP+ and EGFP+/CD45.1+ fetal liver cells sorted by FACS were injected into lethally irradiated (700 rads) MF-1 mice. Each mouse received 1 × 10⁴ sorted cells and 9 × 10⁵ uninfected fetal liver cells via tail vein.
Expressing CD45 in human leukemia cell lines
U937, K562, and Kasumi-1 cells were infected with MIP or MIP-CD45.2 retroviruses. U937 and K562 cells were selected with 2 μg/mL puromycin for 4 days and then expanded for cell-growth curve, apoptosis, and cell-cycle analyses. A stable Kasumi-1 cell line expressing MIP-CD45.2 could not be generated even after several attempts. Therefore, after infection Kasumi-1 cells were selected with 2 μg/mL puromycin for 3 days and then dead cells were removed by Ficoll gradient centrifugation. Live cells were cultured in media or first stained with 1μM carboxyfluorescein diacetate succinimidyl ester (CFSE; Invitrogen) before culture. An aliquot of CFSE-stained cells were fixed in 0.2% paraformaldehyde solution (Sigma-Aldrich) in PBS, and stored at 4°C for the subsequent cell proliferation analysis (0 hour). After 40 to 42 hours, CFSE-stained cells were collected and the CFSE fluorescence intensity was measured by flow cytometry. The unstained cells were collected for apoptosis assays using annexin V–phycoerythrin staining.
Results
Gene expression and promoter occupancy profiling of primary AE9a leukemia cells
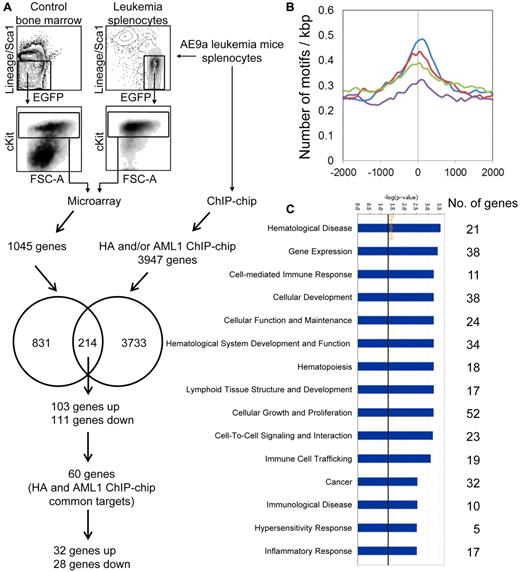
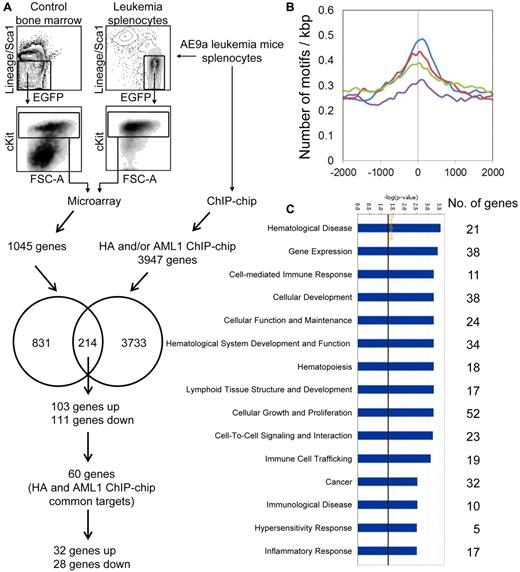
Abnormal gene regulation by DNA-binding AML1-ETO fusion transcription factors plays a key role in t(8;21) leukemia.29 To understand the molecular basis of disease development by identifying genes directly regulated by the leukemogenic AE9a fusion protein, we performed gene expression microarray and ChIP-chip profiling of the major leukemia cell population (Lin−/Sca1−/cKit+ or LK) using 3 independent sets of control and leukemia samples (Figure 1A). LK cells have a significantly faster leukemia-initiating capability than Lin−/Sca1+/cKit+ (LSK) cells (supplemental Figure 1, P < .0001, log-rank test) and were therefore chosen for this study. Expression of 1045 genes were dysregulated ≥ 1.5-fold in AE9a LK cells, with 337 up-regulated and 486 down-regulated by at least 2-fold (P < .001, 2-sample t test; supplemental Table 1). Among these genes, 195 were also found to be dysregulated in AML1-ETO–transduced human hematopoietic cells30-32 or t(8;21) AML blasts33,34 (supplemental Table 2). Among the up-regulated genes are positive cell-cycle regulators, such as Ccnb1, Ccnd2, and Cdc25b. Several antiapoptotic genes including Birc6 and protein kinase C family members Prkca, Prkce, and Prkcq are up-regulated, whereas several proapoptotic genes, including Map3k5 and tumor necrosis factor receptor superfamily members Tnfrsf1a, Tnfrsf1b, Tnfrsf7, and Tnfrsf12a are down-regulated. These results indicate that AE9a leukemia cells have both increased cell-cycle and enhanced cell survival signaling. In addition, genes that control commitment decisions and maturation of hematopoietic stem cells toward the granulocytic lineage, including Gfi1, Csf3r, Hck, and C/EBP family members Cebpa, Cebpb, and Cebpd, are down-regulated, suggesting a defect in cell differentiation.
Microarray and ChIP-chip analyses of murine AE9a leukemia cells. (A) Microarray and ChIP-chip analyses of AE9a leukemia cells. The LK cells of AE9a leukemia spleen and wild-type bone marrow from 3 independent sets of mice were sorted by FACS for microarray analysis. The leukemia splenocytes were also subjected to ChIP-chip analysis (HA, AML1, and IgG). The microarray and ChIP-chip (HA and/or AML1) target genes were compared. The numbers in circles indicate the number of microarray-only targets (831), ChIP-chip-only targets (3733), and their common targets (214), from which the 60 HA and AML1 ChIP-chip common targets are considered as top candidates for AE9a direct target genes. (B) AML1 motif (V$AML_Q6 from TRANSFAC database) density curves for the top 1000 HA only peaks (green), top 1000 AML1 only peaks (blue), top 1000 IgG only peaks (purple), and the 781 HA and AML1 overlapped peaks (red; see supplemental Figure 2A). The x-axis shows the distance (in bp) from center of peaks, which is indicated as zero. The y-axis represents the number of motifs per kbp. (C) Top biologic functions of the 214 microarray and ChIP-chip common targets. The numbers to the right represent the number of genes involved in various biologic functions. The −log(P value) axis means the significance of the functions to the dataset.
Microarray and ChIP-chip analyses of murine AE9a leukemia cells. (A) Microarray and ChIP-chip analyses of AE9a leukemia cells. The LK cells of AE9a leukemia spleen and wild-type bone marrow from 3 independent sets of mice were sorted by FACS for microarray analysis. The leukemia splenocytes were also subjected to ChIP-chip analysis (HA, AML1, and IgG). The microarray and ChIP-chip (HA and/or AML1) target genes were compared. The numbers in circles indicate the number of microarray-only targets (831), ChIP-chip-only targets (3733), and their common targets (214), from which the 60 HA and AML1 ChIP-chip common targets are considered as top candidates for AE9a direct target genes. (B) AML1 motif (V$AML_Q6 from TRANSFAC database) density curves for the top 1000 HA only peaks (green), top 1000 AML1 only peaks (blue), top 1000 IgG only peaks (purple), and the 781 HA and AML1 overlapped peaks (red; see supplemental Figure 2A). The x-axis shows the distance (in bp) from center of peaks, which is indicated as zero. The y-axis represents the number of motifs per kbp. (C) Top biologic functions of the 214 microarray and ChIP-chip common targets. The numbers to the right represent the number of genes involved in various biologic functions. The −log(P value) axis means the significance of the functions to the dataset.
The binding profile of HA-tagged AE9a in leukemia cells was investigated through ChIP-chip assays with anti-HA, anti-AML1 and IgG (negative control) using the NimbleGen 385K mouse MM5 condensed tiling array. A total of 4656 HA and/or AML1 specific binding sites (peaks) representing 3947 unique genes were identified using the NimbleScan software (FDR ≤ 0.1; supplemental Figure 2A). To validate the ChIP-chip assays, we performed an AML1 motif search (V$AML_Q6 from TRANSFAC database) in the vicinity of peaks using MAST program with a threshold P < .0005 and found AML1 sites enriched in the target (anti-HA and anti-AML1) versus control (IgG) peaks (P ≤ 1.37 × 10⁻¹², binomial test), demonstrating the accuracy of the assays (Figure 1B). To further investigate AE9a target peaks, we performed searches around the peaks for more than 1400 transcription factor motifs available in the TRANSFAC and JASPAR databases. Many motifs were also enriched in the peaks, including those for ETS1, SP1, AP2, ERF2, ZNF219, and WT1 (supplemental Figure 2B; data not shown). Some of these are known AML1 and AML1-ETO interacting transcription factors.35,36 These transcription factors may cooperate with AML1 and/or AML1-ETO fusion proteins in target gene regulation.
Cross-comparison between gene expression and ChIP-chip data identified 214 AE9a dysregulated genes with AE9a binding in their regulatory regions, of which 103 were up-regulated and 111 were down-regulated (Figure 1A; supplemental Table 3). These are putative AE9a direct targets, among which 60 were enriched in both HA and AML1 ChIP-chip assays. The biologic functions of the 214 AE9a direct targets were analyzed using Ingenuity Pathway Analysis (IPA). The top functions associated with these genes include hematological disease, gene expression, cellular development, hematological system development and function, cellular growth and proliferation, cell-to-cell signaling and interaction, and cancer (Figure 1C; supplemental Table 4).
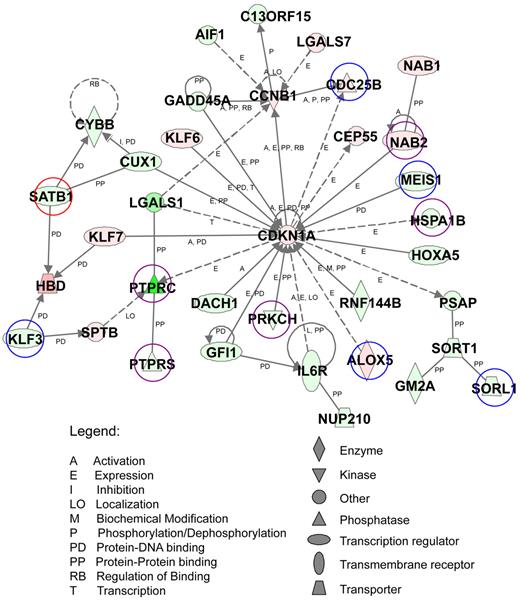
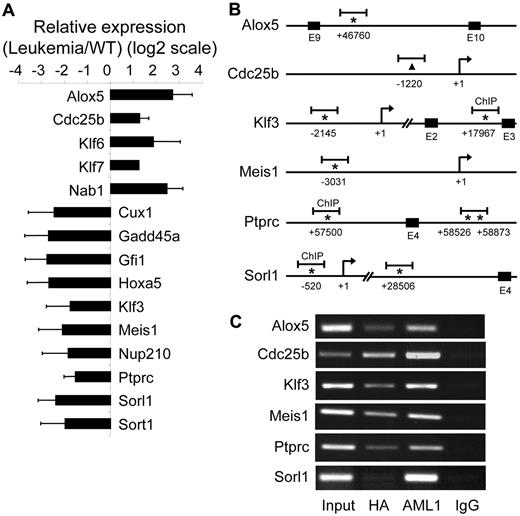
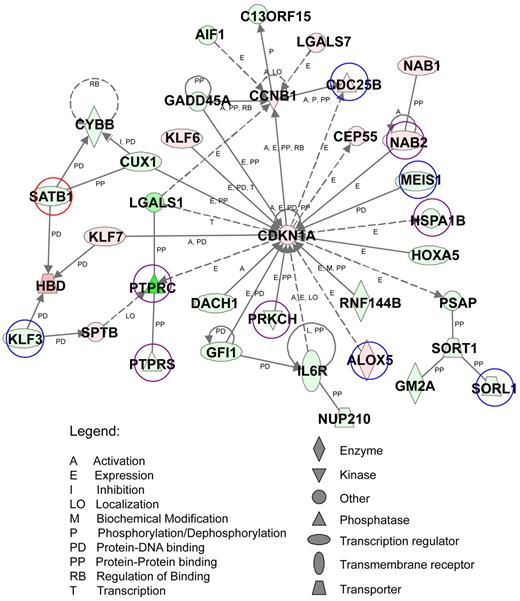
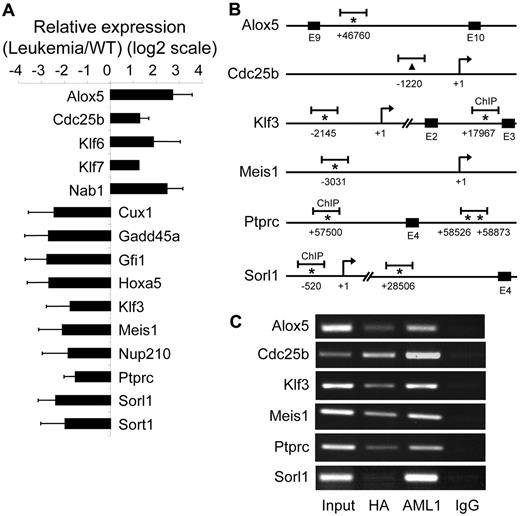
We next performed pathway analysis of AE9a dysregulated genes with at least a 2-fold change (823 genes) from the microarray study using IPA against a global molecular network developed from information contained in the Ingenuity knowledge base (data not shown). One of the top-scoring networks contains 35 AE9a dysregulated genes that function in hematopoiesis, cell-cycle, cancer, and cell death (Figure 2). Among these genes, 11 are also ChIP-chip targets. Using reverse transcription-quantitative PCR (RT-qPCR), we examined the expression of 15 genes in this network and confirmed their dysregulation (Figure 3A). Furthermore, most of the 11 putative AE9a direct targets have 1 or more perfect AML1 consensus sites (TGT/cGGT) within or in the proximity of the ChIP-chip peaks (Figure 3B; data not shown). We analyzed AE9a binding in 6 of these genes by ChIP-PCR using anti-HA, anti-AML1, and IgG antibodies and confirmed the specific binding (Figure 3C). Although 5 sites were detected only in the original anti-HA, but not in the original anti-AML1 ChIP-chip analysis, they were specifically immunoprecipitated by the anti-AML1 antibody.
Functional analysis of the top-scoring network of AE9a dysregulated genes. AE9a dysregulated genes with at least a 2-fold change (823 genes) were analyzed using Ingenuity Pathway Analysis. A top-scoring network is shown here. The network consists of 35 genes, whose functions involve the regulation of hematopoiesis, cell-cycle, cancer, and cell death. These genes are represented as nodes with their shape indicating the functional class of the gene product (shown at bottom right). The biologic relationship between 2 nodes is represented as a line, solid being direct and dashed being indirect relationship (see legends at bottom left). The intensity of the node color indicates the degree of up (red) or down (green) regulation. Genes marked with circles are also target genes of ChIP-chip assays. Blue: HA only targets. Red: AML1 only targets. Purple: HA and AML1 common targets.
Functional analysis of the top-scoring network of AE9a dysregulated genes. AE9a dysregulated genes with at least a 2-fold change (823 genes) were analyzed using Ingenuity Pathway Analysis. A top-scoring network is shown here. The network consists of 35 genes, whose functions involve the regulation of hematopoiesis, cell-cycle, cancer, and cell death. These genes are represented as nodes with their shape indicating the functional class of the gene product (shown at bottom right). The biologic relationship between 2 nodes is represented as a line, solid being direct and dashed being indirect relationship (see legends at bottom left). The intensity of the node color indicates the degree of up (red) or down (green) regulation. Genes marked with circles are also target genes of ChIP-chip assays. Blue: HA only targets. Red: AML1 only targets. Purple: HA and AML1 common targets.
Validation of AE9a target genes. (A) RT-qPCR confirmation of 15 AE9a dysregulated genes shown in Figure 2. GAPDH (glyceraldehyde-3-phosphate dehydrogenase) was used for normalization. (B) Schematics showing the locations of ChIP-chip peaks (short horizontal bars) in 6 potential AE9a direct target genes. The positions of the predicted transcription initiation sites (arrows) and consensus AML1 sites (TGT/cGGT; asterisks) are indicated. The numbers mean the positions relative to the transcription initiation site (+1). For Cdc25b, an AML1 consensus site is not found near the peak; therefore, the center of the peak is indicated with a triangle. E indicates exon. (C) ChIP assays. ChIP was performed using rabbit–anti-HA, rabbit–anti-AML1, and rabbit-IgG control antibodies, followed by PCR amplification of the ChIP-chip peak regions indicated in panel B.
Validation of AE9a target genes. (A) RT-qPCR confirmation of 15 AE9a dysregulated genes shown in Figure 2. GAPDH (glyceraldehyde-3-phosphate dehydrogenase) was used for normalization. (B) Schematics showing the locations of ChIP-chip peaks (short horizontal bars) in 6 potential AE9a direct target genes. The positions of the predicted transcription initiation sites (arrows) and consensus AML1 sites (TGT/cGGT; asterisks) are indicated. The numbers mean the positions relative to the transcription initiation site (+1). For Cdc25b, an AML1 consensus site is not found near the peak; therefore, the center of the peak is indicated with a triangle. E indicates exon. (C) ChIP assays. ChIP was performed using rabbit–anti-HA, rabbit–anti-AML1, and rabbit-IgG control antibodies, followed by PCR amplification of the ChIP-chip peak regions indicated in panel B.
Expression levels of AE9a direct targets in AML patients
To gain insight into the potential clinical relevance of these 214 AE9a direct targets, we analyzed their expression levels in a published large-scale human AML profiling study37,38 through Oncomine (Compendia Bioscience). Approximately 30% of these genes show t(8;21)-specific up or down-regulation in the same direction as in AE9a leukemia mice compared with AML with other karyotypes, including 19 of 60 AE9a targets that were enriched in both HA and AML1 ChIP-chip assays mentioned in the previous section (supplemental Table 3). The expression of these 19 genes was further analyzed between t(8;21) and non-t(8,21) AML-M2 patients (supplemental Figures 3-4), and 18 showed a statistically significant difference between the 2 patient groups (P < .05, Student t test).
The 19 genes that are dysregulated in both human t(8;21) AML and mouse AE9a AML, and are bound by AE9a in ChIP-chip assays are considered as the top candidates that are directly regulated by AE9a fusion protein and may play important roles in leukemogenesis. For further studies in this report, we decided to focus on Ptprc, also known as Cd45, as it was down-regulated significantly in the microarray and RT-qPCR analyses (supplemental Table 1; Figure 3A), is 1 of the 19 top candidates of AE9a direct targets, and is in the top-scoring pathway analysis network (Figure 2). Furthermore, CD45 is a transmembrane protein tyrosine phosphatase involved in the negative regulation of cytokine/growth factor receptor and JAK/STAT signaling.21-23 Therefore, the down-regulation of CD45 may lead to enhanced JAK/STAT signaling, which is implicated in myeloid and lymphoid hematologic malignancies.39
Ptprc (Cd45) is a direct target gene of AE9a
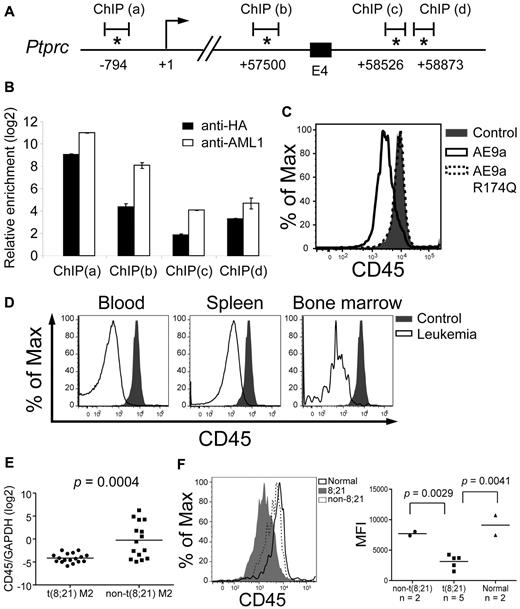
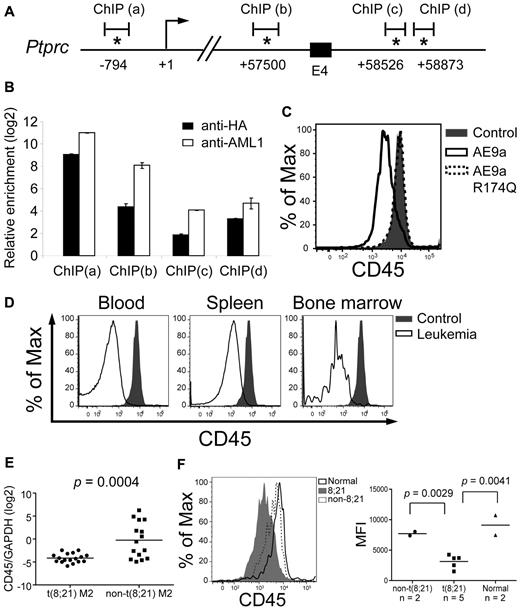
The ChIP-chip assays identified 3 peaks in the Cd45 gene, located in promoter, intron 3 and intron 4, respectively (Figure 4A). The consensus AML1 motif (TGT/CGGT) is found within or near the peaks (Figure 4A). In addition to the ChIP result in Figure 3C, quantitative ChIP assays with anti-HA and anti-AML1 antibodies showed significant enrichment of the regions encompassing the AML1 motif relative to an arbitrary control region without the AML1 motif (Figure 4B).
CD45 is down-regulated in AE9a leukemia mice and t(8;21) AML patients. (A) A schematic showing part of the mouse Cd45 gene. The positions of the predicted transcription initiation site (arrow) and consensus AML1 sites (asterisks) are indicated. Numbers indicate the positions relative to the transcription initiation site (+1). E4: exon 4. ChIP(a), (b), (c), and (d) are the regions analyzed by qPCR in panel B. (B) Quantitative PCR analysis of the regions containing the consensus AML1 sites indicated in panel A after anti-HA and anti-AML1 ChIP assays. The y-axis shows the relative enrichment level over an arbitrary negative control region (see “ChIP and ChIP-chip assays” and the confirmation section of the supplemental Methods). Input DNA was used for normalization. (C) Flow cytometric analysis of CD45 in EML cells expressing AE9a, AE9a-R174Q, and MIP. (D) Flow cytometric analysis of CD45 within the LK population of wild-type bone marrow and AE9a leukemia blood, spleen, and bone marrow. CD45 expression of blood, spleen, and bone marrow samples from AE9a leukemia mice were compared with that of bone marrow cells from wild-type mice. Representative results from 3 leukemia and 3 wild-type mice are shown. (E) RT-qPCR analysis of CD45 expression relative to GAPDH of each individual t(8;21) AML-M2 (n = 17, dot) and non-t(8,21) AML-M2 (n = 15, square) patient. The bar indicates the mean expression level of each patient group. The P value was determined using Student t test. (F) Flow cytometric analysis of CD45 within the primitive stem/progenitor (CD33−/CD38−/CD71−/CD34+) population of t(8;21) AML-M2 blood samples (n = 5), non-t(8,21) AML-M2 blood samples (n = 2), and normal bone marrow samples (n = 2). (Left panel) Representative histograms from each patient group are shown. (Right panel) A dot plot showing the CD45 MFI of each patient. The bar indicates the mean value of each patient group. The P values were determined using Student t test.
CD45 is down-regulated in AE9a leukemia mice and t(8;21) AML patients. (A) A schematic showing part of the mouse Cd45 gene. The positions of the predicted transcription initiation site (arrow) and consensus AML1 sites (asterisks) are indicated. Numbers indicate the positions relative to the transcription initiation site (+1). E4: exon 4. ChIP(a), (b), (c), and (d) are the regions analyzed by qPCR in panel B. (B) Quantitative PCR analysis of the regions containing the consensus AML1 sites indicated in panel A after anti-HA and anti-AML1 ChIP assays. The y-axis shows the relative enrichment level over an arbitrary negative control region (see “ChIP and ChIP-chip assays” and the confirmation section of the supplemental Methods). Input DNA was used for normalization. (C) Flow cytometric analysis of CD45 in EML cells expressing AE9a, AE9a-R174Q, and MIP. (D) Flow cytometric analysis of CD45 within the LK population of wild-type bone marrow and AE9a leukemia blood, spleen, and bone marrow. CD45 expression of blood, spleen, and bone marrow samples from AE9a leukemia mice were compared with that of bone marrow cells from wild-type mice. Representative results from 3 leukemia and 3 wild-type mice are shown. (E) RT-qPCR analysis of CD45 expression relative to GAPDH of each individual t(8;21) AML-M2 (n = 17, dot) and non-t(8,21) AML-M2 (n = 15, square) patient. The bar indicates the mean expression level of each patient group. The P value was determined using Student t test. (F) Flow cytometric analysis of CD45 within the primitive stem/progenitor (CD33−/CD38−/CD71−/CD34+) population of t(8;21) AML-M2 blood samples (n = 5), non-t(8,21) AML-M2 blood samples (n = 2), and normal bone marrow samples (n = 2). (Left panel) Representative histograms from each patient group are shown. (Right panel) A dot plot showing the CD45 MFI of each patient. The bar indicates the mean value of each patient group. The P values were determined using Student t test.
To confirm the regulation of CD45 by AE9a, we expressed AE9a in EML cells, a stem cell factor-dependent murine hematopoietic stem/progenitor cell line, and showed that CD45 mRNA and surface expression measured by mean fluorescence intensity (MFI) on a flow cytometer were decreased by 40% and 62%, respectively (Figure 4C; data not shown). When AE9a-R174Q, a DNA-binding mutant,40,41 was introduced into EML cells, CD45 expression was similar to that of control cells (Figure 4C; data not shown), demonstrating the importance of the DNA-binding activity of AE9a in CD45 regulation. These results indicate that AE9a binds Cd45 regulatory elements and that the down-regulation of CD45 by AE9a requires its DNA-binding activity. Furthermore, the full-length AML1-ETO protein also down-regulated CD45 expression (supplemental Figure 5A).
CD45 is down-regulated in AE9a leukemia mice and t(8;21) AML patients
Down-regulation of CD45 in LK cells of AE9a leukemia mice was confirmed by checking its transcript levels by RT-qPCR (2- to 5-fold reduction) and cell-surface expression (MFI) by flow cytometry (5 to 10-fold reduction; Figures 3A and 4D). To correlate these findings with the clinical setting, we examined CD45 mRNA levels in t(8;21) (n = 17) and non-t(8,21) (n = 15) AML-M2 patient samples by RT-qPCR and showed that t(8;21) patients had a > 90% reduction of CD45 mRNA compared with non-t(8,21) patients (P = .0004, Student t test; Figure 4E). In addition, published human AML profiling data37,38,42 also revealed reduced CD45 expression in t(8;21) AML (supplemental Figure 4). The 8;21 translocation is detected in hematopoietic stem cells,43 making this population the most important target for eradicating the disease. We observed 40%-80% decreased cell surface expression (MFI) of CD45 in the primitive stem/progenitor population (CD33−/CD38−/CD71−/CD34+)44 of t(8;21) patients (n = 5) compared with the same population in non-t(8,21) [n = 2] or normal bone marrow samples (n = 2; P ≤ .005, Student t test; Figure 4F, data not shown).
AML1-ETO is known to recruit histone deacetylases (HDACs) through NCoR/SMRT to repress gene expression. To further investigate the mechanism of CD45 down-regulation, we treated the human t(8;21) AML derived cell lines Kasumi-1 and SKNO-1 with the HDAC inhibitors trichostatin A (TSA) and valproic acid (VPA) for 24 hours and observed increased CD45 expression (supplemental Figure 6A-B). Contrarily, the same doses of TSA and VPA did not increase CD45 expression in the t(8;21)–negative myeloid leukemia cell lines U937 and K562 (supplemental Figure 6C; data not shown). The DNA demethylating agent decitabine (DAC) also increased CD45 levels in Kasumi-1 and SKNO-1 but not U937 or K562 after 48-hour treatment (supplemental Figure 6; data not shown).
Enhanced JAK/STAT signaling in AE9a leukemia cells
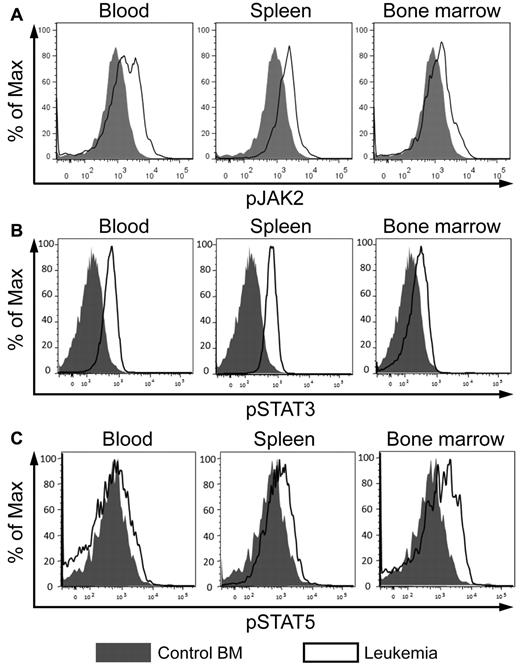
CD45 is highly expressed in all hematopoietic lineages at all stages of development and plays a key role in antigen receptor signaling in T and B cells.21 In addition, CD45 functions as a hematopoietic JAK phosphatase, negatively regulating cytokine-mediated activation of JAK/STAT signaling.22 As described in the previous 2 sections, CD45 is down-regulated by AE9a and AML1-ETO, and in both AE9a leukemia mice and t(8;21)–positive AML patients. Therefore, we examined whether JAK/STAT signaling is affected in AE9a leukemia cells. We observed a higher level of phosphorylated JAK2 in AE9a leukemia cells than in control bone marrow cells (Figure 5A). In addition, the level of phosphorylated STAT3 in AE9a leukemia cells was higher than that in control cells (Figure 5B). Although the level of phosphorylated STAT5 in unstimulated AE9a leukemia cells and control bone marrow cells was very low and indistinguishable (data not shown), it showed a greater increase in leukemia cells than in control cells on stimulation with cytokines (Figure 5C). These results suggest that AE9a leukemia cells have enhanced JAK/STAT signaling and are more responsive to cytokine stimulation.
JAK/STAT signaling is enhanced in AE9a leukemia cells. (A) Flow cytometric analyses of phosphorylated JAK2 (pY1007/1008), (B) STAT3 (pY705), and (C) STAT5 (pY694) in the Lin−/cKit+ population of wild-type bone marrow and AE9a leukemia blood, spleen, and bone marrow. Phosphorylated STAT5 was detected after stimulation with cytokines (100 ng/mL Flt3 ligand, 100 ng/mL stem cell factor, 20 ng/mL IL-3, 20 ng/mL IL-6, and 20 ng/mL G-CSF) for 15 minutes. Representative results from 6 wild-type samples and 7 leukemia mice are shown.
JAK/STAT signaling is enhanced in AE9a leukemia cells. (A) Flow cytometric analyses of phosphorylated JAK2 (pY1007/1008), (B) STAT3 (pY705), and (C) STAT5 (pY694) in the Lin−/cKit+ population of wild-type bone marrow and AE9a leukemia blood, spleen, and bone marrow. Phosphorylated STAT5 was detected after stimulation with cytokines (100 ng/mL Flt3 ligand, 100 ng/mL stem cell factor, 20 ng/mL IL-3, 20 ng/mL IL-6, and 20 ng/mL G-CSF) for 15 minutes. Representative results from 6 wild-type samples and 7 leukemia mice are shown.
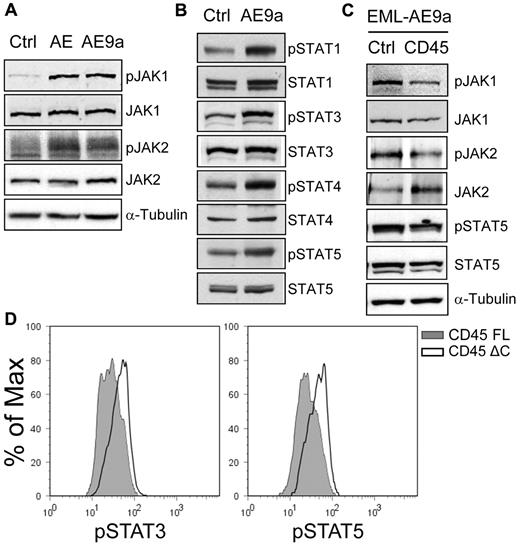
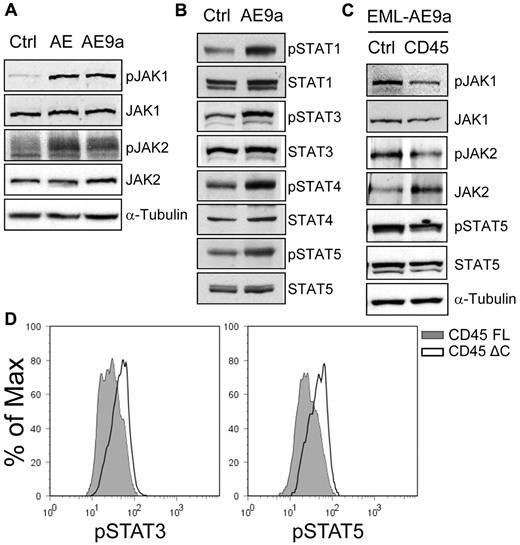
We also detected increased phosphorylation of JAK1, JAK2, and multiple STAT proteins in EML cells expressing AML1-ETO or AE9a (Figure 6A-B; supplemental Figure 5A-B). STAT activation requires DNA binding activity of the Runt domain (data not shown). Importantly, when unrelated leukemogenic proteins, NUP98-NSD1 and HOXA9+MEIS1, were expressed in EML cells, neither CD45 down-regulation nor enhanced STAT phosphorylation was observed (supplemental Figure 5C-D). Furthermore, CD45 expression resulted in decreased phosphorylation of JAK1, JAK2, and STAT5 in EML-AE9a cells (Figure 6C) and decreased phosphorylation of STAT3 and STAT5 in a primary AEtr leukemia-derived cell line (Figure 6D).19 Consistent with their effect on CD45 de-repression, the HDAC inhibitors TSA and VPA, and the DNA methyltransferase (DNMT) inhibitor DAC attenuated STAT3 and STAT5 activation on cytokine stimulation in SKNO-1 cells (supplemental Figure 7).
Expression of CD45 attenuates JAK/STAT activation. (A) Western blot analyses of JAK1, phosphorylated JAK1 (pY1022/1023), JAK2 and phosphorylated JAK2 (pY1007/1008) in EML cells expressing AML1-ETO, AE9a, and the MIP control. (B) Western blot analyses of STAT1, STAT3, STAT4, STAT5, and their phosphorylated forms (pY701, pY705, pY693, and pY694, respectively) in EML cells expressing AE9a and the MIP control. (C) Western blot analyses of JAK1, JAK2, STAT5, and their phosphorylated forms (pY1022/1023, pY1007/1008, and pY694, respectively) in EML-MigR1-AE9a cells expressing CD45 and the MIP control. Phosphorylated JAK2 was detected after JAK2 immunoprecipitation. (D) Flow cytometric analyses of phosphorylated STAT3 (pY705; left panel) and STAT5 (pY694; right panel) in the AEtr leukemia cell line expressing the full-length CD45.2 (CD45 FL) or a C-terminally truncated CD45.2 lacking the phosphatase domains (CD45 ΔC). The CD45.2+ cells were gated for analysis.
Expression of CD45 attenuates JAK/STAT activation. (A) Western blot analyses of JAK1, phosphorylated JAK1 (pY1022/1023), JAK2 and phosphorylated JAK2 (pY1007/1008) in EML cells expressing AML1-ETO, AE9a, and the MIP control. (B) Western blot analyses of STAT1, STAT3, STAT4, STAT5, and their phosphorylated forms (pY701, pY705, pY693, and pY694, respectively) in EML cells expressing AE9a and the MIP control. (C) Western blot analyses of JAK1, JAK2, STAT5, and their phosphorylated forms (pY1022/1023, pY1007/1008, and pY694, respectively) in EML-MigR1-AE9a cells expressing CD45 and the MIP control. Phosphorylated JAK2 was detected after JAK2 immunoprecipitation. (D) Flow cytometric analyses of phosphorylated STAT3 (pY705; left panel) and STAT5 (pY694; right panel) in the AEtr leukemia cell line expressing the full-length CD45.2 (CD45 FL) or a C-terminally truncated CD45.2 lacking the phosphatase domains (CD45 ΔC). The CD45.2+ cells were gated for analysis.
Negative effects of CD45 expression on t(8;21) leukemia cells
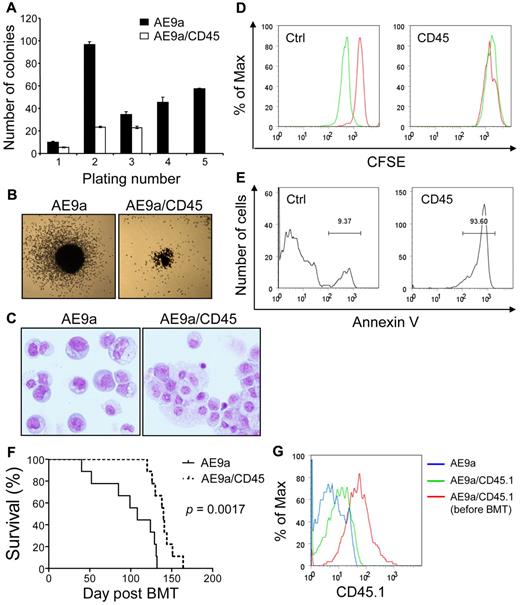
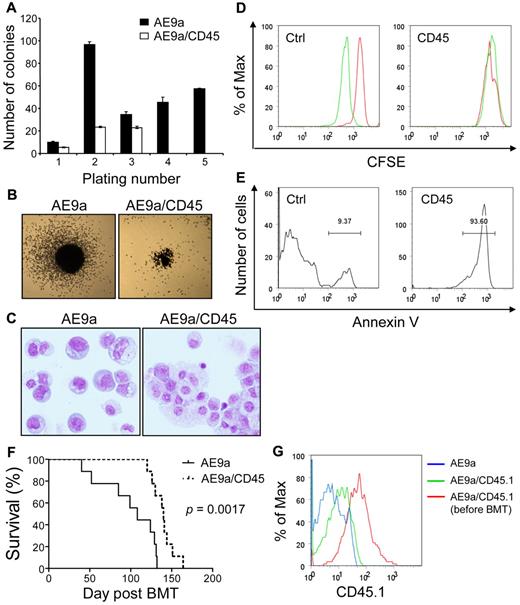
Similar to AML1-ETO, AE9a also enhances the self-renewal capacity of hematopoietic stem/progenitor cells.45 We assessed the effects of increased CD45 expression on AE9a enhanced self-renewal capacity of primary murine hematopoietic stem/progenitor cells in serial replating assays. AE9a strongly enhanced replating ability of hematopoietic cells (Figure 7A; data not shown). Cells coexpressing AE9a and CD45 displayed 30%-80% reduced numbers of colonies in the first 3 platings and exhausted their clonogenic capacity at the fourth plating (Figure 7A; data not shown). In addition, the colonies generated by AE9a/CD45-coexpressing cells were smaller than those generated by AE9a-expressing cells (Figure 7B). After the third plating, AE9a-expressing cells were primarily immature myeloid cells, whereas the majority of AE9a/CD45-coexpressing cells showed more differentiated morphology (Figure 7C). Attenuation of colony-forming activity by CD45 coexpression was also observed in AML1-ETO–expressing cells (data not shown). Furthermore, forced expression of CD45 significantly reduced or abolished the clonogenic capacity of AE9a and AML1-ETO transformed cells (ie, cells from the third plating and beyond; supplemental Figure 8A). Contrarily, CD45 expression did not significantly reduce the number of colonies from HOXA9 and MEIS1 cotransduced or transformed cells, although it decreased the size of colonies (supplemental Figure 8B-C).
Negative effects of CD45 expression on t(8;21) leukemia cells and AE9a leukemogenesis. (A) Serial replating of fetal liver cells transduced with AE9a or AE9a/CD45. The y-axis represents the average number of colonies with SD of duplicates per 103 (plating number 1) or 104 (plating numbers 2 to 5) cells plated. Cells transduced with AE9a/CD45 had no colonies at the fourth and fifth platings. Similar results were obtained from 2 independent experiments with bone marrow Lin− cells. (B) Typical third-plating colony morphology of fetal liver cells transduced with the indicated retroviruses. Images were taken at room temperature using Nikon Eclipse TS100 microscope with the 2×/0.06 objective lens, Nikon DS-Fi1 digital camera and Nikon DS Camera Control Unit DS-U2 system (Nikon). (C) Wright-Giemsa staining of fetal liver cells transduced with the indicated retroviruses from the third plating. The AE9a picture is a montage of cells because of the low cell density on the cytospin slide. Images were taken at room temperature using Olympus BX51 microscope with the 20×/0.5 objective lens, the DP71 digital camera and the DP-BSW acquisition software (Olympus). (D) Kasumi-1 cells transduced with murine CD45 or the MIP control vector were labeled with CFSE and cultured for 42 hours. The acetate groups of CFSE are cleaved by intracellular esterases to yield the highly fluorescent carboxyfluorescein succinimidyl ester. The intensity of CFSE fluorescence decreases as cells undergo cell divisions. Cells were fixed in 0.2% paraformaldehyde immediately after labeling (red histograms) or after 42 hours of culture (green histograms) for flow cytometry. A clear reduction of CFSE fluorescence intensity was observed in the MIP transduced cells after 42 hours of culture, indicating that the cells had undergone cell divisions (left panel). However, the CFSE fluorescence intensity in the CD45 transduced Kasumi-1 cells remained the same after 42 hours of culture (right panel). (E) Annexin V staining of CD45 or MIP transduced Kasumi-1 cells after 42 hours of culture. The majority of CD45 transduced cells are positive for annexin V. (F) Survival curves showing the lifespan of MF-1 mice transplanted with AE9a (n = 9) or AE9a/CD45.1 (n = 9) transduced fetal liver cells. The P value was calculated using log-rank test. (G) The intensity of CD45.1 in leukemia cells from blood of 1 representative AE9a (antibody background staining; blue histogram) and 1 representative AE9a/CD45.1 (green histogram) leukemia mice at 12 weeks after transplantation compared with that in AE9a/CD45.1 transduced fetal liver cells right after sorting (red histogram).
Negative effects of CD45 expression on t(8;21) leukemia cells and AE9a leukemogenesis. (A) Serial replating of fetal liver cells transduced with AE9a or AE9a/CD45. The y-axis represents the average number of colonies with SD of duplicates per 103 (plating number 1) or 104 (plating numbers 2 to 5) cells plated. Cells transduced with AE9a/CD45 had no colonies at the fourth and fifth platings. Similar results were obtained from 2 independent experiments with bone marrow Lin− cells. (B) Typical third-plating colony morphology of fetal liver cells transduced with the indicated retroviruses. Images were taken at room temperature using Nikon Eclipse TS100 microscope with the 2×/0.06 objective lens, Nikon DS-Fi1 digital camera and Nikon DS Camera Control Unit DS-U2 system (Nikon). (C) Wright-Giemsa staining of fetal liver cells transduced with the indicated retroviruses from the third plating. The AE9a picture is a montage of cells because of the low cell density on the cytospin slide. Images were taken at room temperature using Olympus BX51 microscope with the 20×/0.5 objective lens, the DP71 digital camera and the DP-BSW acquisition software (Olympus). (D) Kasumi-1 cells transduced with murine CD45 or the MIP control vector were labeled with CFSE and cultured for 42 hours. The acetate groups of CFSE are cleaved by intracellular esterases to yield the highly fluorescent carboxyfluorescein succinimidyl ester. The intensity of CFSE fluorescence decreases as cells undergo cell divisions. Cells were fixed in 0.2% paraformaldehyde immediately after labeling (red histograms) or after 42 hours of culture (green histograms) for flow cytometry. A clear reduction of CFSE fluorescence intensity was observed in the MIP transduced cells after 42 hours of culture, indicating that the cells had undergone cell divisions (left panel). However, the CFSE fluorescence intensity in the CD45 transduced Kasumi-1 cells remained the same after 42 hours of culture (right panel). (E) Annexin V staining of CD45 or MIP transduced Kasumi-1 cells after 42 hours of culture. The majority of CD45 transduced cells are positive for annexin V. (F) Survival curves showing the lifespan of MF-1 mice transplanted with AE9a (n = 9) or AE9a/CD45.1 (n = 9) transduced fetal liver cells. The P value was calculated using log-rank test. (G) The intensity of CD45.1 in leukemia cells from blood of 1 representative AE9a (antibody background staining; blue histogram) and 1 representative AE9a/CD45.1 (green histogram) leukemia mice at 12 weeks after transplantation compared with that in AE9a/CD45.1 transduced fetal liver cells right after sorting (red histogram).
To further address the importance of CD45 down-regulation in t(8;21) leukemia cell growth and survival, we examined the effect of CD45 expression on human leukemia cells. Because of the limited availability of primary human t(8;21) AML cells and the technical difficulty of their culture and transduction, we performed in vitro assays with human myeloid leukemia cell lines U937, K562, and Kasumi-1. Expression of CD45 did not affect growth of the 2 t(8;21)–negative cell lines U937 and K562 (supplemental Figure 9). However, expressing CD45 in the t(8;21)–positive cell line Kasumi-1 resulted in growth arrest (Figure 7D) and more than 90% of cells were positive for the apoptosis marker annexin V (Figure 7E). Similarly, expression of CD45 caused cell differentiation and apoptosis in the AEtr leukemia cell line (data not shown). Taken together, these results demonstrate that CD45 expression compromises the ability of t(8;21) fusion proteins to enhance the growth and survival of t(8;21) AML cells, and suggest that down-regulation of CD45 contributes to t(8;21) leukemogenesis.
Coexpression of CD45 delays AE9a leukemogenesis
To demonstrate the effects of CD45 expression on AE9a leukemogenesis in vivo, we transplanted mice with hematopoietic cells transduced with AE9a or cotransduced with AE9a and CD45.1 (n = 9 per group). Coexpression of CD45.1 significantly delayed the onset of leukemia (Figure 7F, P = .0017, log-rank test). When the AE9a/CD45.1 mice developed leukemia, we examined CD45.1 levels in the leukemia cells and found that the intensity of CD45.1 declined compared with that in sorted AE9a/CD45.1 cells before transplantation (Figure 7G). The > 80% decrease in CD45.1 levels (MFI) in leukemia cells is probably because of the outgrowth of a cell population with low CD45.1 that expand and cause leukemia. The delay in AE9a leukemogenesis by CD45.1 coexpression and the decrease of CD45.1 levels in leukemia cells further provide evidence for the importance of CD45 down-regulation in AE9a leukemogenesis.
Discussion
We identified putative AE9a direct target genes in primary leukemia cells through combined gene expression and ChIP-chip profiling. Consensus AML1 binding sites (TGT/cGGT) are enriched in the ChIP-chip target peaks versus control IgG peaks. The binding of AE9a to the peak regions was confirmed by ChIP assays in most of the tested targets (Figures 3C and 4B; data not shown). Therefore, this combinatorial profiling is a powerful and efficient way to identify genes directly modulated by a transcription factor when matching biologic systems are used, providing a platform to ascertain the molecular mechanisms of cellular transformation and cancer development. More importantly, this approach is also valuable for elucidating possible critical therapeutic intervention strategies in human diseases. In this study, we discover CD45 as a valid AE9a target gene, demonstrate that the CD45-regulated JAK/STAT signaling pathway is enhanced by t(8;21) fusion proteins and hyperactivated in AE9a-induced leukemia and show that down-regulation of CD45 is critical for AE9a leukemogenesis.
HA-tagged AE9a protein was used to establish this leukemia mouse model. We performed ChIP-chip assays with antibodies against HA and AML1 separately with the same leukemia samples. Anti-HA antibody should specifically pull down the chromatin fragments that are complexed with AE9a. Anti-AML1 antibody should pull down chromatin fragments that are complexed with AE9a and AML1. The strong AE9a-binding chromatin fragments are most likely pulled down by both antibodies. Therefore, this double-antibody approach increases the confidence of identifying strong AE9a direct targets, which helps prioritize AE9a dysregulated genes for further study. The anti-AML1 antibody used in this study recognizes all AML proteins including AML1, AML2, and AML3 and would also pull down targets of endogenous AMLs in addition to those of AE9a. Because the same amount of amplified DNA from each ChIP was cohybridized with input DNA to each array, the enrichment over input DNA of individual probes are expected to be lower in the anti-AML1 array, which is exactly what we observed. This also explains why there are fewer peaks that pass the cutoff in the anti-AML1 ChIP-chip study. Therefore, the difference in antibody binding affinity and the presence of endogenous AMLs very likely caused the marked differences between the 2 datasets. This seems to be a limitation of ChIP-chip assays. The anti-AML1 antibody is able to specifically pull down all of the HA-only targets that we examined so far by ChIP-PCR. AML1-ETO and AML1/2/3 bind to the same DNA sequence in the in vitro studies. However, their preferential binding to specific gene regulatory elements in vivo is very likely determined by the combination of their DNA binding sequence and other proteins bound to the adjacent regions of their potential binding sites. Although not investigated here, it is probable that some targets of endogenous AMLs are among the anti-AML1–only pulled down genes. It will require a great effort to distinguish those genes. For the purpose of this study, we therefore did not separate targets between the 2 ChIP-chip assays. As a DNA binding transcription factor, AE9a should modulate the expression of its target genes. We therefore used gene expression profiling data to limit the list of potentially significant direct target genes further to 214 (Figure 1A). Among them, the 60 HA and AML1 common targets were considered as top candidates (Figure 1A; supplemental Table 3). The genes that have ChIP-chip peaks with either HA or AML1 antibody need to be further examined in the future.
Within the 60 top AE9a direct target genes identified in the leukemia mouse model, 19 (AAGAB, ADD3, CUEDC1, FDX1, FUT8, HMHA1, HSPA1B, IER3, JDP2, KDM6B, LRCH1, NAB2, PARP8, PRKCH, PTPRC, RNF144A, SLC2A3, SLCO3A1, and SYNGR1) showed human t(8;21)–specific up or down-regulation compared with other AML patients, including CD45 (supplemental Figures 3 and 4; supplemental Table 3). In a pathway analysis using IPA, 11 of these 19 genes (FDX1, FUT8, HSPA1B, IER3, JDP2, KDM6B, NAB2, PRKCH, PTPRC, SLC2A3, and SLCO3A1) belong to a network, whose functions include cell signaling, posttranslational modification, and cellular growth and proliferation (supplemental Figure 10). Interestingly, SP1, which is directly connected to FDX1, HSPA1B, and SLC2A3, in this network, was reported to bind the regulatory elements of FDX1 and Slc2a3 genes and activate the transcription of Hspa1b gene (supplemental Figure 10).46-48 AML1-ETO was shown to interact with SP1 through the RUNT domain and antagonize SP1 transactivity on the p21 WAF1/CIP1 promoter using luciferase reporter assays.36 The interaction with SP1 or other transcription factors could be another mechanism for AE9a to localize to its target genes and regulate their expression in addition to binding DNA directly.
The JAK/STAT signaling pathway is frequently activated in leukemia and other hematologic disorders.49,50 The mechanisms by which this pathway is activated include mutations in cytokine receptors (FLT3, cKIT, G-CSFR, MPL) and constitutive JAK kinase activity (JAK2V617F, TEL-JAK2), which lead to increased transcriptional activity of STAT proteins.49,50 We sequenced the PCR products of the genomic regions corresponding to the human genes whose mutations frequently cause enhanced JAK/STAT signaling, including FLT3-ITD, FLT3-D835 (D838 in mouse), MPL-W515 (W514 in mouse), and JAK2-V617, in multiple AE9a leukemia samples (n = 8), and none of the samples examined had mutations in these genes (data not shown). The JAK/STAT pathway is negatively regulated by the SOCS family of proteins and protein phosphatases, including CD45 and protein tyrosine phosphatase-ϵ C (PTPϵC).49 Down-regulation of CD45, as we showed in the AE9a leukemia cells, could potentiate the cellular response to cytokine stimulation, rendering leukemia cells more responsive to growth signals and potentially becoming dependent on the JAK/STAT pathway for proliferation and/or survival.
In this study, we demonstrated the benefit of combining gene expression and DNA occupancy profiling assays to identify potential therapeutic targets in human cancers. This approach enabled the identification of a previously unappreciated signaling pathway involving t(8;21) fusion proteins, CD45 and JAK/STAT. These observations shed light in understanding the molecular mechanisms underlying the pathogenesis of t(8;21) AML. Future studies are necessary to address the therapeutic potential of inhibitors of the JAK/STAT and their downstream pathways, and the possibility of combining them with conventional chemotherapeutic strategies or other novel regimens for the treatment of primary, therapy-related, and/or residual t(8;21) AML.
The online version of this article contains a data supplement.
The publication costs of this article were defrayed in part by page charge payment. Therefore, and solely to indicate this fact, this article is hereby marked “advertisement” in accordance with 18 USC section 1734.
Acknowledgments
The authors thank Joseph Biggs and Russell DeKelver for critical reading and editing of the paper, Mark Kamps for NUP98-NSD1 and HOXA9+MEIS1 expression constructs, and members of the Zhang laboratory for valuable discussions.
This work was supported by funding from National Institutes of Health (CA104509 and CA096735 to D.E.Z.) and the Leukemia & Lymphoma Society (Fellowship 5122-07 to M.C.L.).
National Institutes of Health
Authorship
Contribution: M.-C.L., L.F.P., and D.-E.Z. designed the studies, analyzed the data, and wrote the paper; M.-C.L., L.F.P., M.Y., X.C., W.-J.S., S.M., E.-Y.A., Y.K., and M.L. performed experiments; F.J. and B.R. analyzed ChIP-chip data; H.B.O., I.-M.C., P.H., and C.L.W. provided crucial samples; and D.-E.Z. conceived and supervised the research.
Conflict-of-interest disclosure: The authors declare no competing financial interests.
Correspondence: Dong-Er Zhang, University of California, San Diego, 3855 Health Sciences Dr, Mail Stop 0815, La Jolla, CA 92093; e-mail: d7zhang@ucsd.edu.

