Key Points
Murine and human megakaryocytes assemble podosomes.
Megakaryocyte podosomes remodel matrix.
Abstract
Megakaryocytes give rise to platelets via extension of proplatelet arms, which are released through the vascular sinusoids into the bloodstream. Megakaryocytes and their precursors undergo varying interactions with the extracellular environment in the bone marrow during their maturation and positioning in the vascular niche. We demonstrate that podosomes are abundant in primary murine megakaryocytes adherent on multiple extracellular matrix substrates, including native basement membrane. Megakaryocyte podosome lifetime and density, but not podosome size, are dependent on the type of matrix, with podosome lifetime dramatically increased on collagen fibers compared with fibrinogen. Podosome stability and dynamics depend on actin cytoskeletal dynamics but not matrix metalloproteases. However, podosomes degrade matrix and appear to be important for megakaryocytes to extend protrusions across a native basement membrane. We thus demonstrate for the first time a fundamental requirement for podosomes in megakaryocyte process extension across a basement membrane, and our results suggest that podosomes may have a role in proplatelet arm extension or penetration of basement membrane.
Introduction
Megakaryocytes (Mks) maintain thrombopoiesis by releasing cytoplasmic fragments called proplatelets into the blood.1 Prior to proplatelet formation, Mks undergo initial differentiation in the osteoblastic niche, a hypoxic compartment dominated by extracellular matrix (ECM) proteins collagen I and fibronectin. At some point in the maturation process, cells migrate to the vascular niche, where they send out long projections (proplatelets) across the basement membrane of a sinusoidal vessel. Platelets form as the long proplatelet arms encounter the shear forces of the bloodstream, with a proportion of platelet formation occurring within the bloodstream.2,3 The vascular niche is dominated by the presence of collagen IV, laminin, and fibrinogen, and by endothelial cells.4,5 The interaction of the Mk with its niche environment via integrins and other surface molecules is essential to Mk function.6
Both Mk migration and proplatelet budding require the dynamic rearrangement of the actin cytoskeleton. Primary initiators of actin assembly include the Arp2/3 complex and its regulators, the Wiskott-Aldrich syndrome protein (WASp) family proteins. Podosomes are highly dynamic dot-like matrix contacts formed by Mks7 as well as other myeloid-derived cells such as dendritic cells, macrophages, and osteoclasts.8,9 Podosomes consist of an F-actin-rich core with an integrin-associated ring structure. Typical core proteins include Arp2/3 complex, WASp, and cortactin whereas integrins, vinculin, talin, paxillin,10 and myosin IIA11 localize to the ring structure. Under some conditions, podosomes form superstructures called rosettes, where clusters of podosomes assume a ring shape.12 Podosomes are dynamic, with a lifetime of up to 12 minutes, which is shorter than related structures like invadopodia (tens of minutes to more than 10 hours) and focal adhesions (up to 1 hour).13 However, these structures are thought to be important in mechanosensory processes and thus can be longer-lived on more rigid substrates.14,15 Indeed, not only the size and the shape of podosome rosettes but also the lifetime of individual podosomes is dependent on stiffness of the underlying substratum and myosin-IIA-regulated tension.15 In addition to their role in adhesion, podosomes drive the degradation of ECM proteins via matrix metalloproteases (MMPs).16,17
Sabri et al (2006)7 first observed podosomes in Mks and found that WASp−/− Mks were unable to form podosomes. WASp−/− Mks prematurely formed proplatelets in the bone marrow, contributing to thrombocytopenia. They speculated that premature formation of platelets could be due to a loss of the normal inhibition of proplatelet budding by podosome assembly on collagen I, which might prohibit release of platelets prematurely before the vascular niche is reached.7
Here we provide a detailed analysis of Mk podosome structures and dynamics and we demonstrate the ability of Mk podosomes to degrade ECM. In contrast to Sabri et al,7 we find that Mks form podosomes on multiple ECM substrates, including fibrinogen. Mks form classical podosomes with F-actin cores driven by actin polymerization via the Arp2/3 complex and WASp and surrounded by rings of vinculin. We find that the underlying substrate can affect podosome numbers, density, and lifetime. We demonstrate podosome-driven degradation of fibrinogen, and we find that protease activity is essential for the assembly of protrusive actin structures crossing a native basement membrane. We propose that podosomes may play a pivotal role in Mk motility and remodelling of ECM, including activities such as extension of proplatelet arms across the basement membrane of a sinusoidal vessel.
Materials and methods
Animals and reagents
Animal experiments were done according to UK Home Office Regulations. Prior to isolation of Mks or native peritoneal basement membranes, mice were sacrificed by an approved Schedule I method. Control mice from C57BL/6 or mixed background were used as appropriate. The Lifeact mice and WASp−/− mice have a C57BL/6 background and were described before.18,19 MYH9−/− mice were previously described.20 All antibodies and reagents are described in supplemental Methods.
Isolation of bone marrow-derived Mks
Mks were isolated from the bone marrow from the hind legs of mice >6 weeks old. Both tibiae and femurs were flushed followed by the depletion of immune cells with magnetic beads as described before.21 After 7 days of differentiation, mature Mks were purified with a 1.5%/3% bovine serum albumin gradient for 45 minutes and constituted >60% of the enriched cell population as reported previously.22
Isolation of human megakaryocytes from cord blood
Human cord blood samples were obtained after informed written consent in accordance with the Declaration of Helsinki from the mothers according to the Scottish National Blood Transfusion Service. Mononuclear cell fractions were isolated from whole blood with density gradient separation using Histopaque-1077 (Sigma-Aldrich, St. Louis, MO). Cells were enriched for CD34 using magnetic bead labeling and separation (Miltenyi Biotec Inc., Auburn, CA) according to the manufacturer's instructions. Purity of enriched populations was examined using flow cytometry for CD34 expression (CD34-APC; BD Biosciences, Oxford, UK) and all samples were ≥80% CD34+. Cells were seeded at approximately 1 × 10⁵/mL in serum-free medium supplemented with StemSpan CC220, a cytokine cocktail containing recombinant human interleukin 6, interleukin 9, stem cell factor, and thrombopoietin (Stem Cell Technologies, Grenoble, France), cultured for 7 days, and then reseeded in fresh medium for a further 4 to 7 days. Mks were isolated as described above for murine Mks.
Lentiviral transfection of megakaryocytes
Lentiviral constructs for WASp tagged with green fluorescent protein (GFP) have been previously described.23 Lentivirus particles were produced in HEK293T cells and virus titer was determined with Lenti-X™ qRT-PCR titration kit from Clontech. Mks were incubated on day 2 with a multiplicity of infection value of 30 for 24 hours until day 3. Cells were supplemented with fresh full Dulbecco’s modified Eagle medium containing 100 ng/mL stem cell factor and 50 ng/mL thrombopoietin during the following 3 days (days 4-6) prior to experiments.
Imaging of live and fixed megakaryocytes
Immunofluorescence of fixed cells was performed by standard methods and is described in supplemental Methods.
For Mk lifetime experiments, glass-bottom dishes (MatTek, Ashland, MA) were incubated with 100 μg/mL fibrinogen or 100 μg/mL Horm collagen at 4°C overnight. Dishes were blocked with heat-inactivated 0.5% bovine serum albumin for 1 hour. Lifeact-GFP cells were seeded in serum-free medium containing 250 ng/mL stromal-derived factor (SDF) 1α and directly imaged at 37°C and 5% CO2 supply or in the presence of HEPES (N-2-hydroxyethylpiperazine-N′-2-ethanesulfonic acid) buffer to stabilize the pH. Images were taken every 10 or 20 seconds to decrease phototoxic side effects. A Nikon A1R confocal microscope (Tokyo, Japan) or a Nikon TIRF (Tokyo, Japan) microscope was used with a 60×/1.4 NA or a 100×/1.4 NA oil objective. Images were recorded using a 4-channel PMT detector or a Evolve 512 EMCCD camera (Photometrics, Tuscon, AZ) for 20 minutes to 4 hours. ImageJ 1.46i was used for podosome lifetime calculation. Podosomes (at least 10 per cell) forming during the length of the movie were defined as actin-rich dots and analyzed manually.
For fibrinogen and basement membrane degradation assays, we adapted similar assays that had been previously used to analyze cancer cells or fibroblasts (eg, Hotari et al24 ) and the details are in supplemental Methods.
Statistical analysis
Statistical analysis was done by standard methods with advice from Dr Gabriela Kalna (see supplemental Methods).
Results
Megakaryocytes form podosomes on multiple ECM surfaces
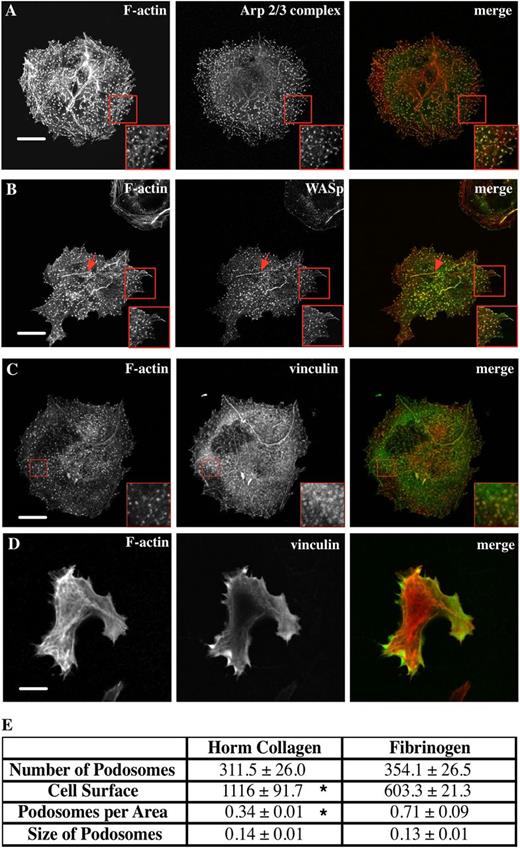
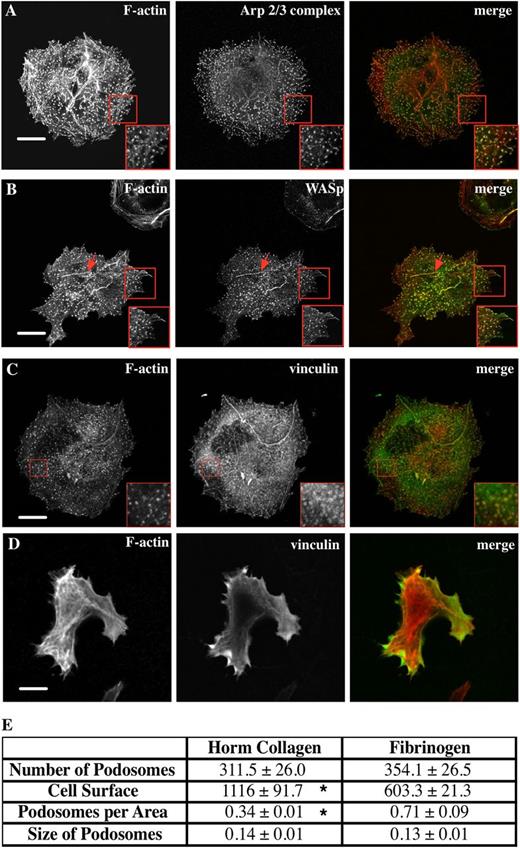
Murine Mks were spread on Horm collagen (predominantly collagen I), and stained for Arp2/3 complex, revealing F-actin-rich dot-like structures (Figure 1A). Actin puncta were verified to be podosomes through colocalization of F-actin and WASp (Figure 1B) and the formation of a vinculin ring structure around the F-actin-rich core (Figure 1C red square). Interestingly, some of the spread Mks displayed elongated structures showing aligned podosome assembly along the collagen fibers (Figure 1B arrow). These structures are also apparent in Figure 1A, but together with actin stress fibers, which appear as straighter F-actin-rich linear bundles. WASp is widely known to be essential for podosome formation in hematopoietic cells,9,25,26 including one report where Mks were studied.7 We confirmed that WASp−/− Mks did not form podosomes when spread on collagen (Figure 1D), demonstrating an absolute requirement for WASp to initiate podosome formation.
Mks form abundant podosomes on Horm collagen and fibrinogen matrix. Mks were spread on 100 μg/mL Horm collagen-coated surfaces for 3 hours and then fixed and stained for F-actin and (A) the Arp2/3 complex, (B) WASp, and (C) vinculin. (D) Mks spread on collagen from WASp−/− mice were stained for F-actin and vinculin. The right column of pictures shows the merge of F-actin (red, phalloidin) and WASp, Arp2/3 complex, or vinculin (green). Red squares indicate magnified area of the cell. Red arrows in panel B indicate podosomes along what appears to be a collagen fiber. (E) Table shows the average plus or minus the standard error of the mean (SEM) for the spread Mk surface area in µm2, the mean number of podosomes formed, podosomes formed per μm2, and the size of podosomes for Mks spread for 3 hours on 100 μg/mL Horm collagen or 100 μg/mL fibrinogen-coated surfaces fixed and stained for F-actin and WASp. The podosome size was determined by measuring at least 100 podosomes of 5 different cells per experiment. Data are representative of 3 experiments. Asterisk indicates significant difference between collagen and fibrinogen data with a P value < .05. Pictures were taken with a confocal microscope using a 60× objective. Scale bars represent 10 μm.
Mks form abundant podosomes on Horm collagen and fibrinogen matrix. Mks were spread on 100 μg/mL Horm collagen-coated surfaces for 3 hours and then fixed and stained for F-actin and (A) the Arp2/3 complex, (B) WASp, and (C) vinculin. (D) Mks spread on collagen from WASp−/− mice were stained for F-actin and vinculin. The right column of pictures shows the merge of F-actin (red, phalloidin) and WASp, Arp2/3 complex, or vinculin (green). Red squares indicate magnified area of the cell. Red arrows in panel B indicate podosomes along what appears to be a collagen fiber. (E) Table shows the average plus or minus the standard error of the mean (SEM) for the spread Mk surface area in µm2, the mean number of podosomes formed, podosomes formed per μm2, and the size of podosomes for Mks spread for 3 hours on 100 μg/mL Horm collagen or 100 μg/mL fibrinogen-coated surfaces fixed and stained for F-actin and WASp. The podosome size was determined by measuring at least 100 podosomes of 5 different cells per experiment. Data are representative of 3 experiments. Asterisk indicates significant difference between collagen and fibrinogen data with a P value < .05. Pictures were taken with a confocal microscope using a 60× objective. Scale bars represent 10 μm.
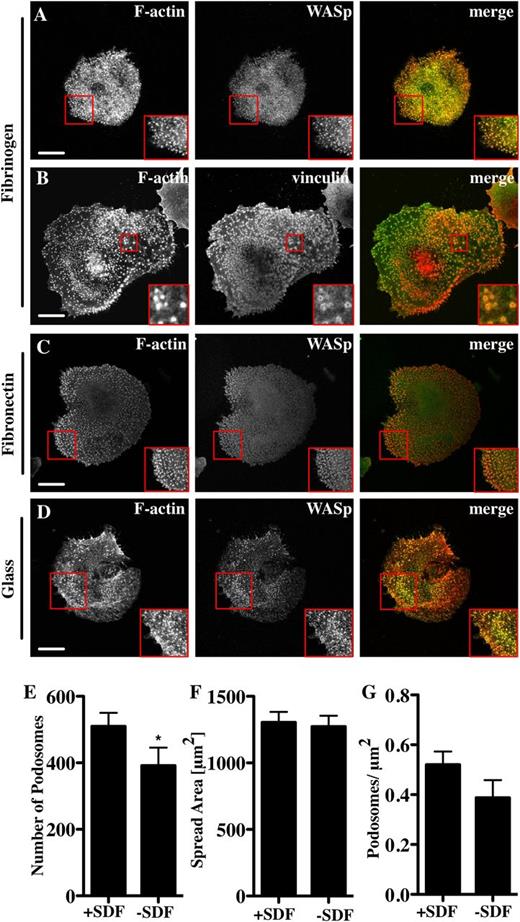
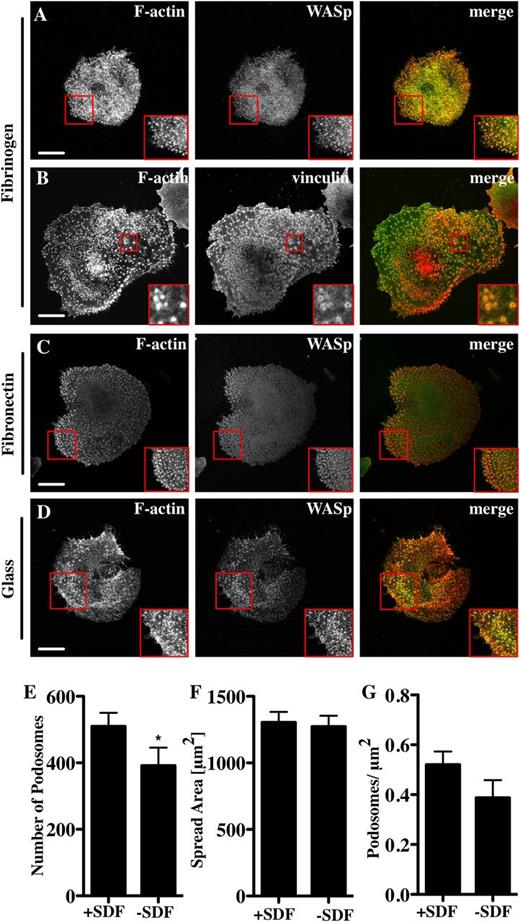
To examine podosome formation on other bone marrow-relevant matrix molecules, Mks were spread on fibrinogen.27 In comparison with collagen I, Mks spread significantly less well on fibrinogen but had a higher number of podosomes per unit area (Figure 1E and Figure 2A-B). The podosomes were similar in size to those on collagen and contained WASp (Figure 2A), the Arp2/3 complex (not shown), and vinculin (Figure 2B red square). Podosomes formed on fibronectin (Figure 2C) and on glass (Figure 2D) with no added matrix when cells were spread in serum-containing medium. Although WASp−/− Mks did not have podosomes, they spread out similarly to control cells on both collagen and fibrinogen (supplemental Data File 1). Primary human Mks differentiated from cord blood also formed podosomes (supplemental Data File 2). These were not as prominent as the murine Mk podosomes, but had clear vinculin ring structures and actin cores (supplemental Data File 2). Because murine Mks were more readily obtainable than human Mks, we performed all of our subsequent experiments with murine cells. We thus conclude that Mks can make podosomes on multiple types of substrate that resemble podosomes in myeloid cell types and that podosome formation is not a prerequisite for cell spreading.
Mks form podosomes on different substrata. Cells were spread for 3 hours on 100 μg/mL fibrinogen or fibronectin-coated surfaces or on glass, and then fixed and stained for F-actin (red, phalloidin) and WASp (A, C, D) or vinculin (B) (green). The right panel of pictures shows the merge of both channels. Mks were spread for 3 hours on 100 μg/mL Horm collagen-coated surface ±250 ng/mL SDF. Cells were analyzed for (E) the number of podosomes, (F) cell surface area, and (G) podosomes per μm2. Scale bars represent 10 μm. Red square indicates enlarged area to highlight podosomes. Data are representative of at least 3 experiments.
Mks form podosomes on different substrata. Cells were spread for 3 hours on 100 μg/mL fibrinogen or fibronectin-coated surfaces or on glass, and then fixed and stained for F-actin (red, phalloidin) and WASp (A, C, D) or vinculin (B) (green). The right panel of pictures shows the merge of both channels. Mks were spread for 3 hours on 100 μg/mL Horm collagen-coated surface ±250 ng/mL SDF. Cells were analyzed for (E) the number of podosomes, (F) cell surface area, and (G) podosomes per μm2. Scale bars represent 10 μm. Red square indicates enlarged area to highlight podosomes. Data are representative of at least 3 experiments.
Podosome formation requires the activity of the Arp2/3 complex
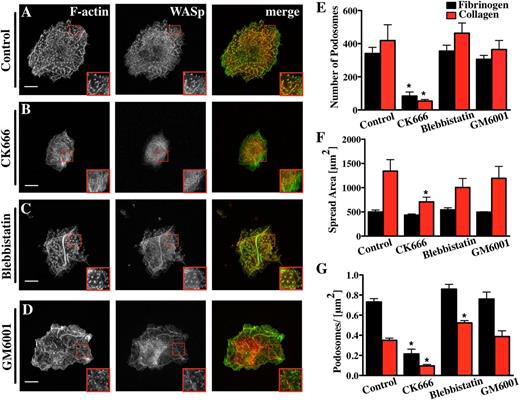
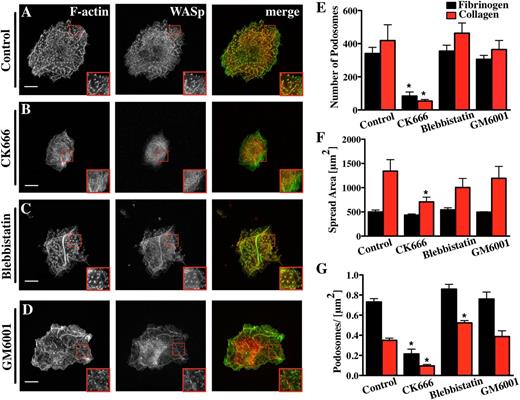
Because the Arp2/3 complex strongly localized to Mk podosomes and had been previously described in podosomes of dendritic cells and macrophages,28,29 we examined the effect of inhibiting the Arp2/3 complex on Mk podosomes. Addition of 20 µM CK666, a small-molecule inhibitor of the Arp2/3 complex,29,30 inhibited spreading of Mks on collagen by over 50% and reduced the total number of podosomes to less than 20% of controls (Figure 3; supplemental Data File 3A-B). The net effect of CK666 on podosomes was similar whether it was added before (Figure 3) or after the first 2.5 hours of Mk spreading (supplemental Data File 4). Thus, it is likely that the Arp2/3 complex plays a fundamental role in Mk podosome formation and maintenance. The few residual podosomes that did form in the presence of CK666 contained filamentous actin and showed no significant difference in size in comparison with the dimethylsulfoxide (DMSO) control. These could simply reflect incomplete inhibition of Arp2/3-mediated actin assembly (data not shown).
Mk podosome formation requires the activity of the Arp2/3 complex. Cells were spread for 3 hours on 100 μg/ml Horm collagen-coated surfaces fixed and stained for F-actin (green) and WASp (red). The right panel of pictures shows the merge of both channels. The cells were treated with different inhibitors: (A) 0.1% DMSO was used as control for (B) 20 μM CK666, (C) 10 μM blebbistatin, (D) 5 μM GM6001. Scale bars represent 10 μm. Quantification of the effect of the inhibitors on (E) the number of podosomes, (F) cell surface area, and (G) podosomes per μm2 were determined on Horm collagen (red columns) or fibrinogen (black columns). Statistical analysis was done using a 1-way analysis of variance. Asterisk indicates significant difference from the control value with a P value < .05. Error bars indicate ±SEM. Data are representative of 3 experiments.
Mk podosome formation requires the activity of the Arp2/3 complex. Cells were spread for 3 hours on 100 μg/ml Horm collagen-coated surfaces fixed and stained for F-actin (green) and WASp (red). The right panel of pictures shows the merge of both channels. The cells were treated with different inhibitors: (A) 0.1% DMSO was used as control for (B) 20 μM CK666, (C) 10 μM blebbistatin, (D) 5 μM GM6001. Scale bars represent 10 μm. Quantification of the effect of the inhibitors on (E) the number of podosomes, (F) cell surface area, and (G) podosomes per μm2 were determined on Horm collagen (red columns) or fibrinogen (black columns). Statistical analysis was done using a 1-way analysis of variance. Asterisk indicates significant difference from the control value with a P value < .05. Error bars indicate ±SEM. Data are representative of 3 experiments.
Myosin IIA has also been implicated in force transduction in association with actin filaments in podosomes, although it is not essential for their formation.14,31 Interestingly, nonmuscle myosin IIA is the only isoform present in Mks and platelets.32 Inhibiting myosin II prior to cell spreading caused a slight increase in the number of podosomes per area (Figure 3C,E-G; supplemental Data File 3C). This might have been due to slightly reduced spreading, although the differences were not statistically significant. To explore a spreading-related effect, we showed that blebbistatin had no significant effect on surface area or the number and size of podosomes in Mks spread first for 2.5 hours and then treated for 30 minutes with inhibitor (supplemental Data File 4). This indicates that myosin II does not play a significant role in Mk podosome assembly. Furthermore, no effect of myosin II inhibition on podosome size could be detected on collagen or fibrinogen (data not shown). These results were confirmed with myosin-IIA-deficient Mks, which did not show any difference in the number of podosomes, the spread cell-surface area, or the podosome size compared with litter-matched controls spread on fibrinogen (supplemental Figure 5A-C).
Endothelial cells, macrophages, and dendritic cells all produce podosomes capable of degrading ECM.9,33,34 Cancer cells assemble invadopodia, which resemble podosomes and are dependent on MMPs for their assembly.35 Treatment of Mks with a broad-spectrum MMP inhibitor, GM6001, had no effect on podosome formation or podosome size in Mks on collagen or fibrinogen (Figure 3D-G; supplemental Data File 3D). We confirmed that the GM6001 was able to inhibit invadopodia formation in MDA-MB-231 cells coplated with Mks on a fibrinogen surface (not shown). Thus, GM6001-sensitive MMPs are not required for podosome assembly or maintenance in Mks.
The lifetime of podosomes is dependent on the underlying substratum
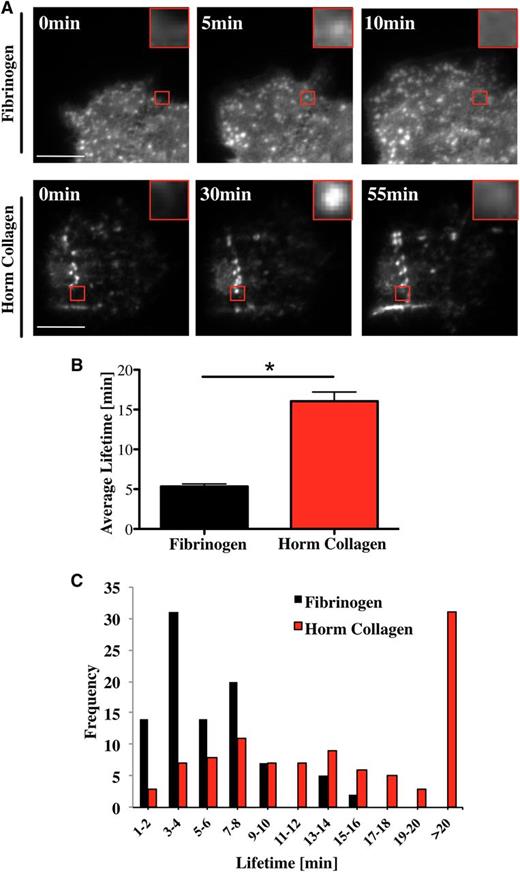
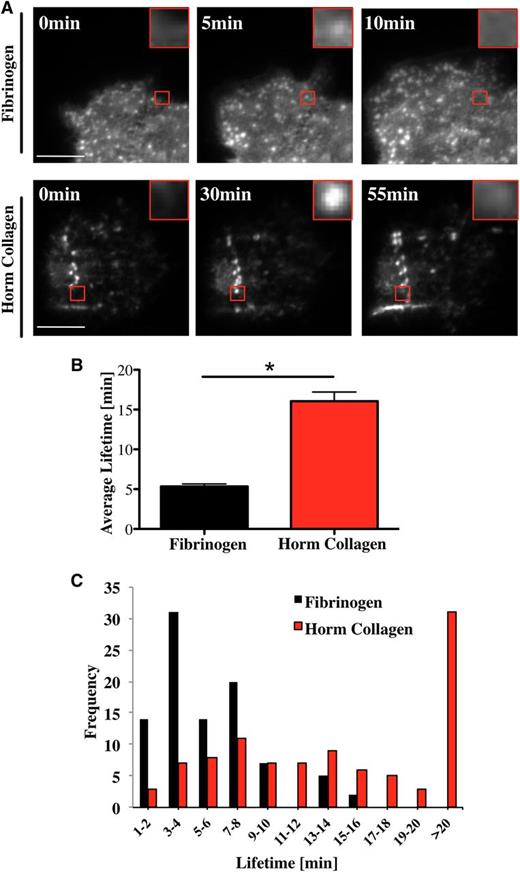
Podosomes are highly dynamic structures with a lifetime between 2 and 12 minutes in macrophages, dendritic cells, and osteoclasts spreading on glass, fibronectin, or collagen I.11,14,25,34,36 In the present study, we have measured the lifetime of podosomes in Mks isolated from Lifeact-GFP mice18 using real-time total internal reflection fluorescence (TIRF) or confocal microscopy. Podosomes are highly dynamic structures, undergoing rapid formation and dissolution as illustrated on a fibrinogen surface (Figure 4A; supplemental Movie 1). The mean lifetime of podosomes on fibrinogen was 5 ± 0.3 minutes (Figure 4B), with no podosome lasting for longer than 15 minutes (Figure 4C black columns). In comparison, podosomes had a significantly longer half-life on collagen I of over 16 ± 1.1 minutes, with more than 30% lasting beyond 20 minutes (Figure 4C red columns). Furthermore, the podosomes sometimes assembled in a linear arrangement along the collagen fibers (Figure 4A bottom panel; supplemental Movie 2). Long-lasting podosomes were also observed in GFP-WASp-expressing Mks spreading on collagen (supplemental Movie 3). These results suggest that Mks sense the matrix environment and assemble podosomes along collagen fibers and that this influences their lifetime.
Mk podosomes are longer-lived on collagen. (A) Lifeact-GFP cells were spread on 100 μg/mL fibrinogen (top images) or 100 μg/mL Horm collagen-coated surfaces (bottom images) and were imaged in real time with a TIRF microscope for 20 minutes (fibrinogen) and 2 hours (Horm collagen) using a 100× objective. Pictures were taken every 10 seconds (fibrinogen) or 20 seconds (Horm collagen). Red squares show enlarged single podosomes. (B) The average lifetime ±SEM was determined by measuring 100 podosomes in total of 10 different cells. Data were collected of 4 independent experiments. (C) Cumulative frequency analysis of podosome lifetime was completed in 2-minute intervals. A Student t test was used for the statistical analysis. Asterisk indicates significant difference with a P value < .05. Error bars indicate ±SEM. See also supplemental Movie 1 (podosomes on fibrinogen), supplemental Movie 2 (podosomes on collagen), and supplemental Movie 3 (WASp in podosomes on collagen).
Mk podosomes are longer-lived on collagen. (A) Lifeact-GFP cells were spread on 100 μg/mL fibrinogen (top images) or 100 μg/mL Horm collagen-coated surfaces (bottom images) and were imaged in real time with a TIRF microscope for 20 minutes (fibrinogen) and 2 hours (Horm collagen) using a 100× objective. Pictures were taken every 10 seconds (fibrinogen) or 20 seconds (Horm collagen). Red squares show enlarged single podosomes. (B) The average lifetime ±SEM was determined by measuring 100 podosomes in total of 10 different cells. Data were collected of 4 independent experiments. (C) Cumulative frequency analysis of podosome lifetime was completed in 2-minute intervals. A Student t test was used for the statistical analysis. Asterisk indicates significant difference with a P value < .05. Error bars indicate ±SEM. See also supplemental Movie 1 (podosomes on fibrinogen), supplemental Movie 2 (podosomes on collagen), and supplemental Movie 3 (WASp in podosomes on collagen).
Podosome-driven degradation of fibrinogen is MMP and myosin II dependent
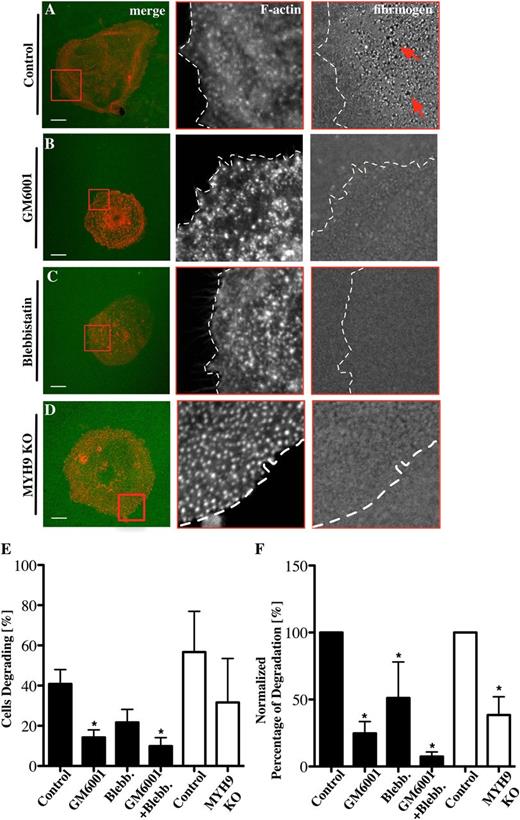
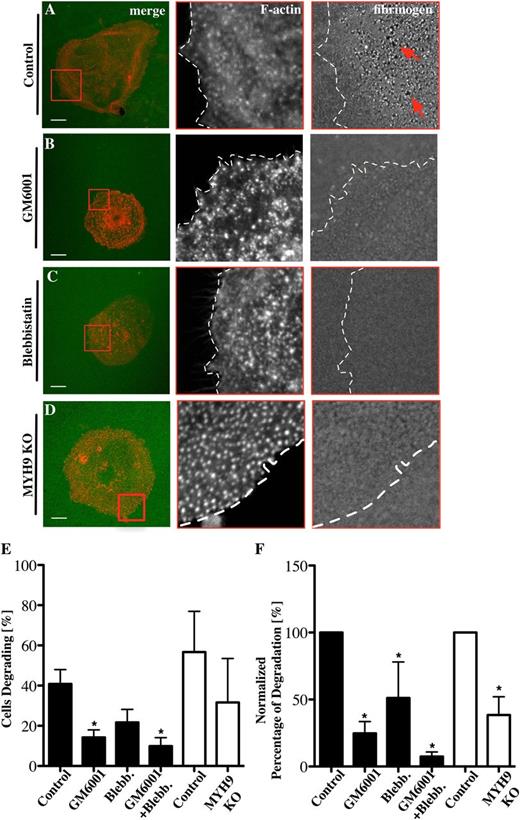
One of the key features of podosomes is the proteolytic degradation of ECM proteins. Podosome-driven degradation of ECM proteins like collagen or fibronectin is well established in cell types such as macrophages or dendritic cells25,37 but not in Mks. To investigate whether Mk podosomes can remodel matrix, Mks were spread on Alexa 488-labeled fibrinogen. Small holes (red arrows) in the fibrinogen matrix were indicative of podosome-mediated degradation (Figure 5A). Approximately 40% of Mks showed evidence of degradation (Figure 5E-F) and this was reduced in the presence of the MMP inhibitor GM6001 and the myosin IIA inhibitor blebbistatin by more than 50% (Figure 5B-C). MYH9−/− Mks, which displayed similar numbers of podosomes (supplemental Data File 5A-C), also showed a similar reduction in numbers of cells degrading fibrinogen matrix and showed a significant decrease in the amount of fibrinogen degradation (Figure 5D-F). Furthermore, the extent of matrix degradation was severely inhibited, most notably in the presence of GM6001, where the degradation was reduced by over 80% (Figure 5E-F). Comparison of the matrix-degrading and nondegrading Mks indicated that there was a significant increase in nuclear size (indicating a more mature Mk) associated with those Mks degrading the fibrinogen matrix (supplemental Figure 6). Thus, mature Mks used both MMPs and myosin IIA to orchestrate fibrinogen remodelling via their podosomes. Of note, we were unable to visualize degradation of collagen matrix, most likely due to technical reasons, because the fibers were thick and not flat along the coverglass.
Fibrinogen degradation depends on MMPs and myosin IIA activity. Mks were spread on 100 μg/mL 488-labeled fibrinogen-coated surfaces (green) for 3 hours and stained for F-actin (red) in the presence of (A) 0.1% DMSO as control for (B) 5 μM GM6001 and (C) 10 μM blebbistatin. (D) MYH9−/− Mks were spread on 488-labeled fibrinogen-coated surfaces. Pictures show from left to right the merge of F-actin and fibrinogen, with red squares indicating magnified areas of F-actin and fibrinogen and dotted lines marking the outline of the cell. (E) The percentage of Mks that were degrading fibrinogen was analyzed and (F) the percentages of total degradation were measured and normalized. Black columns represent inhibitor-treated samples, and white columns represent control and MYH9−/− Mks. Images were taken with a confocal microscope using a 60× objective. A total of 20 cells were analyzed per experiment for n = 6 experiments. Scale bars represent 10 μm. Statistical analysis was done with a Student t test. Asterisk represents significant difference with a P value < .05. Error bars indicate ±SEM. Blebb., blebbistatin; KO, knockout.
Fibrinogen degradation depends on MMPs and myosin IIA activity. Mks were spread on 100 μg/mL 488-labeled fibrinogen-coated surfaces (green) for 3 hours and stained for F-actin (red) in the presence of (A) 0.1% DMSO as control for (B) 5 μM GM6001 and (C) 10 μM blebbistatin. (D) MYH9−/− Mks were spread on 488-labeled fibrinogen-coated surfaces. Pictures show from left to right the merge of F-actin and fibrinogen, with red squares indicating magnified areas of F-actin and fibrinogen and dotted lines marking the outline of the cell. (E) The percentage of Mks that were degrading fibrinogen was analyzed and (F) the percentages of total degradation were measured and normalized. Black columns represent inhibitor-treated samples, and white columns represent control and MYH9−/− Mks. Images were taken with a confocal microscope using a 60× objective. A total of 20 cells were analyzed per experiment for n = 6 experiments. Scale bars represent 10 μm. Statistical analysis was done with a Student t test. Asterisk represents significant difference with a P value < .05. Error bars indicate ±SEM. Blebb., blebbistatin; KO, knockout.
The formation of protrusive actin-rich structures by Mks on a native basement membrane is dependent on podosome formation
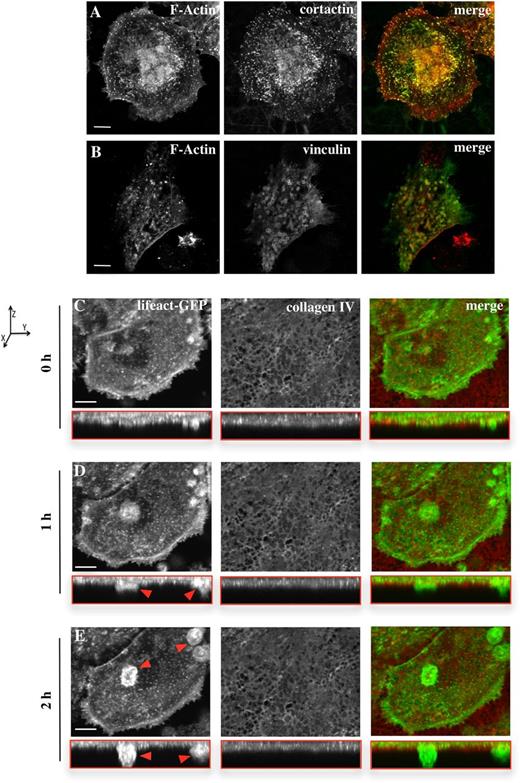
For Mks to release platelets into the bloodstream, they need to form protrusions known as proplatelets that can cross the basement membrane in the blood vessel wall.2,3 To study the potential role of podosomes in extension of processes across basement membrane, we isolated peritoneal basement membranes and monitored Mks for spreading and podosome formation. Mks spread on native basement membrane to a similar extent as they did on Horm collagen (eg, 1586 ± 60 μm2, compared with 1116 ± 91.7 μm2 on collagen; Figure 1 and Figure 6). The presence of podosomes was confirmed by immunofluorescence microscopy corresponding to the podosome markers, cortactin and vinculin, in combination with F-actin (Figure 6A-B). The cortactin antibody showed clear staining in F-actin-rich dot-like structures in the cell, whereas vinculin demonstrated clear ring structure formation around the actin puncta (Figure 6B). Thus, Mks form similar podosomes on a native basement membrane to those formed on a 2-dimensional fibrinogen or collagen spread surface.
Mks form podosomes and protrusive actin-rich structures on a native basement membrane. Cells were spread for 3 hours on a native basement membrane and then fixed and stained for F-actin (red) and (A) cortactin or (B) vinculin (green). Based on the F-actin staining, the cell area of 20 cells per experiment was analyzed, resulting in an average cell size of 1586 ± 60 μm2. Data are representative of at least 3 experiments. The right column of images shows the merge of both channels. Scale bars represent 10 μm. (C-E) Real-time imaging of Lifeact-GFP Mks (green) was done for 5 hours, with pictures taken every 15 minutes, and the Mks were preincubated on the membrane for 2 hours. The membrane was prestained for collagen IV (red). Every time point shows the XY perspective and the XYZ perspective (shown in the red box). Images represent the maximum intensity projection of the taken z-stacks. Red arrows indicate actin-rich protrusion crossing the membrane. Axis graph shows direction of the XYZ perspectives. Images were taken with a confocal microscope using a 40× objective. Scale bar represents 20 μm. See also supplemental Movie 4.
Mks form podosomes and protrusive actin-rich structures on a native basement membrane. Cells were spread for 3 hours on a native basement membrane and then fixed and stained for F-actin (red) and (A) cortactin or (B) vinculin (green). Based on the F-actin staining, the cell area of 20 cells per experiment was analyzed, resulting in an average cell size of 1586 ± 60 μm2. Data are representative of at least 3 experiments. The right column of images shows the merge of both channels. Scale bars represent 10 μm. (C-E) Real-time imaging of Lifeact-GFP Mks (green) was done for 5 hours, with pictures taken every 15 minutes, and the Mks were preincubated on the membrane for 2 hours. The membrane was prestained for collagen IV (red). Every time point shows the XY perspective and the XYZ perspective (shown in the red box). Images represent the maximum intensity projection of the taken z-stacks. Red arrows indicate actin-rich protrusion crossing the membrane. Axis graph shows direction of the XYZ perspectives. Images were taken with a confocal microscope using a 40× objective. Scale bar represents 20 μm. See also supplemental Movie 4.
To investigate if Mks were able to form protrusions that crossed a native basement membrane, Lifeact-GFP Mks were spread on the membrane and imaged in real time. The spreading Mks formed clear actin-rich dots as shown by the images in the xy-plane in Figure 6C-E. Furthermore, confocal imaging in the Z-plane (red boxed images) revealed that over time actin protrusions were formed which were able to cross the membrane (Figure 6C-E red arrows; supplemental Movie 4). In addition to the formation of actin protrusions through the membrane, analysis of the intensity of the membrane outside the cell and underneath the cell as monitored by staining for collagen type IV indicated a reduction in the intensity of staining underneath the cell. This therefore revealed degradation of collagen type IV in the peritoneal basement membrane by the Mks (data not shown). Therefore, Mks were able to degrade the ECM and thereby extend protrusions across the membrane.
Mk protrusion across basement membrane depends on metalloprotease activity
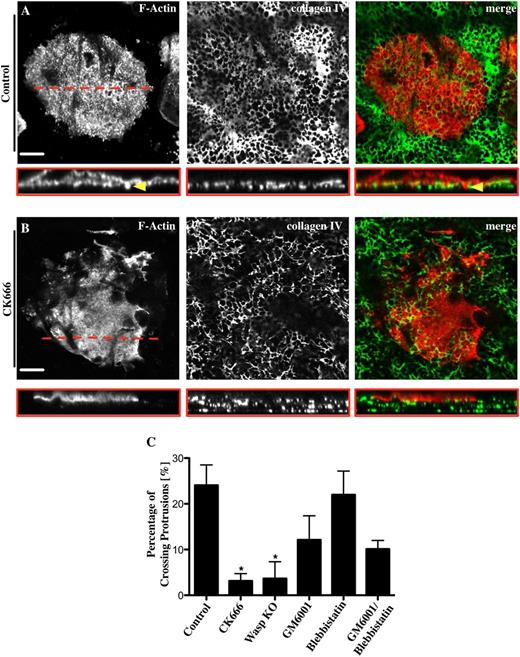
To investigate the relevance of podosome assembly in the process of crossing a native basement membrane, Mks were treated with different inhibitors during spreading on the basement membrane. Control Mks spread fully on the membrane and formed actin-rich podosomes. A Z-section through an Mk on basement membrane reveals actin-containing structures (red) interacting with and crossing through the membrane (green) (Figure 7A red box and yellow arrowhead). Around 25% of the control cells formed actin elongations, which were able to invade the membrane (Figure 7A,C). The Arp2/3 complex inhibitor CK666 significantly decreased both the podosome formation and the percentage of protrusions that penetrated the membrane by almost 90% relative to the control (Figure 7B,C). We observed similar results with WASp−/− Mks consistent with podosomes having a role in formation of protrusions across the basement membrane (Figure 7C). Furthermore, the inhibition of MMPs with 5 μM GM6001 induced a 50% reduction of actin-based protrusions across the basement membrane (Figure 7C). In contrast, inhibition of myosin IIA had no effect on the formation of protrusions across the membrane either in the absence or presence of MMP inhibition (supplemental Figure 7). Therefore, protrusion formation across native basement membranes is dependent on podosome formation and MMP activity but not on myosin IIA.
Mks use podosomes to cross a native basement membrane. Mks were spread for 3 hours on a native basement membrane fixed and stained for F-actin (red) and collagen IV (green). The right column of pictures shows the merge of both channels. Representative images are shown for (A) 0.1% DMSO used as control and (B) 20 μM CK666. Pictures show slice of taken z-stack from each treatment and the corresponding cross section, XYZ perspective. (C) The percentage of actin protrusions crossing the basement membrane was analyzed for different inhibitors; 20 μM CK666, 5 μM GM6001, 10 μM blebbistatin, 5 μM GM6001/10 μM blebbistatin, and WASp−/− Mks. Yellow arrowhead indicates actin-rich protrusion crossing the membrane. Red line represents position of cross section. The cross sections of at least 10 different cells were analyzed per experiment. Data are representative of at least 3 independent experiments. Images were taken with a confocal microscope using a 40× objective. Scale bars represent 20 μm. Statistical analysis was done by performing a 1-way analysis of variance. Asterisk indicates significant difference with a P value < .05. Error bars indicate ±SEM.
Mks use podosomes to cross a native basement membrane. Mks were spread for 3 hours on a native basement membrane fixed and stained for F-actin (red) and collagen IV (green). The right column of pictures shows the merge of both channels. Representative images are shown for (A) 0.1% DMSO used as control and (B) 20 μM CK666. Pictures show slice of taken z-stack from each treatment and the corresponding cross section, XYZ perspective. (C) The percentage of actin protrusions crossing the basement membrane was analyzed for different inhibitors; 20 μM CK666, 5 μM GM6001, 10 μM blebbistatin, 5 μM GM6001/10 μM blebbistatin, and WASp−/− Mks. Yellow arrowhead indicates actin-rich protrusion crossing the membrane. Red line represents position of cross section. The cross sections of at least 10 different cells were analyzed per experiment. Data are representative of at least 3 independent experiments. Images were taken with a confocal microscope using a 40× objective. Scale bars represent 20 μm. Statistical analysis was done by performing a 1-way analysis of variance. Asterisk indicates significant difference with a P value < .05. Error bars indicate ±SEM.
Discussion
Podosomes are so named because they can be thought of as cellular “foot processes,” regulating adhesion, migration, and matrix interactions of a variety of cell types. Typically, podosomes are found in highly motile monocytic lineage cells such as dendritic cells, osteoclasts, and macrophages, where they are thought to be important for mediating the interactions between such cells and the ECM. We describe here the first detailed characterization of Mk podosomes, and we propose that they are important modulators of Mk interactions with matrix and confer matrix-degrading activities. Our study has important implications for understanding how Mks can cross ECM and basement membranes and may contribute to our understanding of how they deposit platelets into the bloodstream.
We extend the initial observations of Sabri et al (2006), who first noticed that Mks assemble podosomes on collagen, and we show that Mks make classical podosomes with vinculin rings around a central actin core.38,39 However, we now show that Mks also assemble podosomes on all matrices that we tested, including native mouse peritoneal basement membranes. Although podosomes were ubiquitous, the number of podosomes per unit area depended on the underlying matrix and was variable. For example, Mks formed significantly more podosomes per unit area on fibrinogen than on Horm collagen. A thin layer of fibrinogen likely forms an inflexible monolayer on glass (compare Alexa 488-fibrinogen continuity in Figure 5) in contrast to more flexible and 3-dimensional collagen fibers. Stiffer substrates promote integrin clustering, suggesting a potential link between substrate elasticity and responsive adhesion assembly.40 Furthermore, when macrophages were placed on different micropatterned substrata, podosome formation was actively encouraged on fibrinogen, whereas gelatin and a thin layer of collagen IV on glass were suppressive to podosome formation.31 Thus, different integrins engaged by each matrix might affect podosome formation, with fibrinogen favoring β3 integrins and β3 integrin being the most abundant β subunit in Mks, whereas collagen recruits β1 integrins, which are less abundant in platelets41 and likely Mks. Interestingly, podosome size and shape did not appear to vary on the different matrices or following inhibitor treatments. Thus, podosomes form with some consistent stoichiometry and arrangement of proteins and may be more of a continuous network than individual structures, as indicated also by superresolution microscopy.20
Although Mks can make podosomes on multiple types of matrix, additional factors such as SDF, which plays an important role in Mk maturation and migration, could regulate their formation.22 Indeed, Mks formed more podosomes in the presence of SDF-1α, while spreading was unaffected (Figure 2). This indicates that SDF-1α induces podosome formation and may contribute to Mk migration induced by a chemotactic gradient of SDF-1α.
The spatial localization of podosomes is dependent on the matrix, because in contrast to uniform thin fibrinogen, where podosomes were more or less uniformly distributed, Mks formed podosomes along collagen fibers in a linear fashion. Not only did matrix affect the position and density of podosomes, but it also affected their lifetime quite dramatically. Labernadie et al31 found that macrophage podosomes either avoided or collected on top of various micropatterns in matrix, but to our knowledge this is the first report of podosomes preferentially aligning along collagen fibers. Similar structures were recently described in fibroblasts as linear invadosomes, which formed along collagen I fibers.42 The distribution of fibrinogen and collagen in bone marrow is very diverse; collagen is present in the entire bone marrow,43 whereas fibrinogen is only located at the vascular sinusoid.27 This could have profound affects on the function of podosomes. For example, linear podosome structures could encourage not just adhesion but also guidance clues for protrusion, migration, as well as degradation hotspots within Mks.
It is still a subject of debate whether invadopodia and podosomes are distinct or the same structures.12,39,44 Our data demonstrate the fundamental requirement for both actin polymerization and the WASp-Arp2/3 complex pathway for podosome formation and maintenance. We thus show that Mks form podosomes by similar mechanisms as other cell types.29,45-47 Interestingly, the inhibition of MMP or myosin IIA or loss of the myosin II heavy chain MYH9 had no significant effect on podosome formation. This provides further evidence that podosomes are distinct from invadopodia, which are dependent on MMP activity, or focal adhesions, which require myosin IIA activity.13,31 We suggest that protease dependence might be one way to distinguish between invadopodia and podosomes, with the main architecture of podosomes being insensitive to protease inhibition, whereas invadopodia do not assemble in the presence of MMP inhibitors.13,35
Despite their MMP-independent formation, podosomes are associated with degradation of ECM.12 Our data clearly demonstrate that Mk podosomes can degrade ECM proteins, and that on fibrinogen this degradation is MMP and myosin IIA dependent. Our results agree with other reports showing MMP and myosin IIA involvement in podosome-driven degradation.11,16 Unfortunately, we could not reliably detect podosome driven proteolysis of collagen, because Mks seeded on a fluorescein-isothiocyanate-labeled gelatin substratum were not able to attach in a sufficient number to allow quantification (data not shown). In addition, Alexa 488-labeled Horm collagen did not form a monolayer, which made the quantification of degradation technically unreliable. However, it is likely that Mks do possess collagenase activity, because it was shown by Lane et al48 that they express MMP-9, and our serial analysis of gene expression database identified expression of MMP-14, MMP-24, MMP-25, and MMP-9.48
For the first time in Mks, we observed abundant formation of podosomes and actin-rich protrusions crossing a native basement membrane. Furthermore, the crossing of these actin protrusions was MMP dependent, implying the need for Mk-driven matrix degradation. Strikingly, the loss of podosomes caused by inhibition of the Arp2/3 complex or the deficiency in WASp resulted in a significant reduction of the percentage of protrusions across the basement membrane. Interestingly myosin IIA inhibition indicated that myosin-mediated contractility played no role in protrusion formation, suggesting that manipulation of the matrix through contraction forces was not required.
Our data clearly link podosomes, degradation of ECM proteins, and protrusions across a basement membrane. This link implies that podosomes could contribute to effective delivery of platelets into the bloodstream during proplatelet formation. As such, it is tempting to hypothesize that the lack of podosomes in Wiskott-Aldrich syndrome patients49 could contribute to the thrombocytopenia associated with this disorder and the accumulation of platelets in the bone marrow of WASp−/− mice.7 Our study illuminates the role of podosomes in Mks and extends the knowledge of their dynamics related to the underlying substrate. Further investigations are needed to understand these complex structures and their role in migration, adhesion, and proplatelet formation.
The online version of this article contains a data supplement.
There is an Inside Blood commentary on this article in this issue.
The publication costs of this article were defrayed in part by page charge payment. Therefore, and solely to indicate this fact, this article is hereby marked “advertisement” in accordance with 18 USC section 1734.
Acknowledgments
The authors thank David Strachan for help in design of ImageJ plugins for image analysis, Margaret O’Prey and Kurt Anderson and the Beatson Imaging facility for technical help, Gabriela Kalna for help and advice with statistical analysis, and the Glasgow Experimental Cancer Medicine Centre for human samples.
This work was funded by the British Heart Foundation (FS/09/034/27756) (H.S., L.M.M., S.G.T., and S.P.W.), by a core grant from Cancer Research UK (L.M.M.), by the Wellcome Trust and GOSHCC (A.J.T.), by Cancer Research UK programme grant C11074/A11008 (T.L.H.), and Cell sorting grant KKL501 (T.L.H.).
Authorship
Contribution: H.S. performed most of the experiments, wrote the paper, and analyzed the data; S.C. performed some of the experiments and wrote the paper; A.S., A.M., and M.V. performed some of the experiments; J.M., C.L., and C.G. contributed vital reagents; M.B. contributed vital reagents and performed some of the experiments; A.J.T., T.L.H., and G.E.J. contributed vital reagents and contributed to manuscript writing and study conception; S.G.T. and S.P.W. contributed to manuscript writing, study conception, and design; and L.M.M. conceived the study and wrote the manuscript.
Conflict-of-interest disclosure: The authors declare no competing financial interests.
Correspondence: Laura M. Machesky, The Beatson Institute for Cancer Research, Glasgow University College of Medical Veterinary and Life Sciences, Garscube Estate, Switchback Rd, Glasgow, G61 1BD, UK; e-mail: l.machesky@beatson.gla.ac.uk.

