Abstract
The diagnosis of heparin-induced thrombocytopenia (HIT) is challenging due to the overlap of its clinical features with other entities, variable specificity of ELISA-based tests, poor availability of functional tests such as the serotonin release assay (SRA) and suboptimal positive predictive values of pre-test probability clinical scoring models, such as the 4T and Lillo-Le Louėt models. Improved diagnostic tools are desirable to guide early therapeutic decisions in patients with suspected HIT and to reduce inappropriate use of alternative anticoagulants. The HIT Expert Probability (HEP) Score, a pre-test probability clinical scoring model for HIT based on broad expert opinion, has recently been proposed to improve the diagnosis of HIT compared to the 4T score. We sought to externally and prospectively validate the HEP score.
Pre-test probability of HIT was prospectively assessed for 51 consecutive patients referred to the Cleveland Clinic Vascular Medicine Consultative Service for evaluation of possible HIT between August 1, 2012 and February 1, 2013. Electronic medical records were reviewed to obtain clinical, biochemical (including IgG specific HIT ELISA and SRA tests) and imaging data, and two Vascular Medicine fellows independently applied the 4T and HEP scores for each patient. Two independent HIT expert adjudicators rendered a diagnosis of HIT likely or unlikely. Both scorers and adjudicators were blinded to the Results of HIT laboratory testing, consultative service inputs and scores generated by other raters.
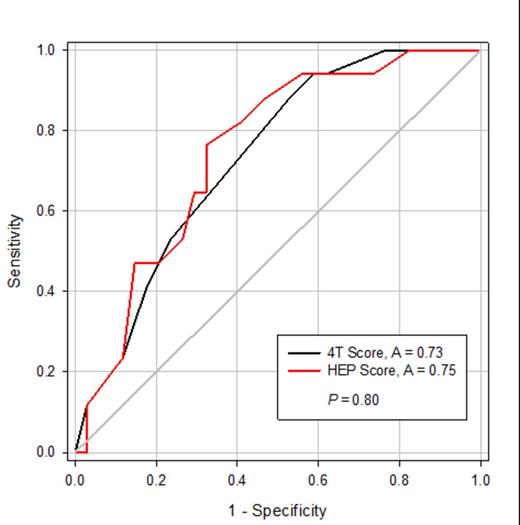
The median 4T and HEP scores were 4.5 [range 3.0, 6.0] and 5 [range 3.0, 8.5], respectively. Interobserver agreement was lower for the HEP Score compared to 4T score, intraclass correlation coefficient: 0.50 (95% CI 0.16–0.85) vs. 0.69 (0.54–0.86). There were no significant differences between area under receiver-operating characteristics curves of 4T and HEP score against HIT ELISA testing (0.62 vs. 0.58, P = 0.62), SRA (0.74 vs. 0.73, P = 0.97), expert panel diagnosis (0.71 vs. 0.79, P = 0.20), concordant HIT ELISA and SRA (0.76 vs. 0.72, P = 0.65), and positive SRA or positive HIT ELSA with HIT likely expert panel diagnosis (0.73 vs. 0.75, P = 0.80). The HEP score model was 100% sensitive and 17% specific for determining the presence of HIT as defined by positive SRA or positive HIT ELISA with HIT likely expert panel diagnosis compared to 4T score (sensitivity, 94%; specificity 38%) (Figure 1, Table 1).
Receiver Operating Characteristics (ROC) curve of the 4T and HEP scores for determining the presence of HIT (defined by positive SRA or positive HIT ELISA with HIT likely expert panel diagnosis). A, area under the ROC curve
Receiver Operating Characteristics (ROC) curve of the 4T and HEP scores for determining the presence of HIT (defined by positive SRA or positive HIT ELISA with HIT likely expert panel diagnosis). A, area under the ROC curve
Operating characteristics of the scoring models
| Model . | Cut-off . | Sensitivity (95% CI) . | Specificity (95% CI) . | PPV (95% CI) . | NPV (95% CI) . | LR+ (95% CI) . | LR- (95% CI) . | Number of subjects below cut-off (%) . |
|---|---|---|---|---|---|---|---|---|
| 4T | ≥ 4 | 0.94 (0.82-1.00) | 0.38 (0.21-0.54) | 0.43 (0.27-0.59) | 0.92 (0.79-1.00) | 1.52 (1.14-2.03) | 0.15 (0.02-1.05) | 37(72.5) |
| HEP score | ≥ 2 | 1.00 (1.00-1.00) | 0.17 (0.04-0.30) | 0.37 (0.23-0.51) | 1.00 (1.00-1.00) | 1.21 (1.04-1.41) | 0 | 45(88.2) |
| HEP score | ≥ 5 | 0.82 (0.64-1.00) | 0.58 (0.42-0.75) | 0.50 (0.31-0.68) | 0.87 (0.73-1.00) | 2.00 (1.26-3.16) | 0.30 (0.10-0.87) | 28(54.9) |
Abbreviations: PPV, positive predictive value; NPV, negative predictive value; LR+, positive likelihood ratio; LR-, negative likelihood ratio.
The HEP and 4T scores are excellent screening pre-test probability models for HIT, however, in this prospective validation study, test characteristics for the diagnosis of HIT based on confirmatory laboratory testing and expert opinion are similar. Given the complexity of the HEP scoring model compared to that of the 4T model, further validation of the HEP score is warranted prior to widespread acceptance.
Kim:Philips US: Consultancy; GE: Research Funding.
Author notes
Asterisk with author names denotes non-ASH members.


