Abstract
It is becoming more evident that the bone marrow micro-environment (ME) plays an important role in MM development, progression and treatment response. Studies of the bone ME have largely been limited to in-vitro differentiated cellular subsets. Removing the cells from the from their physiologic cellular environment and manipulating them over an extended period inducing artificial changes results in a significant bias and thus severely limits the applicability of conclusion drawn from those systems to the primary unaltered bone marrow.
In order to identify differences between the bone marrow ME of healthy donors and patients with MM we subjected whole BMBx from 378 untreated MM patients and 48 NL subjects, which had been snap frozen immediately after they were taken from the patients, to GEP analysis. Since whole bone marrow biopsies also include plasma cells (PC) we selected probe sets that are unique to the non-PC bone marrow ME. 783 probe sets were selected for having a log2 transformed mean expression > 8 in RNBX (in any of the 7 molecular subgroups CD1, CD2, MF, MS, HY, PR and LB) and < 8 in RNAS (in all molecular subgroups).
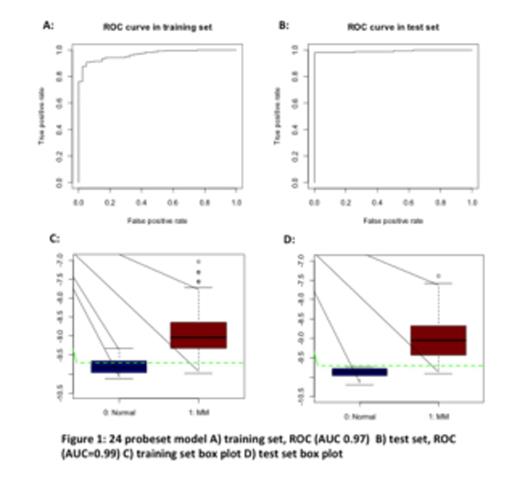
True and predicted Normal and MM samples by 24-probes score in the test set. 133/136 (98%) of MM patients and 8/8 (100%) of Normal patients were classified correctly.
| . | Predicted Normal . | Predicted MM . |
|---|---|---|
| True Normal | 8 | 0 |
| True MM | 3 | 133 |
| . | Predicted Normal . | Predicted MM . |
|---|---|---|
| True Normal | 8 | 0 |
| True MM | 3 | 133 |
We hypothesized that, upon achieving CR, the ME signature normalizes gradually reflecting the diminishing submicroscopic tumor burden and MM-inflicted ME alteration. Therefore, we applied the GEP24 model to 428 CR samples treated with Total Therapy 2 and 3 (TT2, TT3). The time course of sampling from onset of CR with annotations of normalized CR (NL-CR) and non-normalized CR (non-NL-CR) is depicted in Figure 4. Within the 1st year of CR, 14% of patients qualified for NL-CR; the corresponding values for years 2, 3 and 4 were 18%, 19%, and 20%, respectively. Normalization of the bone marrow ME was independent of GEP70 defined risk. Investigation of random biopsies from patients with asymptomatic MM (AMM) and monoclonal gammopathy of undetermined significance (MGUS) revealed a distinct stepwise shift of 24-gene score distributions with the transition from NL to MGUS to AMM and ultimately MM (Figure 5). Patients in CR had similar distributions of the 24-gene score as patients with AMM.
We conclude that ME GEP provides important clues to MM biology and therapeutic response that has now been quantitated for the first time. Normalization of the bone marrow ME could predict for recovery of normal hematopoiesis. Results will be presented as to whether NL-CR status can serve as a surrogate marker for long-term disease control and cure that can aid in guiding the length of post-CR maintenance therapy. Investigations are also in progress to determine whether ME GEP can capture MDS-associated alterations and thus help in quantitating the risk of such treatment sequelae.
No relevant conflicts of interest to declare.
Author notes
Asterisk with author names denotes non-ASH members.


