Abstract
Metabolomics is an essential tool for Translational Medicine, with a holistic non targeted approach, which provides information from the metabolic profile that can be used as a potential biomarker for a certain feature. The identification of biomarker profiles can be translated into simplified tests for the early diagnosis of diseases such as graft-versus-host disease (GVHD).
To evaluate the feasibility of a diagnostic protocol for chronic GVHD (cGVHD) based on the metabolic profile of blood serum from patients (pts) submitted to hematopoietic stem cell transplantation (HSCT).
The study included a prospective, nested cohort of 41 adult pts who had undergone first full-match allogeneic HSCT at Hospital de Cl’nicas/ University of Campinas between August, 2011-January, 2013 and had signed the Consent Form. Blood serum samples were prospectively collected on the day of hospitalization (D-8), day of transplantation (D0), NADIR phase (D+10) and D+100 post-HSCT. The Nuclear Magnetic Resonance (NMR)-based metabolomic experiments were performed at the Brazilian Biosciences National Laboratory (LNBio/CNPEM). Samples were previously filtered on a 3 kDa cut off filter, diluted 3X on 100 mM phosphate buffer pH 7.4, referenced with 10% D2O and 0.5 mM DSS (4,4-dimethyl-4-silapentane-1-sulfonic acid) for further absolute quantification of metabolites. The acquisition of 1D spectra was performed on a Agilent/Varian INOVA spectrometer operating at 1H resonance frequency of 600MHz. The spectra processing, identification and quantification of metabolites were performed by using the application package Chenomx NMR Suite and the target profiling approach (Chenomx, Inc). Samples from pts who developed chronic GVHD, at anytime, were marked as “cGVHD group”, and those who did not develop chronic GVHD, “cGVHD-free group” . Blood samples from pts who died up to 200 days after HSCT and did not develop chronic GVHD were excluded from the analysis, as were also all samples from pts whose sample collection was lacking at least in one period. T-tests (p<0.05) were applied at each sampling time in order to select metabolites and perform Principal Component Analysis (PCA), hierarchical clustering and calculate Receiver Operating Characteristic (ROC) curve for cGVHD diagnosis model using the software Pirouette¨ 4.0 (Infometrix, Inc) and the web tools MetaboAnalyst 2.0 and ROCCET.
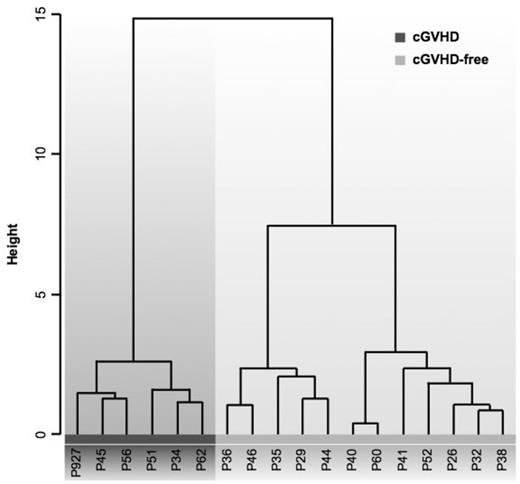
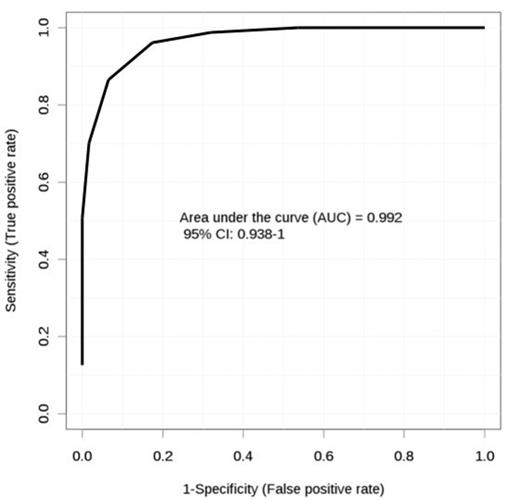
Median age was 41(18-69) years old and 61% were male. 18/41(44%) pts matched the inclusion criteria for the study. 6/18 (33%) pts had undergone cGVHD therapy. Seventy-three metabolites were identified and quantified in the blood serum samples. 8 metabolites were selected by T-test application at each studied time (2 metabolites from D-8, 2 from D0, 3 from D+10 and 1 from D+100). Using the selected metabolites the PCA showed clear separation between pts from “cGVHD” and “cGVHD-free” groups as well as hierarchical clustering (Fig. 1), confirmed by ROC analysis as a high sensitivity and specificity model for cGVHD diagnosis (AUC 0.99 and CI 0.93-1.00) (Fig. 2).
Clustering result shown as dendrogram (distance measure using Pearson, and clustering algorithm using Ward). P#: patient ID in this study; red: GVHD group; green: GVHD-free group.
Clustering result shown as dendrogram (distance measure using Pearson, and clustering algorithm using Ward). P#: patient ID in this study; red: GVHD group; green: GVHD-free group.
Multivariate ROC analyses by Support Vector Machine (SVM). Monte-Carlo cross validation (MCCV) with multiple iterations are employed to compute ROC curves and to calculate confidence intervals of their AUC.
Multivariate ROC analyses by Support Vector Machine (SVM). Monte-Carlo cross validation (MCCV) with multiple iterations are employed to compute ROC curves and to calculate confidence intervals of their AUC.
Metabolic differences were found in both studied groups. These differences may be used as a biomarker profile for cGVHD diagnosis up 100 days post-HSCT. Our results demonstrated that the statistical model using combined prospective time-series analysis is a powerful metabolomic model for early cGVHD diagnosis.
Alborghetti:Sao Paulo Research Foundation: Research Funding. da Silva:Coordination for the Improvement of Higher Education Personnel (CAPES): Research Funding.
Author notes
Asterisk with author names denotes non-ASH members.


