Abstract
There is still a need for a general test easily implementable and widely available that may be used to screen all patients on DOACs. A recent study has suggested that the dilute Russell Viper Venom Time (DRVV-T) could be used for the monitoring of DOACs but these results have been generated in vitro.
The primary objective of this study is to analyse and compare the results obtained with the DRVV Screen and Confirm tests to the plasma drug levels measured by LC-MS/MS. We also aimed at proposing specific cut-off associated with supratherapeutic levels at Ctrough. Finally, a comparison of our results with those obtained with PT for rivaroxaban and aPTT for dabigatran is also provided.
Thirty-two rivaroxaban and 31 dabigatran platelet poor plasma samples from real-life patients were included in the study. Dilute Russell's Viper Venom time was measured using STA®-Staclot®DRVV Screen and Confirm reagents. Prothrombin Time and aPTT have been performed with Triniclot PT Excel S® and RecombiPlastin 2G® and with STA®C.K. Prest and SynthasIL®, respectively. The Hemoclot Thrombin Inhibitor® and the Biophen DiXaI® have been performed to estimate plasma concentration of dabigatran and rivaroxaban, respectively. All methodologies were performed on a STA-R Evolution® analyser according with the recommendation of the manufacturer, except for RecombiPlastin 2G® which were performed on an ACL-TOP®. All of these tests have been performed according to the recommendations of the manufacturer.
The reference LC-MS/MS measurement of plasma drug concentrations were validated according to FDA Guidelines for Industry for Bioanalytical Method (for rivaroxaban) and to the Validation European Medicines Agency guidelines (for dabigatran).
The plasma concentrations range from 6 to 426ng/mL for rivaroxaban and from 0 to 386ng/mL for dabigatran as determined by LC-MS/MS.
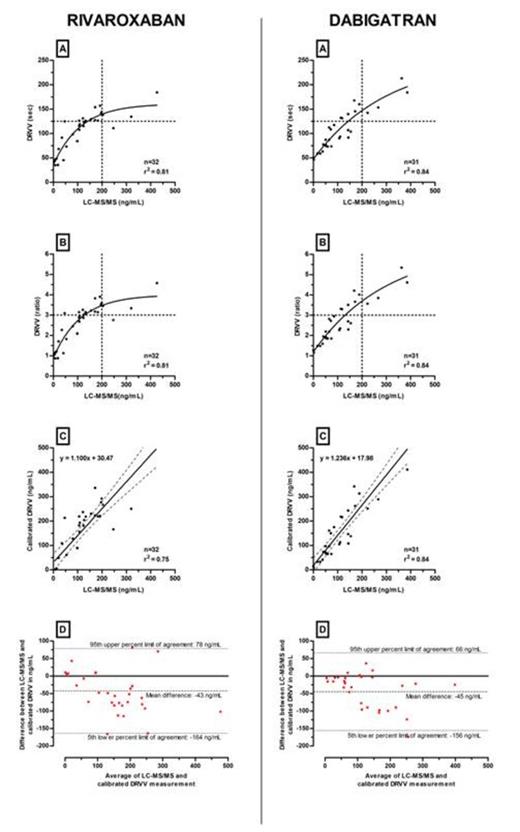
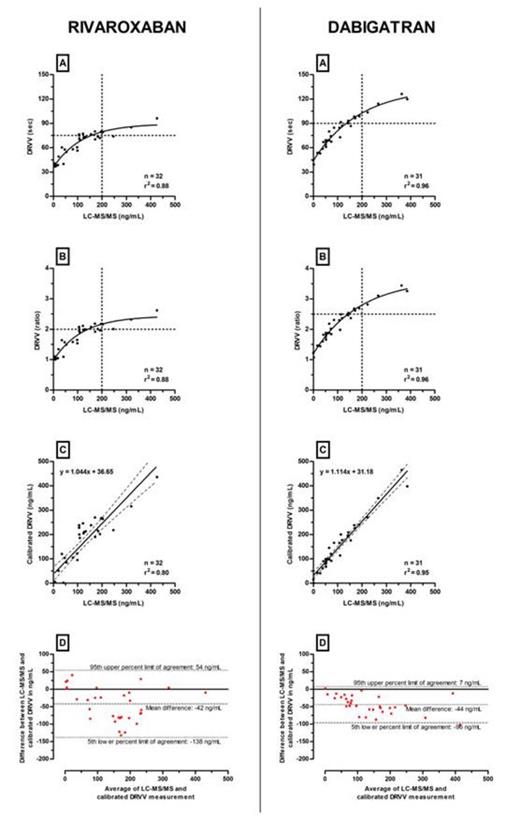
Tables 1 and 2 summarize Spearman correlations and Bland-Atlman analyses for rivaroxaban and dabigatran, respectively. Figures 1 and 2 provide the results of STA®-Staclot®DRVV Screen and Confirm versus LC-MS/MS measurements. Bland-Altman graphs are also provided.
STA®-Staclot®DRVV-Screen and Confirm shows a better correlation than PT or aPTT. Bland-Altman analyses reveal an overestimation of approximately 40ng/mL and large 5th-95th limits of agreement with both STA®-Staclot®DRVV-Screen and Confirm.
Specific cut-offs associated with supratherapeutic level (>200ng/mL) at Ctrough have been defined. For STA®-Staclot®DRVV-Screen, results below 125 seconds or below a ratio of 3 could exclude plasma concentrations >200ng/mL for rivaroxaban and dabigatran (Figure 1 - A and B). For STA®-Staclot®DRVV-Confirm, cut-offs must be adapted independently (Figure 2 - A and B). Results below 75 seconds or below a ratio of 2, could exclude rivaroxaban plasma concentrations >200ng/mL. For dabigatran, the threshold could be defined at 90 seconds or at a ratio of 2.5.
Thanks to its good correlation with plasma drug level, DRVVT can be more informative than PT and aPTT, to exclude supra-therapeutic level of rivaroxaban and dabigatran at Ctrough. However, due to overestimations in plasma drug level, it cannot be recommended to accurately estimate plasma drug concentrations which require more specific coagulation assays or LC-MS/MS measurements.
| . | Reference liquid chromatography coupled to tandem mass spectrometry . | |
|---|---|---|
| . | Spearman Correlation: rs (95%CI) . | Bland-Altman analyses: mean difference (95% limit of agreement) in ng/mL . |
| Biophen Direct Factor Xa Inhibitor® (DiXaI) | 0.91 (0.81-0.96) | -8 (-79 to 63) |
| Calibrated STA®-Staclot® DRVV-Screen | 0.87 (0.75-0.94) | -43 (-164 to 78) |
| Calibrated STA®-Staclot® DRVV-Confirm | 0.88 (0.76-0.94) | -42 (-138 to 54) |
| Triniclot PT Excel S® | 0.83 (0.67-0.92) | -12 (-159 to 134) |
| HemosIL RecombiPlasTin 2G® | 0.86 (0.72-0.93) | -82 (-204 to 41) |
| . | Reference liquid chromatography coupled to tandem mass spectrometry . | |
|---|---|---|
| . | Spearman Correlation: rs (95%CI) . | Bland-Altman analyses: mean difference (95% limit of agreement) in ng/mL . |
| Hemoclot Thrombin Inhibitor® | 0.98 (0.96-0.99) | -6 (-70 to 58) |
| Calibrated STA®-Staclot® DRVV-Screen | 0.91 (0.81-0.96) | -45 (-156 to 66) |
| Calibrated STA®-Staclot® DRVV-Confirm | 0.97 (0.93-0.99) | -44 (-96 to 7) |
| STA®-C.K.Prest | 0.84 (0.68-0.92) | -23 (-206 to 159) |
| HemosIL SynthasIL® | 0.89 (0.79-0.95) | -28 (-211 to 155) |
No relevant conflicts of interest to declare.
Author notes
Asterisk with author names denotes non-ASH members.


