Thanks to their predictable pharmacokinetic profile, frequent monitoring of direct oral anticoagulants (DOACs) effects or levels is not recommended in the majority of patients, but it is anticipated that a non-negligible proportion of patients will achieve either insufficient or supra-therapeutic levels of the drug. Moreover, in pharmacokinetic studies with dabigatran etexilate (DE) and rivaroxaban marked interindividual variation in drug levels has been observed. The question about the most appropriate test to assess the treatment response has already been addressed and it was additionally stated that the interval between the drug intake and the blood sampling is mandatory. However, no information regarding the most appropriate delay for monitoring is currently provided. Therefore, the objective of this work is to evaluate the interindividual response at different time points in order to identify which interval between the drug intake and the blood sampling should be preferred for the assessment of the individual response.
Series of patients treated with rivaroxaban (AF n=25; VTE n=8) or DE (AF n=18) were included in the study. For each patient, blood was taken at 3 different intervals:
- At Ctrough
o 22 to 26 hours after the last intake of rivaroxaban
o 11 to 13 hours after the last intake of DE
- Two hours and three hours after drug administration
For rivaroxaban samples, prothrombin time was performed with Triniclot PT Excel S®, RecombiPlasTin 2G® and Innovin®. Rivaroxaban plasma concentration was estimated with the Biophen Direct Factor Xa Inhibitor®.
For DE samples, activated Partial Thromboplastin Time (aPTT) was perfomed with STA®-C.K.Prest and SynthasIL®. Plasma dabigatran concentration was estimated with the Hemoclot Thrombin Inhibitor®.
Wilcoxon analyses were performed between the different blood sampling intervals. Test for effective pairing was computed with the Spearman non-parametric correlation coefficient with a one-tailed P value.
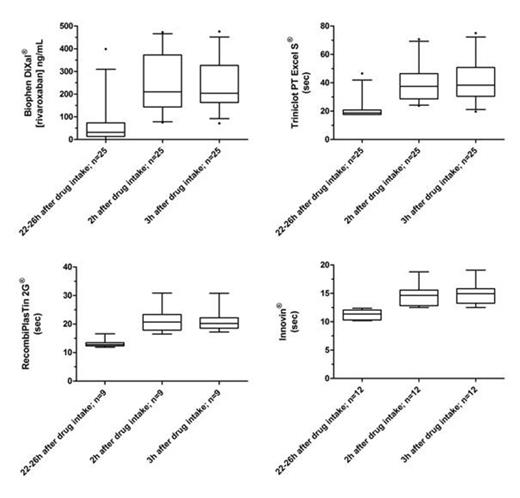
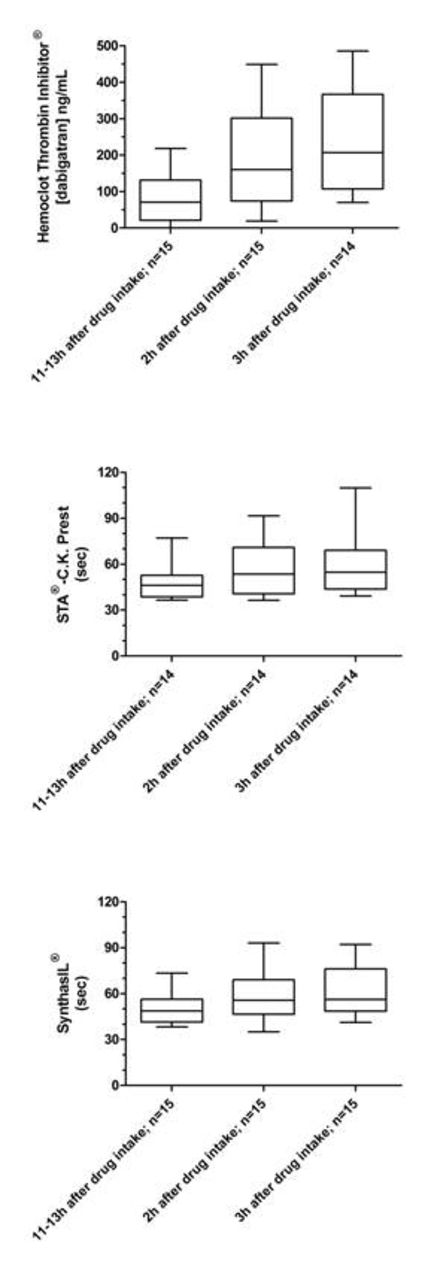
Table 1 shows the minimum, the median and the maximum obtained with each tests at each time sampling. Figure 1 provides the box-plot and whiskers (min to max) of the different assays performed on rivaroxaban samples at the different time sampling. Figure 2 provides the box-plot and whiskers (min to max) of the different assays performed on dabigatran samples at the different time sampling.
Our results confirm that there is a non-negligible interindividual variation in drug levels at same time points. When comparing intervals, whatever the test used in our study, we can see that results at Ctrough clearly differ from results obtained 2 or 3 hours after the intake of the drug (Table 1). Interestingly, for rivaroxaban, the median after 2 or 3 hours are closely the same with similar 25th – 75th percentile values whatever the test. Based on our results, we can affirm that for the majority of patients in our study, the Cmax is reached within 2 to 3 hours after the intake. For dabigatran, the plasma concentration is higher at 3h than at 2 hours (Table 1). However, the power of the study is not sufficient to show a statistically significant effect. Interestingly, this phenomenon is not encountered with the aPTT. This may be due to the well-known flattening curve effect at these higher concentrations.
| Rivaroxaban | ||||
| Time after drug intake (h) | Minimum | Median | Maximum | |
| Biophen DiXaI® (ng/mL) | 22-26 | 0 | 32 | 399 |
| 2 | 75 | 210 | 473 | |
| 3 | 71 | 204 | 476 | |
| Triniclot PT Excel S® (sec) | 22-26 | 17.6 | 18.8 | 46.6 |
| 2 | 23.8 | 37.5 | 70.7 | |
| 3 | 19.7 | 38.3 | 75 | |
| RecombiPlasTin 2G® (sec) | 22-26 | 11.9 | 12.8 | 16.6 |
| 2 | 16.5 | 20.7 | 30.9 | |
| 3 | 17.2 | 20.2 | 30.8 | |
| Innovin® (sec) | 22-26 | 10.2 | 11.4 | 12.4 |
| 2 | 12.5 | 14.7 | 18.8 | |
| 3 | 12.5 | 15.0 | 19.1 | |
| Dabigatran | ||||
| Time after drug intake (h) | Minimum | Median | Maximum | |
| HTI (ng/mL) | 22-26 | 0 | 71 | 218 |
| 2 | 19 | 161 | 449 | |
| 3 | 70 | 207 | 486 | |
| SynthasIL® (sec) | 22-26 | 38.2 | 48.8 | 73.3 |
| 2 | 35.1 | 55.7 | 93 | |
| 3 | 41.3 | 56.3 | 92.2 | |
| STA®-C.K.Prest (sec) | 22-26 | 36.6 | 46.2 | 77.2 |
| 2 | 36.4 | 53.6 | 91.7 | |
| 3 | 39.3 | 54.7 | 109.8 | |
Based on our results, we can assert that it seems preferable to take the blood 3 hours after the last intake of DE to avoid missing the Cmax. For rivaroxaban, whatever the blood is taken 2 or 3 hours after the intake, results are similar. Therefore, we recommend to systematically performing blood sampling 3 hours after the intake of the drug to assess the maximal response at these treatments. Sampling at Ctrough is also required to evaluate the clearance. As a limitation, our results should be confirmed in larger cohort studies.
No relevant conflicts of interest to declare.


