Abstract
Follicular lymphoma is the second most common non-Hodgkin lymphoma subtype. PET-CT is a useful tool to evaluate staging and monitoring of follicular lymphoma. Calculation of maximal standardized uptake value (SUV max) is variable and related to the aggressiveness of lymphoma. In tumor cells, there is an increase in uptake and consumption of glucose. Therefore GLUT-1, a membranous glucose transporter, may have an impact on the SUV max. To our knowledge, data regarding eventual correlation between GLUT-1 and SUV in different subtypes of lymphoma is sparse (Hye Kyung Shim et al, Nuclear Medicine and Biology 2009; S. Hartmann et al, BMC Cancer 2012), especially in follicular lymphoma.
In addition, Ki67, a marker of cell proliferation is also linked to the metabolism of tumors cells. Only few studies have shown a correlation between SUV max and Ki-67 in follicular lymphoma (Tomas Papjik et al, European Journal of Haematology 2010; Yi shou et al, Journal of Cancer Research and Therapeutics 2012). Elsewhere, it was demonstrated that microenvironment composed of dendritic cells, macrophages, T cells and vascular endothelium play a key role in the prognosis of follicular lymphoma (Pedro Farinha et al, Blood 2005), it could have also an impact on SUV max.
The aim of our study was to identify histological markers involved in glucose metabolism, cell proliferation and microenvironment, influencing SUV max in follicular lymphoma.
Lymph node biopsies of 21 patients treated in our hematologic department at diagnosis and/ or relapse were retrospectively included. Patients underwent PET-CT and node biopsy simultaneously. Five histological markers (Ki67, GLUT 1, CD20 for B lymphocytes, CD3 for T lymphocytes, and CD68 for macrophages) were analyzed. Pathologists perform visually the immunostaining analysis without knowledge of the PET-CT results. Percentage of expression of immunological markers was compared with SUV max from the biopsy site. The correlation was analyzed using Spearman’s method to calculate the coefficient of correlation r.
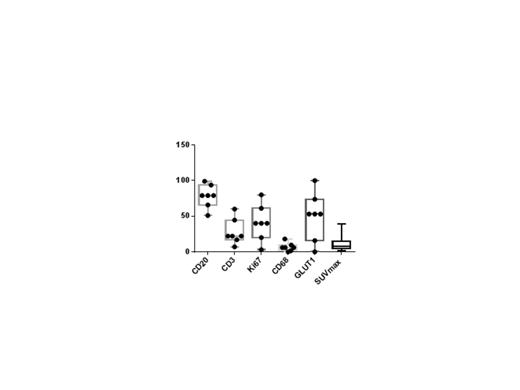
Ki-67 (median 40, range [3; 80]) and GLUT1 (median 53, range [0; 100]) were not related to the level of expression of the SUV max (respectively r = 0.3603 and p = 0.1086, r = 0.0215 and p = 0.9283). Concerning the microenvironment, CD68 (median 6, range [0; 18]) and CD3 (median 22, range [7; 60]) did not show any correlation (respectively r = 0.1370 and p = 0.5536, r = -0.2115 and p = 0.3708). Interestingly, percentage of CD20 expression (median 79, range [51; 99]) appears to be correlated significantly with the SUV max (r = 0.4924, p = 0.0274).
In this study, it was not possible to identify a specific histological marker influencing the SUV max. Otherwise, interest in glucose metabolism and particularly other isoforms of GLUT receptor or enzymes involved in the metabolism, like hexokinase, appears to be a promising track. Considering that CD20 stains B tumor cell and normal B lymphocyte in the tumor, it could be interesting to analyze the ratio of CD20/CD10, assuming that all tumor cells express CD10.
Distribution of values of histological markers and SUV max
Distribution of values of histological markers and SUV max
No relevant conflicts of interest to declare.
Author notes
Asterisk with author names denotes non-ASH members.


