Abstract
JAK2 V617F is the most common mutation in essential thrombocythemia (ET), occurring in approximately 50 % of cases. Second to JAK2 V617F is MPL W515K/L, accounting for about 10 % of cases. The molecular cause of the remaining ET cases is still largely unknown.
We sought to investigate JAK2 V617F-negative and MPL W515K/L-negative ET for regions of copy number variations (CNV) and loss of heterozygosity (LOH).
We studied blood or bone marrow samples from a series of 64 JAK2 V617F-negative and MPL W515K/L-negative ET cases. They were subjected to 2.7M SNP array by Affymetrix, which has 2,761,979 copy number markers including 400,103 SNP markers. The array data were analyzed for recurrent CNVs with Array Studio (OmicSoft), and for individual CNVs or recurrent LOHs (≥3 Mbs) with the Chromosome analysis suite (ChAS, Affymetrix).
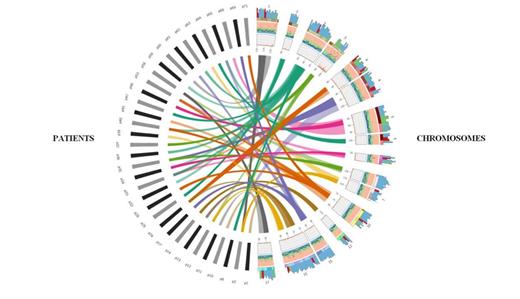
Only 8 recurrent gains were identified, in 5/64 patients. Interestingly, the most common gain, occurring in 5 cases was a gain of chr7 q22.3, including the gene encoding Nicotinamide phosphoribosyltransferase (NAMPT). NAMPT is known to be overexpressed in several cancers such as multiple myeloma. It catalyzes the rate-limiting step of the nicotinamide adenine dinucleotide (NAD+) biosynthesis pathway. It is also required for cell growth and survival. We checked in the 5 patients for NAMPT amplification by quantitative PCR (qPCR) on genomic DNA in comparison to controls and by normalizing to ALB and RPPH1. We were able to validate the gain in 2/5 patients. The gain in these 2 patients was demonstrated to be acquired by qPCR of NAMPT in buccal swab DNA. Other recurrent gains involved regions of chromosomes 2, 5, 7, 12, 13, and 22. These gains included, amongst others, LCP1 on chr13 q14.3 and CYTIP on chr2 q24.1, occurring in 2/64 and in 3/64 respectively. We also checked for non-recurrent gains and losses in our cohort. This analysis generated a total of 8 CNVs in 6 different patients, comprising 5 regional gains in chromosomes 2, 8, 12, and 15 and 3 regional losses in chromosomes 5, 8 and 11. The array data were also analyzed for recurrent LOHs on ChAS, yielding 17 recurrent copy neutral LOHs (CN-LOH) in 35 patients (circos plot). The most common CN-LOH region was on chromosome 3 appearing in 8 patients. Other CN-LOH regions involved chromosomes 1, 2, 3, 4, 5, 6, 7, 10, 12, 15, and 17 and they occurred in 2-5/64 patients. However, as small regions of CN-LOH can be constitutional, we suspect that most of these CN-LOH regions are not acquired. The largest region of CN-LOH observed was 12 Mbs in size.
Previous studies in unselected series of BCR-ABL1-negative myeloproliferative neoplasms have shown that copy number alterations are rare in ET as well as in polycythemia vera. In this series of 64 JAK2 V617F-negative and MPL W515K/L-negative ET patients we found recurrent gains not reported previously in the database of genomic variants in only 8% of patients, and small areas of CN-LOH in ∼55% of cases. However, most of the latter probably are constitutional. Our SNP array study provides further evidence that gains, losses or CN-LOH of small genomic regions do not play an essential role in the pathogenesis of the majority of JAK2 V617F-negative and MPL W515K/L-negative ET. However, the low frequency of megakaryocytes and unknown level of clonal involvement of the myeloid compartment in JAK2 V617F-negative and MPL W515K/L-negative ET bone marrow remain a caveat. Next generation sequencing technology is expected to bring new insights on the molecular pathogenesis of this elusive ET subset.
Left half represents a total of 35 patients carrying recurrent CN-LOHs and the right half represents the chromosomes and their associated properties. Right outermost layer depicts 1+log-gene density (min, 1; max 42) where cancer, OMIM and other genes are colored in red, blue and green respectively. Right middle and innermost layers designates SNP density (blue, values < 0,02; gray values, <0,06; red values >0,06; max scale 0,013) and absolute SNP numbers (min, 1; max, 12074) per windows of 50kb. Each 5Mb distance is marked with a tick underneath the innermost layer. Links from each chromosome are colored differently. Regions that are more confined on the same chromosome are least transparent and regions that are shared by more patients are drawn on top of lesser links.
No relevant conflicts of interest to declare.
Author notes
Asterisk with author names denotes non-ASH members.


