Key Points
Glucocorticoids downregulate PKM2 and metabolism in CLL cells, impairing access to bioenergetic programs needed to repair cell damage.
PPARα and fatty acid oxidation antagonists potentiate the cytotoxic effects of glucocorticoids.
Abstract
High-dose glucocorticoids (GCs) can be a useful treatment for aggressive forms of chronic lymphocytic leukemia (CLL). However, their mechanism of action is not well understood, and resistance to GCs is inevitable. In a minimal, serum-free culture system, the synthetic GC dexamethasone (DEX) was found to decrease the metabolic activity of CLL cells, indicated by down-regulation of pyruvate kinase M2 (PKM2) expression and activity, decreased levels of pyruvate and its metabolites, and loss of mitochondrial membrane potential. This metabolic restriction was associated with decreased size and death of some of the tumor cells in the population. Concomitant plasma membrane damage increased killing of CLL cells by DEX. However, the nuclear receptor peroxisome proliferator activated receptor α (PPARα), which regulates fatty acid oxidation, was also increased by DEX, and adipocyte-derived lipids, lipoproteins, and propionic acid protected CLL cells from DEX. PPARα and fatty acid oxidation enzyme inhibitors increased DEX-mediated killing of CLL cells in vitro and clearance of CLL xenografts in vivo. These findings suggest that GCs prevent tumor cells from generating the energy needed to repair membrane damage, fatty acid oxidation is a mechanism of resistance to GC-mediated cytotoxicity, and PPARα inhibition is a strategy to improve the therapeutic efficacy of GCs.
Introduction
Even with new therapeutic agents, the outcome remains poor for high-risk chronic lymphocytic leukemia (CLL) patients whose tumor cells have lost functional p53 or who relapse shortly after completing first-line therapy with fludarabine, cyclophosphamide, and rituximab.1,2 High doses of synthetic glucocorticoids (GCs) such as methylprednisolone or dexamethasone (DEX), with or without monoclonal antibodies such as ofatumumab, are among the most effective treatments for such patients.3 However, GC-based regimens are not curative, and resistance to GCs is inevitable with continued administration. Knowledge of how GCs exert their therapeutic effects is surprisingly incomplete, considering their long clinical history.4 A better understanding of the mechanism of action and nature of resistance is needed to improve the efficacy of GC therapy in CLL patients.
GCs are steroid hormones that are made by the adrenal cortex and affect a variety of cell functions. They inhibit glucose metabolism and promote fatty acid oxidation in many tissues during starvation and also have potent immunosuppressive properties.5 GCs bind to GC receptors (GRs), which are members of the nuclear receptor family of ligand-dependent transcription factors. Activation by ligands causes GRs to become phosphorylated and translocate to the nucleus where they bind GC response elements and mediate gene transcription. Ligand-activated GRs transactivate genes such as IκB that inhibit signaling pathways6 and also transrepress signaling through direct binding to kinases.7 GCs cause CLL cells to undergo apoptosis,8 but the processes that lead from GR phosphorylation to cell death are not fully understood. The studies in this paper were designed to provide more insight into the mechanisms of action of GCs in CLL.
Materials and methods
Antibodies and reagents
7-aminoactinomycin D (7-AAD) was obtained from Pharmingen (San Francisco, CA). Fatty acid–free bovine serum albumin, 2-mercaptoethanol (2-ME), mifepristone, 3,3′-dihexyloxacarbocyanine iodide [DiOC6(3)], propionic acid, ionomycin, GW6471 (peroxisome proliferator activated receptor α [PPARα] antagonist), and β-actin antibodies were from Sigma-Aldrich (St. Louis, MO). RPMI-1640, lipid-rich bovine albumin (AlbuMAXII), and Mitotracker red and green were from Invitrogen (Carlsbad, CA). Clinical grade DEX sodium phosphate (Omega, Montreal, QC, Canada), rituximab (Roche Canada, Mississauga, ON, Canada), and alemtuzumab (Genzyme Canada, Mississauga, ON, Canada) were purchased from the hospital pharmacy. Ofatumumab was obtained from GlaxoSmithKline (London, United Kingdom). Low-Tox-M rabbit complement was from Cedarlane (Burlington, ON, Canada). Antibodies against the phospho-(Ser211) GR and pyruvate kinase muscle isozyme (PKM2) were from Cell Signaling Technology (Beverly, MA), as were secondary horseradish peroxidase–conjugated anti-rabbit and anti-mouse antibodies (Cat. Nos. 7074 and 7076, respectively). PPARα antibodies were from Cayman Chemical Co. (Ann Arbor, MI). High-, low-, and very-low-density lipoproteins were from EMD Chemicals (San Diego, CA). MK886 and compound A (PPARα antagonists) were generous gifts from Inception Sciences (San Diego, CA), and CVT-4325 (GS449794, β-oxidation inhibitor) was a generous gift from Gilead Sciences (Foster City, CA).
CLL cell purification
CLL cells were isolated as previously described by negative selection from the blood of consenting patients,9 diagnosed by a persistent monoclonal expansion of CD19+CD5+IgMlo lymphocytes, and were untreated for ≥3 months. Patient characteristics are described in supplemental Table 1. Protocols were approved by the Sunnybrook Ethics Review Board. This study was conducted in accordance with the Declaration of Helsinki.
Cell culture
Unless otherwise specified, purified CLL cells were cultured at a concentration of 1 × 10⁶ cells/mL in RPMI-1640 medium supplemented with transferrin and 0.02% AlbuMAX II in 6- or 24-well plates (BD Labware) at 37°C in 5% CO2 for the times indicated in the figure legends.
Preparation of adipocytes and adipocyte-conditioned medium
OP-9 cells were maintained in OP-9 propagation medium consisting of α-minimum essential media, 20% fetal bovine serum (BioWhittaker, Walkersville, MD), 100 U/mL penicillin, and 100 mg/mL streptomycin (Wisent USA). The cells were replated every 3 days on growing to confluence. Adipocytes were obtained by the method of Wollins et al.10 OP-9 cells were grown to confluence in propagation media that was then replaced by stem cell medium (cES),11 consisting of advanced Dulbecco’s modified Eagle medium-F12, 15% KnockOut serum replacement, 1% Glutamax-1 (all from Invitrogen), 1% minimal essential media nonessential amino acids (Wisent USA), and 0.1 μM 2-ME. Within 3 to 4 days, >90% of OP-9 cells accumulate large lipid droplets visible in a light microscope (supplemental Figure 1C). To obtain adipocyte-conditioned medium (ACM), adipocytes were washed and incubated with fresh cES for 3 days. ACM was collected and heat inactivated at 60°C for 30 minutes.
Flow cytometry
Cell viability was measured by first washing in phosphate-buffered saline (PBS) and then staining with 3.5 μL of 7AAD for 10 minutes. Mitochondrial membrane potential was measured by staining with 0.2 nM of DiOC6(3) for 15 minutes at room temperature, followed by washing with PBS. Mitochondrial mass was measured by staining with 2 nM of MitoTracker green FM for 15 minutes at 37°C followed by washing with PBS. Ten thousand viable counts were then analyzed with a FACScan flow cytometer using Cellquest software (Becton Dickinson). Standardization of the flow cytometer was performed before each experiment using SpheroParticles (Spherotech, Chicago, IL).
Immunoblotting
Protein extraction and immunoblotting were performed as previously described.9 Proteins were resolved in 10% sodium dodecyl sulfate-polyacrylamide gel electrophoresis and transferred onto Immobilon-P transfer membranes (Millipore Corp., Billerica, MA). Western blot analysis was performed according to the manufacturers’ protocol for each antibody. Chemiluminescent signals were created with SupersignalWest Pico Luminal Enhancer and Stable Peroxide Solution (Pierce, Rockford, IL) and detected with a Syngene InGenius system (Syngene, Cambridge, United Kingdom). For additional signal, blots were stripped for 60 minutes at 37°C in Restore Western Blot stripping buffer (Pierce), washed twice in Tris-buffered saline plus 0.05% Tween-20 at room temperature, and reprobed as required. Densitometry was performed using Image J software. The densitometry value for each sample was normalized against the value for β-actin to obtain the intensities for phosphorylated-GR, PKM2, and PPARα reported in the figures.
Real-time polymerase chain reaction
RNA was prepared with the RNeasy mini kit (Qiagen, Valencia, CA), and cDNA was synthesized from 2 μg of RNA using Superscript III reverse transcriptase (Life Technologies, Invitrogen), according to the manufacturer’s instructions. PKM2, PPARα, PPARδ, pyruvate dehydrogenase kinase 4 (PDK4), and hypoxanthineguanine phosphoribosyl transferase (HPRT) transcripts were amplified with the following primers: PKM2 forward, GTCGAAGCCCCATAGTGAAG; reverse, ATGTCCTTCTCCGACACAGC, PPARα forward, CTGGAAGCTTTGGCTTTACG; reverse, ACCAGCTTGAGTCGAATCGT, PPARδ forward, CTCTATCGTCAACAAGGACG; reverse, GTCTTCTTGATCCGCTGCAT, PDK4 forward, CATACTCCACTGCACCAACG; reverse, CCTGCTTGGGATACACCAGT, and HPRT forward, GAGGATTTGGAAAGGGTGTT; reverse ACAATAGCTCTTCAGTCTGA. Polymerase chain reactions were carried out in a DNA engine Opticon System (MJ Research, Waltham, MA) and cycled 34 times after initial denaturation (95°C, 15 minutes) with the following parameters: denaturation at 94°C for 20 s, annealing of primers at 58°C for 20 s, and extension at 72°C for 20 s. mRNA abundance was evaluated by a standard amplification curve relating initial copy number to cycle number. Copy numbers were determined from 2 independent cDNA preparations for each sample. The final result was expressed as the relative fold change of the target gene to HPRT.
Sample preparation for nuclear magnetic resonance
To measure intracellular metabolite levels, 5 × 10⁷ CLL cells were pelleted, resuspended in 1 mL of ice cold PBS, transferred into a microfuge tube, and pelleted again. Pellets were extracted with methanol 3 times by adding 1 mL of 80% methanol at −80°C, vortexing, incubating on ice for 30 minutes, vortexing again, and then centrifuging for 30 minutes at 10 000 rpm at 4°C. Supernatants were then collected into 2-mL microfuge tubes, and the solvent was removed with a centrifugal evaporator (SpeedVac) at room temperature. Metabolite extracts were stored at −80°C until nuclear magnetic resonance (NMR) analysis.
1H NMR
The extracts were taken up in 120 μL of NMR buffer (50 mM Na2HPO4, 0.1% NaN3 in D2O, pH 7.0; uncorrected). 4,4-dimethyl-4-silapentane-1-sulfonic acid (0.5 mM) was added as an internal reference standard, and the sample was transferred to a 3-mm NMR tube. All NMR spectra were run on a Bruker Avance II 800MHz spectrometer equipped with a triple resonance cryoprobe. One-dimensional (1D) 1H NMR spectra were collected at 298 Kelvin with 128 scans using a 90° proton pulse and recycle delay of 2 s. A total of 32 000 points were collected over a spectral width of 12.8 kHz (16 ppm). Metabolites were identified and quantified using the Chenomx 7.1 NMR software suite (Chenomx, Edmonton, AB, Canada). Metabolite concentrations are reported as mean values ± standard deviation.
PK enzyme activity
Ten million CLL cells were pelleted by centrifugation for 1 minute at 3000g at 4°C, washed in 0.9% NaCl, pelleted again, and stored in liquid nitrogen. The assay was conducted according to the protocol of Janke et al.12,13 ATP produced by PK from ADP and phosphoenolpyruvate was fed into the glycerol-3-phosphate cycling assay by glycerol kinase. Optimal conditions for measuring glycerol-3-phosphate levels to indicate maximal PK activity included a cell dilution factor (CDF) of 150, pH 7.0, and 60-minute incubation time. PK enzymatic activities were measured in 12 technical replicates for each sample.
Combination index calculation
Combination index (CI) values were calculated using CompuSyn software (www.combosyn.com). The dose-effect relationship for each single drug was determined using median drug effect analysis via serial dilution. CI was used to express synergism (CI < 1), additive effect (CI = 1), or antagonism (CI > 1).14
CLL xenograft model
NOD-SCIDγcnull mice were irradiated (245 rad) and then injected intraperitoneally with 2.5 × 10⁸ thawed CLL splenocytes obtained at the time of therapeutic splenectomy. Mice were injected biweekly intraperitoneally with 700 μL of plasma pooled from 8 ot 10 patients with white cell counts >100 × 106 cells/mL. Single cell suspensions from spleens and peritoneal cavities were counted in a hemocytometer and analyzed by multicolor fluorescence-activated cell sorter to assess engraftment of CLL cells, as before.15,16 All animal experiments were approved by the Sunnybrook Research Institute Animal Care Committee.
Statistical analysis
Student t test and paired t tests were used to determine P values. Best-fit lines were determined by least squares regression.
Results
DEX decreases the size of circulating CLL cells
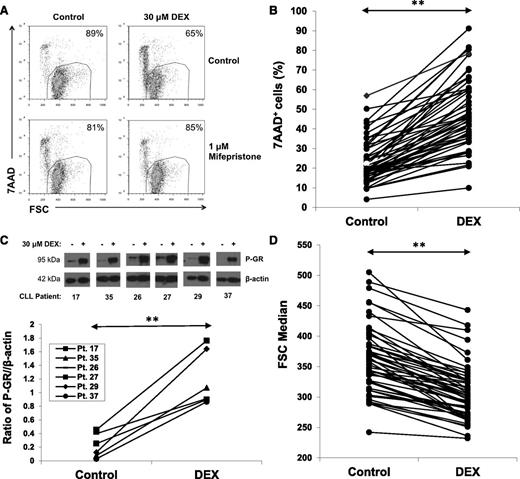
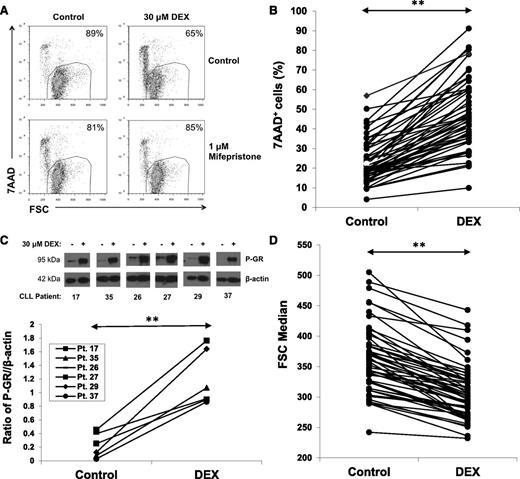
DEX (30 μM) killed purified CLL cells within 48 hours in serum-free conditions consisting of RPMI-1640 media with 0.02% lipid-rich albumin. An example (Figure 1A, upper) and results for 52 patient samples (Figure 1B) are shown. The dose of DEX was chosen to approximate plasma levels in patients treated with high-dose GCs.3 Cell death was prevented by the GR antagonist mifepristone17 (Figure 1A, lower), suggesting it was a direct, transcriptional effect of DEX.
Effect of DEX on circulating CLL cells. (A) CLL cells were purified and cultured for 48 hours with or without DEX (30 μM) in serum-free media (RPMI-1640 with transferrin and 0.02% albumax) in the presence or absence of the GR antagonist mifepristone (1 μM). After 48 hours, percentages of viable 7AAD− cells that exclude 7AAD were determined by flow cytometry and are shown in the right upper corners of the dot-plots. Mifepristone prevented DEX-induced cell death. (B) Results for 52 different CLL patient samples are shown. Each line represents percentages of 7AAD+ cells after 48 hours in the presence or absence of DEX. (C) Circulating CLL cells from the indicated patients were cultured for 4 hours with or without DEX. Levels of Ser211 phosphorylated GR (P-GR) were measured by immunoblotting with β-actin as a loading control and quantified by densitometry. (D) Summary of forward scatter median measurements at 48 hours by flow cytometry indicating that DEX significantly decreased the size of circulating CLL cells. **P < .01.
Effect of DEX on circulating CLL cells. (A) CLL cells were purified and cultured for 48 hours with or without DEX (30 μM) in serum-free media (RPMI-1640 with transferrin and 0.02% albumax) in the presence or absence of the GR antagonist mifepristone (1 μM). After 48 hours, percentages of viable 7AAD− cells that exclude 7AAD were determined by flow cytometry and are shown in the right upper corners of the dot-plots. Mifepristone prevented DEX-induced cell death. (B) Results for 52 different CLL patient samples are shown. Each line represents percentages of 7AAD+ cells after 48 hours in the presence or absence of DEX. (C) Circulating CLL cells from the indicated patients were cultured for 4 hours with or without DEX. Levels of Ser211 phosphorylated GR (P-GR) were measured by immunoblotting with β-actin as a loading control and quantified by densitometry. (D) Summary of forward scatter median measurements at 48 hours by flow cytometry indicating that DEX significantly decreased the size of circulating CLL cells. **P < .01.
The number of CLL cells killed by DEX exhibited interpatient variability (Figure 1B), which could not be correlated with the clinical characteristics of the patients (supplemental Table 1). In all cases, GR was phosphorylated by DEX, suggesting this variability was not due to differences in activation of the GR (Figure 1C). Despite the fact that many DEX-treated cells remained alive, as measured by their ability to exclude the DNA dye 7AAD, in all cases they became smaller, as measured by the forward scatter parameter of flow cytometry (Figure 1D).
DEX decreases mitochondrial membrane potential and intracellular metabolites
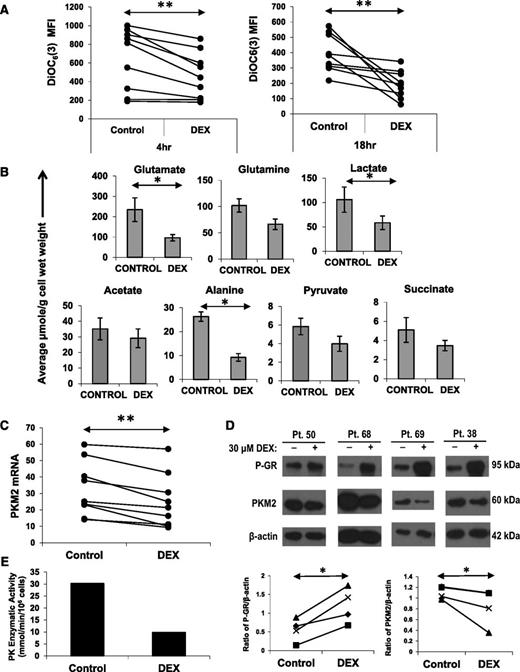
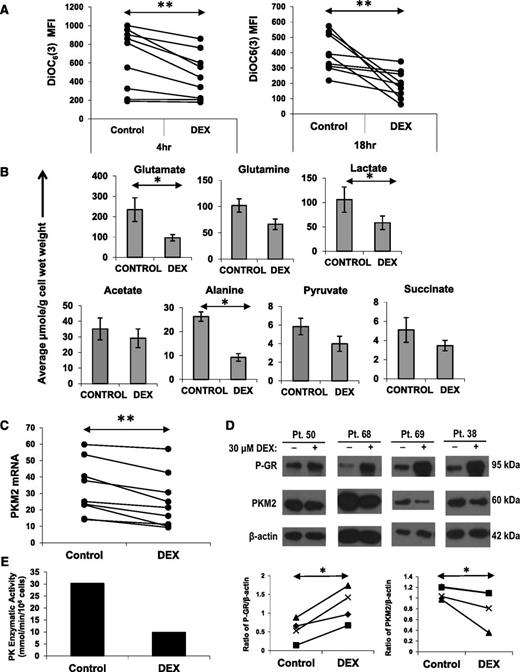
Cell size is a reflection of metabolic activity.18 Accordingly, the decrease in size suggested that metabolism of CLL cells had been impaired by DEX. Cellular metabolism is supported by mitochondria and requires the generation and maintenance of a mitochondrial membrane potential that can be measured by flow cytometry with the cell-permeable, green fluorescent dye DiOC6(3). As early as 4 hours after DEX treatment, CLL cells exhibited a significant decrease in mitochondrial membrane potential (Figure 2A, left) that was sustained for ≥18 hours (Figure 2A, right). The decrease in membrane potential could not be attributed to decreased mitochondrial mass (supplemental Figure 1A) but could be prevented by mifepristone (Figure 4F), suggesting it was a transcriptional effect of DEX.
Effect of DEX on mitochondrial membrane potential, intracellular metabolites, and PKM2. (A) CLL cells from 8 different patients were cultured with or without DEX. At the indicated times, the cells were stained with DiOC6(3) to measure mitochondrial membrane potential. Median fluorescence intensities (MFIs) are shown for each sample. (B) Cells (5 × 10⁷) from 5 different CLL patients were cultured for 18 hours in the presence or absence of DEX and then analyzed by 1D 1H NMR spectroscopy. Averages and standard errors for the 5 samples are shown. Glutamate, alanine, and lactate levels were significantly lowered by DEX, whereas acetate levels were relatively preserved. (C) CLL cells from 9 patients were cultured with or without DEX. After 4 hours, PKM2 mRNA transcripts (relative to HPRT transcripts) were measured by quantitative polymerase chain reaction. (D) After 18 hours of culture, phospho-GR and PKM2 levels were measured in DEX-treated cells from 4 different patients by (upper) immunoblotting and (lower) quantified by densitometry using β-actin as a loading control. PKM2 mRNA and protein were both decreased by DEX. (E) Pyruvate kinase (PK) enzymatic activity in DEX-treated CLL cells from patient 56 after 18 hours, measured as described in Materials and methods. **P < .01; *P < .05.
Effect of DEX on mitochondrial membrane potential, intracellular metabolites, and PKM2. (A) CLL cells from 8 different patients were cultured with or without DEX. At the indicated times, the cells were stained with DiOC6(3) to measure mitochondrial membrane potential. Median fluorescence intensities (MFIs) are shown for each sample. (B) Cells (5 × 10⁷) from 5 different CLL patients were cultured for 18 hours in the presence or absence of DEX and then analyzed by 1D 1H NMR spectroscopy. Averages and standard errors for the 5 samples are shown. Glutamate, alanine, and lactate levels were significantly lowered by DEX, whereas acetate levels were relatively preserved. (C) CLL cells from 9 patients were cultured with or without DEX. After 4 hours, PKM2 mRNA transcripts (relative to HPRT transcripts) were measured by quantitative polymerase chain reaction. (D) After 18 hours of culture, phospho-GR and PKM2 levels were measured in DEX-treated cells from 4 different patients by (upper) immunoblotting and (lower) quantified by densitometry using β-actin as a loading control. PKM2 mRNA and protein were both decreased by DEX. (E) Pyruvate kinase (PK) enzymatic activity in DEX-treated CLL cells from patient 56 after 18 hours, measured as described in Materials and methods. **P < .01; *P < .05.
Levels of intracellular metabolites were then measured by NMR spectroscopy. Consistent with restricted metabolism, a number of metabolites were decreased by DEX. Intracellular glutamate, alanine, and lactate levels were significantly lower (Figure 2B). Pyruvate, succinate, and glutamine levels were also decreased, whereas acetate was relatively preserved (Figure 2B). Pyruvate is a product of glycolysis and glutaminolysis that gives rise to lactate and alanine. Glutamate is a product of glutaminolysis that provides tricarboxylic acid (TCA) cycle intermediates, such as succinate.18 Acetate is a product of fatty acid oxidation.19 These changes in metabolite levels were measured at 18 hours, prior to any loss of membrane integrity associated with cell death (supplemental Figure 1B) and could not be attributed simply to cytotoxicity.
DEX down-regulates pyruvate kinase expression and activity
The decrease in pyruvate, lactate, and alanine levels suggested that genes associated with pyruvate generation were decreased by DEX. PKM2 catalyzes the last step of the glycolytic pathway and transfers a phosphate group from phosphoenolpyruvate to adenosine diphosphate to make pyruvate and ATP.20 DEX-treated CLL cells down-regulated PKM2 mRNA and protein levels within 4 hours (Figure 2C-D). PK enzyme activity was also decreased by DEX (Figure 2E).
Concomitant membrane damage enhances DEX-mediated cytotoxicity
The results above suggested that DEX restricted the ability of CLL cells to generate energy, in part by down-regulating PKM2. To test this idea, CLL cell membranes were disrupted by complement-dependent cytotoxicity, ionophores, or free fatty acids in the presence and absence of DEX. The rationale for these experiments was that membrane repair requires energy and if DEX-treated CLL cells that suffer concomitant membrane damage cannot generate sufficient energy by increasing glucose metabolism, they may be killed more easily.
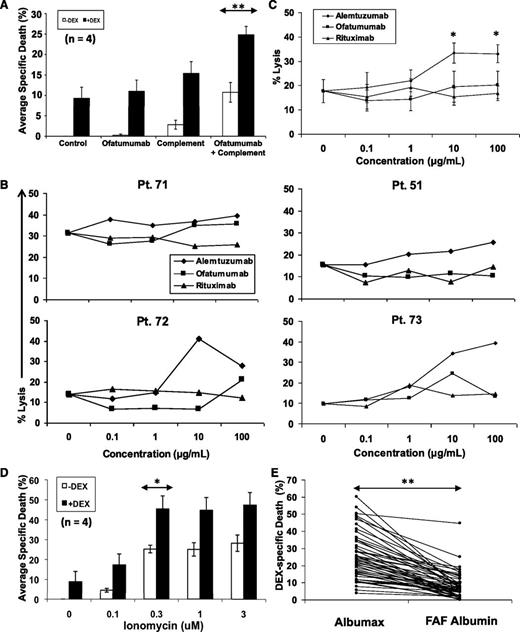
Monoclonal antibodies including rituximab and ofatumumab, which bind different epitopes on CD20, and alemtuzumab, which binds CD52, are used in the treatment of CLL21 and exert their cytotoxic effects in part by depositing complement on the cell surface to form the membrane attack complex.22 In the absence of complement, ofatumumab did not change basal killing by DEX in serum-free conditions (Figure 3A). However, death of CLL cells from complement damage was increased significantly by DEX (Figure 3A).
Enhancement of cytotoxic membrane damage by DEX. (A) Purified CLL cells were cultured with or without DEX, the monoclonal CD20 antibody ofatumumab (70 μg/mL), or rabbit complement (1:40 final dilution). Cells were stained with 7AAD after 48 hours and analyzed by flow cytometry. Specific death is the difference between the percentages of 7AAD+ cells in control samples and treated samples. The averages and standard errors of the results for the indicated sample numbers are shown. (B) CLL cells from 4 different patients were cultured with DEX, rabbit complement, and the indicated concentrations of ofatumumab, alemtuzumab, and rituximab. Specific death was measured after 48 hours. (C) The averages and standard errors for the results with individual patient samples are shown and indicate that alemtuzumab, which causes more membrane damage than the CD20 antibodies, had greater cytotoxic activity in the presence of DEX. (D) Purified CLL cells were cultured with or without DEX in the presence or absence of the indicated doses of ionomycin before measuring specific death. (E) Purified CLL cells from 52 different patients were treated with DEX in RPMI-1640, transferrin, and 0.02% lipid-rich albumax or with RPMI-1640, transferrin, and 0.02% fatty acid–free (FAF) albumin to remove free fatty acids that could damage cell membranes in culture. Specific death after 48 hours was significantly lower in FAF albumin. **P < .01; *P < .05.
Enhancement of cytotoxic membrane damage by DEX. (A) Purified CLL cells were cultured with or without DEX, the monoclonal CD20 antibody ofatumumab (70 μg/mL), or rabbit complement (1:40 final dilution). Cells were stained with 7AAD after 48 hours and analyzed by flow cytometry. Specific death is the difference between the percentages of 7AAD+ cells in control samples and treated samples. The averages and standard errors of the results for the indicated sample numbers are shown. (B) CLL cells from 4 different patients were cultured with DEX, rabbit complement, and the indicated concentrations of ofatumumab, alemtuzumab, and rituximab. Specific death was measured after 48 hours. (C) The averages and standard errors for the results with individual patient samples are shown and indicate that alemtuzumab, which causes more membrane damage than the CD20 antibodies, had greater cytotoxic activity in the presence of DEX. (D) Purified CLL cells were cultured with or without DEX in the presence or absence of the indicated doses of ionomycin before measuring specific death. (E) Purified CLL cells from 52 different patients were treated with DEX in RPMI-1640, transferrin, and 0.02% lipid-rich albumax or with RPMI-1640, transferrin, and 0.02% fatty acid–free (FAF) albumin to remove free fatty acids that could damage cell membranes in culture. Specific death after 48 hours was significantly lower in FAF albumin. **P < .01; *P < .05.
The 3 antibodies cause different levels of complement damage to cell membranes. Alemtuzumab is the most toxic probably because of the higher levels of CD52 on CLL cells compared with CD20 and possibly because of differences in complement activation as a result of altered mobility of the target molecules after antibody binding.21 Ofatumumab is thought to be more toxic than rituximab because it binds CD20 closer to the cell membrane, leading to more efficient complement deposition. As a result of these differences in membrane damaging capabilities, DEX would be expected to kill more CLL cells in the presence of alemtuzumab than ofatumumab and much more than rituximab. As predicted, the combination of alemtuzumab and DEX killed a greater number of CLL cells than either of the 2 CD20 antibodies (Figure 3B-C). Ofatumumab tended to be more potent than rituximab, but the differences were not statistically significant.
Ionomycin is a calcium ionophore that creates pores in plasma membranes, causing electrochemical gradient disturbances that require significant energy to repair.23 Consistent with the hypothesis that DEX restricts the metabolic activity needed to repair such damage, ionomycin-mediated cell death was increased significantly by DEX (Figure 3D).
The serum-free conditions used in these studies would also be expected to damage plasma membranes through detergent-like effects of the fatty acids bound to lipid-rich albumin.24,25 Removing this source of membrane disruption should then decrease killing of CLL cells by DEX. Consistent with this idea, DEX-mediated cell death was significantly reduced when Albumax was replaced by fatty acid–free albumin (Figure 3E). The decrease in cell size was still observed (data not shown).
DEX increases PPARα expression and activity
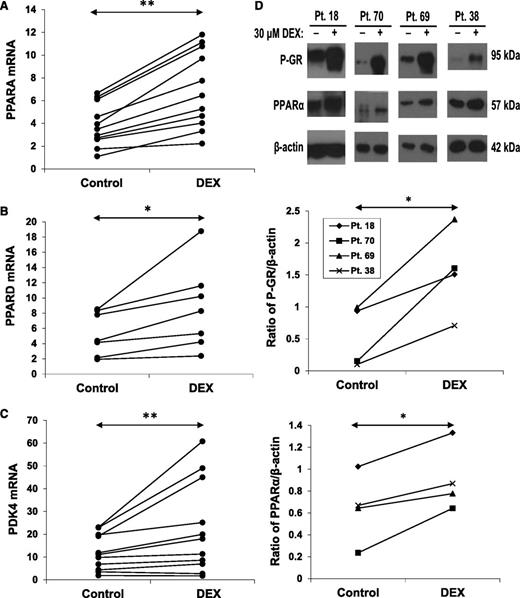
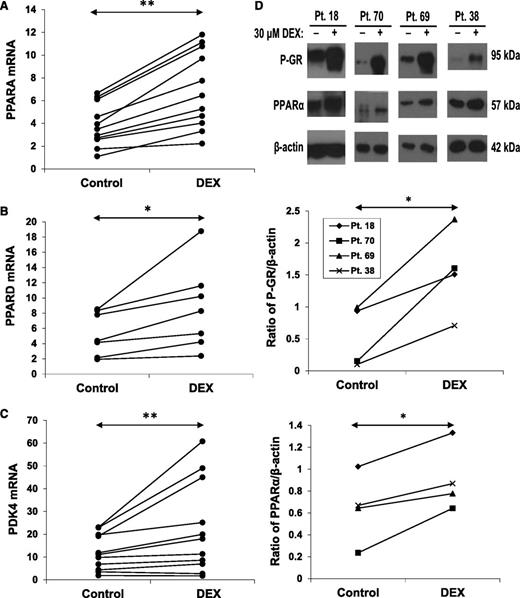
The results in Figure 2 suggested that the capacity of CLL cells to generate pyruvate was compromised by DEX. However, the relatively preserved acetate levels (Figure 2B) suggested that genes associated with fatty acid oxidation might be increased in DEX-treated CLL cells. PPARα and PPARδ are nuclear receptors involved in the regulation of fatty acid oxidation.15,26 DEX up-regulated PPARA and PPARD mRNA and PPARα protein expression (Figure 4A-B,D). The changes in PPARA mRNA occurred later than the down-regulation of PKM2.
Effect of DEX on PPAR expression. CLL cells from the indicated patient samples were treated with or without DEX for 18 hours. (A) PPARA, (B) PPARD, and (C) PDK4 transcripts (relative to HPRT) were then measured by quantitative polymerase chain reaction. (D) Expression of phospho-GR and PPARα proteins were also measured in 4 patients by (top) immunoblotting, with β-actin used as a loading control, and (middle and bottom) quantified by densitometry. PPARα protein and mRNA were both increased by DEX at this time.
Effect of DEX on PPAR expression. CLL cells from the indicated patient samples were treated with or without DEX for 18 hours. (A) PPARA, (B) PPARD, and (C) PDK4 transcripts (relative to HPRT) were then measured by quantitative polymerase chain reaction. (D) Expression of phospho-GR and PPARα proteins were also measured in 4 patients by (top) immunoblotting, with β-actin used as a loading control, and (middle and bottom) quantified by densitometry. PPARα protein and mRNA were both increased by DEX at this time.
Among the genes regulated by PPARα and PPARδ is PDK4. PDK4 phosphorylates and inactivates pyruvate dehydrogenase, preventing pyruvate from being oxidized in mitochondria and promoting fatty acid oxidation.27 Consistent with the increase in PPARα and PPARδ, PDK4 mRNA expression was also increased by DEX (Figure 4C).
Adipocyte-derived lipids, lipoproteins, and propionic acid reverse the effects of DEX
The decreased expression of PKM2 coupled with increased expression of PPARα, PPARδ, and PDK4 suggested that DEX might cause CLL cells to depend primarily on fatty acid oxidation as a metabolic strategy. Accordingly, they might be able to use fatty acids to generate energy, support mitochondrial activity, and resist the lytic effects of GCs. To investigate this possibility, cultures of DEX-treated cells in serum-free conditions were supplemented with various forms of fatty acid oxidation substrates.
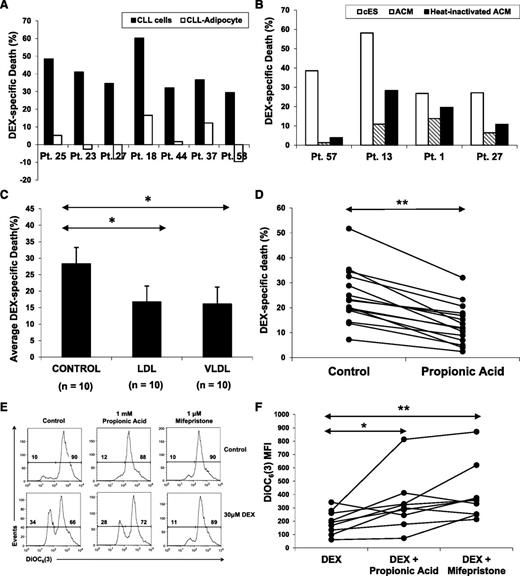
Adipocytes are a major source of fuel for fat-burning tissues and are often found in lymphoid microenvironments where CLL cells reside in vivo.28 To test whether adipocyte-derived lipids could confer resistance to DEX, CLL cells were cocultured with OP-9–derived adipocytes.10 OP-9 is a mesenchymal stem cell line that differentiates rapidly into adipocytes in serum-free conditions10 (supplemental Figure 1C). CLL cells were highly resistant to DEX in the presence of adipocytes compared with CLL cells in serum-free conditions alone (Figure 5A).
Effect of fatty acid oxidation substrates on DEX-mediated death. (A) Adipocytes and ACM were prepared as described in the Materials and methods; 6 × 10⁶ CLL cells were cocultured with (A) OP-9–derived adipocytes or (B) in ACM (with or without heat inactivation) in the presence or absence of DEX for 48 hours. Specific death was then determined by staining with 7AAD and flow cytometric analysis. (C) CLL cells from 10 different patients were cultured with or without DEX in the presence or absence of low-density lipoproteins (LDLs) or very-low-density lipoproteins (VLDLs) (1:200 and 1:100 final concentrations, respectively). The averages and standard errors of specific death results for each treatment are shown. (D) CLL cells from 15 individual patients were cultured with or without DEX in the presence or absence of propionic acid (1 mM), an odd-numbered fatty acid that provides both acetyl-CoA and succinate to support the TCA cycle. Percentages of viable 7AAD− cells were measured 48 hours later by flow cytometry. Specific death is the difference between the percentages of 7AAD+ cells in control and DEX-treated samples. (E) Mitochondrial membrane potentials of DEX-treated CLL cells supplied with propionic acid were determined after 18 hours by staining with DiOC6(3) and flow cytometric analysis. As a control, DEX-treated CLL cells were also treated with the GR antagonist mifepristone (1 μM). An example is shown. (F) Summary of DiOC6(3) MFI measurements for 8 different patient samples, indicating that propionic acid and mifepristone both restore mitochondrial membrane potential in DEX-treated CLL cells. **P < .01; *P < .5.
Effect of fatty acid oxidation substrates on DEX-mediated death. (A) Adipocytes and ACM were prepared as described in the Materials and methods; 6 × 10⁶ CLL cells were cocultured with (A) OP-9–derived adipocytes or (B) in ACM (with or without heat inactivation) in the presence or absence of DEX for 48 hours. Specific death was then determined by staining with 7AAD and flow cytometric analysis. (C) CLL cells from 10 different patients were cultured with or without DEX in the presence or absence of low-density lipoproteins (LDLs) or very-low-density lipoproteins (VLDLs) (1:200 and 1:100 final concentrations, respectively). The averages and standard errors of specific death results for each treatment are shown. (D) CLL cells from 15 individual patients were cultured with or without DEX in the presence or absence of propionic acid (1 mM), an odd-numbered fatty acid that provides both acetyl-CoA and succinate to support the TCA cycle. Percentages of viable 7AAD− cells were measured 48 hours later by flow cytometry. Specific death is the difference between the percentages of 7AAD+ cells in control and DEX-treated samples. (E) Mitochondrial membrane potentials of DEX-treated CLL cells supplied with propionic acid were determined after 18 hours by staining with DiOC6(3) and flow cytometric analysis. As a control, DEX-treated CLL cells were also treated with the GR antagonist mifepristone (1 μM). An example is shown. (F) Summary of DiOC6(3) MFI measurements for 8 different patient samples, indicating that propionic acid and mifepristone both restore mitochondrial membrane potential in DEX-treated CLL cells. **P < .01; *P < .5.
Soluble factors from adipocytes were mainly responsible for the enhanced survival of DEX-treated CLL cells because conditioned media from OP-9–derived adipocytes also prevented DEX-mediated killing of CLL cells (Figure 5B). Much of the protective effect survived heat inactivation, suggesting it was due to lipid factors.
Lipoproteins transport lipids to tissues that use fatty acid oxidation to generate energy. Very-low density lipoproteins and low-density lipoproteins increased the survival of DEX-treated cells (Figure 5C), whereas high-density lipoproteins, with lower triglyceride content, had little effect (data not shown). Addition of long chain (>12 carbon) fatty acids increased the death of DEX-treated CLL cells, perhaps because of additional detergent-like effects in serum-free culture, as described above (data not shown). However, short-chain fatty acids and ketone bodies also failed to increase the survival of DEX-treated CLL cells, despite their capacity to be used as fuel by fat-burning tissues without causing membrane damage (data not shown). Given that an intact TCA cycle is required to oxidize fatty acids in mitochondria, even-numbered short-chain fatty acids may not be able to be oxidized in DEX-treated cells because of the impaired TCA cycle (Figure 2). However, odd-numbered fatty acids can be used for both anaplerosis (ie, to restore depleted TCA cycle intermediates) and as a fuel source.29 Propionic acid is a short chain 3-carbon fatty acid that is first converted to propionyl coenzyme A (propionyl-CoA) and then to succinyl-CoA, an intermediate of the TCA cycle. Supplementation with proprionic acid maintained the mitochondrial potential of DEX-treated cells, as measured by DiOC6(3) staining, and increased their viability (Figure 5D-F).
Supplementation with glucose or pyruvate did not increase survival of DEX-treated CLL cells (supplemental Figure 1E), consistent with a reduced ability to oxidize glucose (Figures 2 and 4). Supplementation with glutaminolysis metabolites, including glutamine, glutamate, or α-ketoglutarate, also failed to rescue DEX-treated CLL cells (supplemental Figure 1D).
PPARα and fatty acid oxidation mediate GC resistance
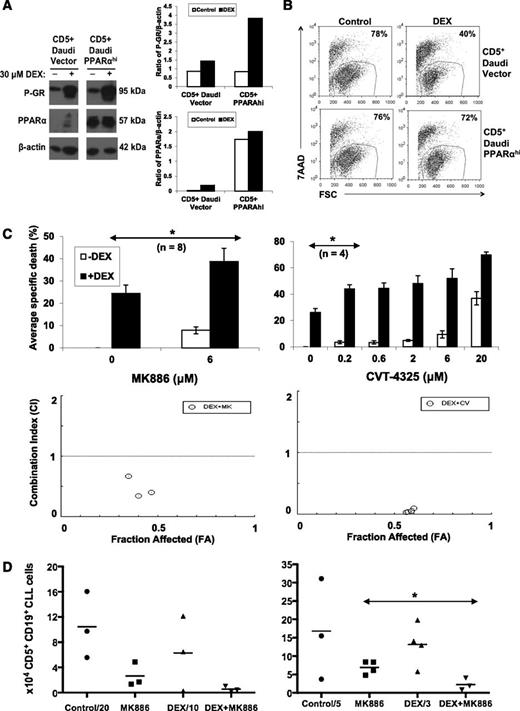
The findings that PPARα was up-regulated by DEX (Figure 4) and fatty acid oxidation substrates prevented DEX-mediated death (Figure 5) suggested that PPARα and fatty acid oxidation might mediate resistance of CLL cells to GCs. A previously described CLL cell line model was used to study the effect of increased PPARα expression on sensitivity to DEX.15 CD5+ Daudi cells were transfected with human PPARA, and a clone was obtained with high PPARα expression (Figure 6A).15 DEX activated the GR in both the PPARα-expressing cell line and its empty vector control, as determined by increased phospho-GR levels (Figure 6A). However the PPARα-expressing cell line was found to be resistant to DEX treatment in comparison with the empty vector control (Figure 6B).
Effect of PPARα and fatty acid oxidation inhibitors on DEX-mediated cytotoxicity in vitro and in vivo. (A) CD5+ Daudi cells that overexpress PPARα and vector control cells were treated with DEX for 48 hours. Expression of PPARα and the activated phosphorylated GR was then determined by immunoblotting and quantified by densitometry, using β-actin as a loading control. (B) Percentages of viable Daudi cells that excluded 7AAD were determined by flow cytometry after 48 hours. Despite strong GR activation, DEX-treated PPARαhi cells were resistant to DEX. (C) (Upper) CLL cells from the indicated numbers of patient samples were cultured in the presence or absence of DEX with or without the indicated concentrations of the PPARα antagonist MK886 or the fatty acid oxidation inhibitor CVT-4325. After 48 hours, specific death was determined by the differences of the percentages of viable 7AAD− cells in control and treated cultures measured by flow cytometry. Averages and standard errors of the results for each inhibitor are shown. (Lower) CIs were obtained by treating with MK886 (0.6, 1.2, and 6 μM) or CVT-4325 (0.2, 0.6, 2, and 6 μM) together with DEX (30 μM) and entering the resulting specific death values into the CompuSyn program. Fraction affected (FA)-CI plots are shown for a single patient sample and indicate that the combinations of MK886 or CVT-4325 with DEX are synergistic (CI < 1). Similar results were obtained with 4 other patient samples. (D) NOD-SCIDγcnull mice engrafted 6 weeks earlier with CLL splenocytes were treated with 4 consecutive injections of MK886 (10 mg/kg), DEX (4.6 mg/kg), or both MK886 and DEX. Four days after the last injection, human CD5+CD19+ CLL cells were measured in peritoneal cavities by flow cytometry. The graphs represent the results from 2 separate experiments with spleen cells from different patients. **P < .01; *P < .05.
Effect of PPARα and fatty acid oxidation inhibitors on DEX-mediated cytotoxicity in vitro and in vivo. (A) CD5+ Daudi cells that overexpress PPARα and vector control cells were treated with DEX for 48 hours. Expression of PPARα and the activated phosphorylated GR was then determined by immunoblotting and quantified by densitometry, using β-actin as a loading control. (B) Percentages of viable Daudi cells that excluded 7AAD were determined by flow cytometry after 48 hours. Despite strong GR activation, DEX-treated PPARαhi cells were resistant to DEX. (C) (Upper) CLL cells from the indicated numbers of patient samples were cultured in the presence or absence of DEX with or without the indicated concentrations of the PPARα antagonist MK886 or the fatty acid oxidation inhibitor CVT-4325. After 48 hours, specific death was determined by the differences of the percentages of viable 7AAD− cells in control and treated cultures measured by flow cytometry. Averages and standard errors of the results for each inhibitor are shown. (Lower) CIs were obtained by treating with MK886 (0.6, 1.2, and 6 μM) or CVT-4325 (0.2, 0.6, 2, and 6 μM) together with DEX (30 μM) and entering the resulting specific death values into the CompuSyn program. Fraction affected (FA)-CI plots are shown for a single patient sample and indicate that the combinations of MK886 or CVT-4325 with DEX are synergistic (CI < 1). Similar results were obtained with 4 other patient samples. (D) NOD-SCIDγcnull mice engrafted 6 weeks earlier with CLL splenocytes were treated with 4 consecutive injections of MK886 (10 mg/kg), DEX (4.6 mg/kg), or both MK886 and DEX. Four days after the last injection, human CD5+CD19+ CLL cells were measured in peritoneal cavities by flow cytometry. The graphs represent the results from 2 separate experiments with spleen cells from different patients. **P < .01; *P < .05.
Conversely, CLL cells treated with the small molecule PPARα inhibitor MK88615 became more sensitive to DEX (Figure 6C, left upper panel). In addition, the fatty acid oxidation inhibitor CVT-432530 enhanced killing of CLL cells by DEX (Figure 6C, right upper panel). Combination indices for these inhibitors with DEX were <1 (Figure 6C, lower panels), indicating synergy.14 Similar results were obtained with 2 other PPARα antagonists: GW647131 and compound A32 (supplemental Figure 2).
PPARα antagonists enhance DEX-mediated clearance of CLL xenografts
The ability of MK886 to improve the therapeutic efficacy of DEX in vivo was then studied in a CLL xenograft model involving transfer of spleen cells from patients who had undergone therapeutic splenectomies into NOD-SCIDγcnull mice along with injections of CLL plasma to support tumor engraftment.15,16 Human T and CLL-B cells are found mainly in spleens and peritoneal cavities of tumor-bearing mice by 6 weeks after adoptive transfer.16 Groups of reconstituted mice were then given 4 daily interperitoneal injections of either saline, MK886 at 10 mg/kg (shown previously to partially clear CLL cells15 ), DEX at 4.6 mg/kg (the dose in the high-dose GC regimen for CLL3 ), or MK886 and DEX. DEX alone did not clear CLL cells from spleens or peritoneal cavities. However, the combination of MK886 and DEX decreased splenic tumor burdens to a greater extent than either agent alone (Figure 6D), without obvious toxicity. The right and left panels in Figure 6D are the results of 2 separate experiments using splenocytes from different donors.
Discussion
The findings in this paper suggest the following: (1) GCs alter metabolic gene expression (Figures 2C and 4) and activity in CLL cells (Figure 2); (2) GCs prevent tumor cells from accessing bioenergetic programs needed to respond to membrane damage (Figure 3); (3) GCs increase the dependence of CLL cells on fatty acid oxidation by altering the expression of PPARα and PDK4 (Figure 4); (4) use of fatty acids to support metabolism can alleviate restrictions imposed by GCs, constituting a resistance mechanism to GC-mediated cytotoxicity (Figure 5); and (5) PPARα inhibitors offer a strategy to improve the therapeutic efficacy of GCs (Figure 6).
High-dose GCs are used in the treatment of CLL patients,3 especially those with 17p deletions, but the mechanism of their antitumor activity is not clear. GCs have been shown to change the expression of apoptotic genes and alter signaling processes important for tumor growth by increasing the expression of regulatory molecules such as IκB and phosphatases.5-8 However, despite the fact that many of the complications of GC therapy, such as diabetes and hyperlipidemia, are metabolic in nature and a major function of endogenous GCs is to turn off glucose usage and turn on fatty acid oxidation to allow cells to survive an overnight fast,5 the possibility that the therapeutic activity of GCs in CLL is mediated through metabolism is not widely appreciated. It has been shown that GCs cause leukemia cells to undergo autophagy in some conditions, which is a response to energy deprivation.33 However, we could find no evidence for autophagy, such as lipidation of LC3, in the serum-free conditions used here (data not shown). Previous studies have also shown that GCs inhibit glycolysis in acute leukemia cells by restricting glucose uptake and consumption.34 However, the effect of GCs on pyruvate kinase expression (Figure 2) has not been reported before and may be unique to CLL cells.35 Regardless, the concept that GCs restrict the metabolic activity of leukemia cells is appealing in that it helps explain why GCs are able to enhance the therapeutic effects of cytotoxic drugs in combination chemotherapy regimens. Moreover, this activity appears to be relatively independent of underlying cytogenetic abnormalities (Figure 1B), which may explain why high dose GCs are among the few treatments with activity against CLL cells harboring 17p deletions.3
The mechanism(s) whereby GCs down-regulate pyruvate kinase and increase PPARα expression are not clear. The effects appear to be due to transcriptional regulation by GCs because they can be prevented by mifepristone (Figures 1 and 5). GCs may act directly at the promoters of metabolic genes to positively or negatively regulate their expression and may also regulate the expression of microRNAs that control metabolic gene expression.36
Fatty acid oxidation has been described as a mechanism used by cancer cells to generate energy and survive under conditions of metabolic stress, such as anoikis.37-40 The results reported here are consistent with these observations and suggest that PPARα-mediated fatty acid oxidation also allows CLL cells to survive the metabolic stress imposed by GCs. Concomitant administration of GCs and PPARα antagonists such as MK886, an agent that has been used before in humans,15 appears feasible (Figure 6) and constitutes a novel strategy to improve the therapeutic efficacy of GC therapy in high-risk CLL patients.
The online version of this article contains a data supplement.
The publication costs of this article were defrayed in part by page charge payment. Therefore, and solely to indicate this fact, this article is hereby marked “advertisement” in accordance with 18 USC section 1734.
Acknowledgments
The authors thank Peppi Prasit (Inception Sciences) for MK886, GW6471, and compound A; Luiz Belardinelli and Jeff Chisholm (Gilead Sciences) for CVT-4325; Juan Carlos Zuniga-Pflucker (University of Toronto) for OP-9 cells; and Attila Hadju (GSK Canada) for helpful discussions. R.C.L. would like to thank Professor Cheryl H. Arrowsmith (University of Toronto) for access to the NMR instrumentation.
This work was supported by grants from the Canadian Institutes of Health Research, the Leukemia and Lymphoma Society of Canada, GlaxoSmithKline, the Coxford family Research Fund (to D.E.S.), and a Queen Elizabeth II Graduate Scholarship in Science and Technology from the University of Toronto (to S.T.).
Authorship
Contribution: S.T. and D.E.S. designed the research, analyzed the data, and wrote the paper; Y.S. helped perform experiments. R.C.L., M.M., K.W., F.Z., and R.G. helped design and perform experiments and write the paper; and A.-K.B., Y.G., and U.R. designed and performed enzyme assays and helped write the paper.
Conflict-of-interest disclosure: The authors declare no competing financial interests.
Correspondence: David Spaner, Division of Molecular and Cellular Biology, S-116A, Research Building, Sunnybrook Research Institute, 2075 Bayview Ave, Toronto, ON, Canada M4N 3M5; e-mail: spanerd@sri.utoronto.ca.

