Key Points
Unique dataset of human platelet mRNA, miRNA, and physiology reveals mRNAs and miRNAs that differ by age and gender.
Interactive public web tool (www.plateletomics.com) provides biologic insights into platelet function and gene expression.
Abstract
There is little data considering relationships among human RNA, demographic variables, and primary human cell physiology. The platelet RNA and expression-1 study measured platelet aggregation to arachidonic acid, ADP, protease-activated receptor (PAR) 1 activation peptide (PAR1-AP), and PAR4-AP, as well as mRNA and microRNA (miRNA) levels in platelets from 84 white and 70 black healthy subjects. A total of 5911 uniquely mapped mRNAs and 181 miRNAs were commonly expressed and validated in a separate cohort. One hundred twenty-nine mRNAs and 15 miRNAs were differentially expressed (DE) by age, and targets of these miRNAs were over-represented among these mRNAs. Fifty-four mRNAs and 9 miRNAs were DE by gender. Networks of miRNAs targeting mRNAs, both DE by age and gender, were identified. The inverse relationship in these RNA pairs suggests miRNAs regulate mRNA levels on aging and between genders. A simple, interactive public web tool (www.plateletomics.com) was developed that permits queries of RNA levels and associations among RNA, platelet aggregation and demographic variables. Access to these data will facilitate discovery of mechanisms of miRNA regulation of gene expression. These results provide new insights into aging and gender, and future platelet RNA association studies must account for age and gender.
Introduction
Gene expression governs cell function and hence normal biological processes like organism development and physiology, whereas dysregulated gene expression causes disease by altering cell function. The relationships between protein-coding and noncoding RNAs are central to gene expression, but such relationships are largely unexplored in primary human cells. MicroRNAs (miRNAs), the best-studied of the small noncoding RNAs, post-transcriptionally regulate mRNA levels and translation, and there is an increasing awareness of their role in disease pathophysiology, their use as biomarkers, and their potential as therapeutics.1-5 Associations between disease and miRNA levels may yield novel insights into molecular mechanisms of disease pathogenesis, but interpretation of miRNA association studies is limited by the lack of understanding of (1) the influence of demographic factors (eg, age, gender, and race) on miRNA levels and (2) knowledge of miRNA function. Although cell-based approaches, such as high-throughput sequencing of cross-linked immunoprecipitation, are likely to eventually aid in filtering the relevant mRNA targets,6-9 in silico prediction tools will continue to be heavily used to give clues to miRNA function, despite the limitations regarding the optimal prediction algorithm and discrepancies among outputs.10,11
Because human blood is a relatively easy tissue to isolate, blood disorders (such as hemoglobinopathies) served as early and valuable models for understanding the mechanisms of gene expression in health and disease. Blood platelets are essential for normal hemostasis and play an important role in inflammation, tissue repair and regeneration, endothelial cell stability, and cancer metastasis.12,13 Reduced platelet function is a common cause of pathologic bleeding, whereas increased platelet numbers and reactivity are believed to contribute to pathologic thrombosis, such as myocardial infarction and stroke.14 Platelets have served as a model for studying cell biology processes of adhesion, activation, granule release, shape change, and spreading; they also are convenient cells for molecular analyses of integrin activation, actin cytoskeletal rearrangement, calcium flux, phospholipid hydrolysis, G protein-coupled receptor signaling, and kinase and phosphatase function. Human platelets express and translate mRNAs and contain a diverse repertoire of long and short noncoding RNAs.15-18 Furthermore, only posttranscriptional mechanisms are available for regulating gene expression in the anucleate human platelet,15 a potential experimental advantage to overcome differing transcript content and properties between the nucleus and cytoplasm.19 Thus, platelets present a unique opportunity to correlate transcriptomic information with cell function and other biologic parameters.
There is reproducible and heritable variation in ex vivo platelet aggregation.20,21 Although subject age and gender are known to affect platelet function,22-24 the molecular genetic mechanisms are poorly understood. The platelet RNA and expression-1 (PRAX1) study was designed to identify relationships among miRNAs, mRNAs, and cell function using platelets from a diverse group of 154 healthy subjects. Our analyses identified pairs of miRNAs targeting mRNAs where both RNAs are differentially expressed (DE) by age or gender. We developed an interactive, public web tool that permits simple and rapid queries of platelet RNA levels and the ability to examine associations among mRNA levels, miRNA levels, cell function, and demographic variables (www.plateletomics.com). These platelet RNA expression profiles provide an important resource for future efforts to assign function to miRNAs and to understand gene expression variation in thrombosis and hemostasis.
Materials and methods
Subject recruitment and platelet aggregation
Volunteers were recruited from July 2010 through August 2011 from flyers posted at the Texas Medical Center, Houston, TX. Healthy male and female subjects over the age of 18 years were eligible. Platelet aggregometry was performed by a single operator on a PAP-8E (BIO/DATA Corporation, Horsham, PA) 8-channel platelet aggregometer as previously described.20 Based on pilot studies directed at detecting the greatest interindividual variation, the maximal percent aggregation, slope of aggregation, and the agonist response score at 10 minutes in platelet-rich plasma was determined using agonists sensitive to commonly used antiplatelet agents: 0.5 mg/mL arachidonic acid, 4 μM ADP, 1 and 2 μM protease activated receptor (PAR)1 activating peptide (PAR1-AP), and 50 and 75 μM PAR4-AP as previously described.25 This research was approved by the institutional review board at Baylor College of Medicine under protocol no. H-28426. This study was conducted in accordance with the Declaration of Helsinki.
RNA profiling
Leukocyte-depleted platelet (LDP) RNA was obtained via density centrifugation and immune-depletion of CD45+ cells as previously described.26 Three hundred nanograms of LDP total RNA was labeled and hybridized to the Human Gene 1.0 ST Array (Affymetrix, Santa Clara, CA). The raw intensity values were background corrected, log2 transformed, and then quantile normalized (the command line option was “-a rma-sketch”) similar to our prior analysis. nCounter human miRNA assay kit v1 (Nanostring Technologies, Seattle, WA) was used for digital miRNA profiling from 100 ng of LDP total RNA. The average plus 2 standard deviations of 8 negative control probes was used to determine background detection threshold. mRNA and miRNA expression data were validated by Spearman correlation using data obtained from the Platelet Genes and Physiology study using Illumina27 and Exiqon26 platforms, respectively. RNA data were deposited into National Center for Biotechnology Information GeneExpressionOmnibus, accession no. GSE49921.
Statistical analysis
Associations between RNA abundance and demographic factors age, body mass index (BMI), and gender, as well as platelet aggregation, were evaluated using simple and multiple regression analyses. P values for the differential expression association analyses between RNA abundance levels and age, BMI, gender, and platelet aggregation were determined using linear models. Multiple testing considerations were made using the false discovery rate (FDR) methodology, and q-values were estimated using the Benjamini-Hochberg method as made available through the R function p.adjust. RNAs were considered DE if the estimated q-value for the multiple regression model was <0.05.
For additional methodological details, see the supplemental Data on the Blood Web site.
Results
Platelet function analysis
One hundred sixty-three subjects were recruited. Blood was obtained, and platelets were isolated for light transmission platelet aggregometry. Nine subjects were excluded because of occult antiplatelet medication use or abnormal hematological parameters. As shown in Table 1, the remaining 154 subjects were generally healthy and similarly distributed by gender and race. We quantified platelet aggregation in response to (1) arachidonic acid; (2) ADP (mediates platelet activation through P2Y12 and P2Y1, which are coupled to G proteins, Gq and GI28 ); and (3) PAR1-AP and PAR4-AP that activate platelets through PAR1 and PAR4, which are coupled to Gq and G12.29 An initial pilot and reproducibility study was performed on 10 subjects to identify agonist concentrations that produced the greatest variation in response (supplemental Figure 1A-D). Supplemental Table 1 links demographic information and platelet aggregation agonist response scores for each of the 154 subjects in PRAX1.
Expressed mRNAs and miRNAs
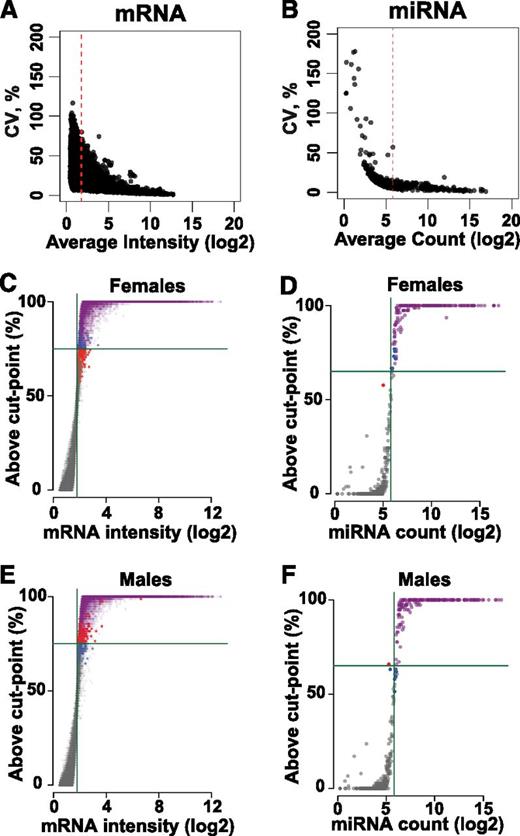
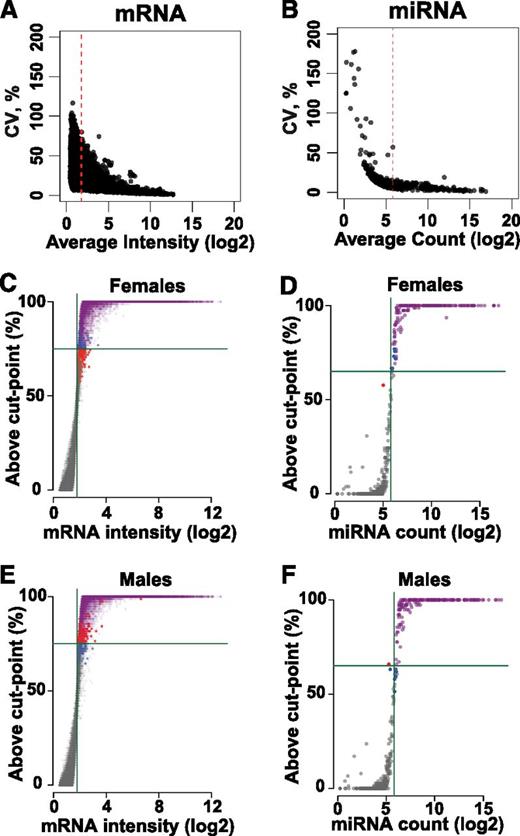
LDPs were isolated, and total RNA was extracted as previously described.26 mRNA was profiled using the Human Gene 1.0 ST Array, and miRNA was profiled using the nCounter human miRNA assay kit, v1 (Nanostring Technologies, Seattle, WA).25 Not unexpectedly, there was substantial variation in the low-expressed mRNAs and miRNAs (Figure 1A-B). Therefore, for RNA comparisons across groups or association analyses by subject characteristics or by platelet phenotypes, it was important to consider only commonly expressed mRNAs and miRNAs.
Commonly expressed platelet mRNAs and miRNAs. The lowest levels of platelet (A) mRNAs and (B) miRNAs show the greatest variation. Each point represents 1 measured feature in either the mRNA or miRNA assay. X-axes indicate mean abundance (log2) and y-axes indicate coefficient of variation (CV). The dashed red line indicates the threshold cutoff. (C,E) Platelet mRNA and (D,F) miRNA are shown for (C-D) women and (E-F) men. X-axes show the abundance levels, and green vertical lines indicate the abundance cut-point. Y-axes show the percentage of subjects above the selected abundance cut-point. Green horizontal lines indicate the percentage threshold. RNAs above background in both genders are colored purple. RNAs above background in female subjects or male subjects only are colored blue and red, respectively. RNA features below both cutoffs are shown in gray.
Commonly expressed platelet mRNAs and miRNAs. The lowest levels of platelet (A) mRNAs and (B) miRNAs show the greatest variation. Each point represents 1 measured feature in either the mRNA or miRNA assay. X-axes indicate mean abundance (log2) and y-axes indicate coefficient of variation (CV). The dashed red line indicates the threshold cutoff. (C,E) Platelet mRNA and (D,F) miRNA are shown for (C-D) women and (E-F) men. X-axes show the abundance levels, and green vertical lines indicate the abundance cut-point. Y-axes show the percentage of subjects above the selected abundance cut-point. Green horizontal lines indicate the percentage threshold. RNAs above background in both genders are colored purple. RNAs above background in female subjects or male subjects only are colored blue and red, respectively. RNA features below both cutoffs are shown in gray.
mRNA.
Based on the distribution of mean levels of each mRNA in the entire cohort, an expression threshold of 1.8 for the log2 mRNA probeset intensity was selected (Figure 1C,E). mRNAs were defined as commonly expressed if they were expressed above this threshold in >75% (58 out of 78) of female or 75% (57 out of 76) of male subjects. Filtering by gender ensured mRNAs with gender-specific expression were not excluded. These criteria established that 7771 genes were commonly expressed in human platelets. Among these commonly expressed genes, we defined 3 categories of platelet mRNAs based on the Affymetrix annotation file: (1) uniquely mapping mRNAs (probesets annotated to a gene symbol occurring only once) (n = 5911 listed in supplemental Table 2A); (2) ambiguous mRNAs (probesets lacking a gene symbol annotation or annotated to a gene symbol occurring more than once) (n = 1831 listed in supplemental Table 2B); and (3) mitochondrial RNAs (probesets annotated to the mitochondrial genome) (n = 29 listed in supplemental Table 2C). The 30 most highly expressed uniquely mapped platelet mRNAs are listed in Table 2; supplemental Table 2 contains the 5911 uniquely mapping mRNAs, their genomic coordinates, and mean levels of expression; and supplemental Table 3 contains these 5911 mRNAs and their associations with demographic and platelet aggregation features.
Supplemental Figure 2 shows that intensity levels of the ambiguously mapped microarray features were significantly higher than those mapping to unique mRNAs (1-sided Student t test, P = 4.5 × 10⁻¹⁷), perhaps due to high levels of cross-hybridization, hybridization to transcribed but noncoding RNAs, and/or suboptimally designed probesets. To exclude possible bias or artifact derived from ambiguous probeset design, we restricted all subsequent correlative analyses to the uniquely mapping mRNAs.
miRNA.
Based on the distribution of mean miRNA levels in the entire cohort, an expression threshold of 5.8 for the log2 miRNA probe count was selected (Figure 1D,F). The 30 most highly expressed platelet miRNAs are listed in Table 3; supplemental Table 4 contains the entire list of 181 commonly expressed miRNAs, their genomic coordinates, and mean levels of expression; and supplemental Table 5 contains the commonly expressed miRNAs with relationships to demographic features.
Validation of mRNA and miRNA ranks
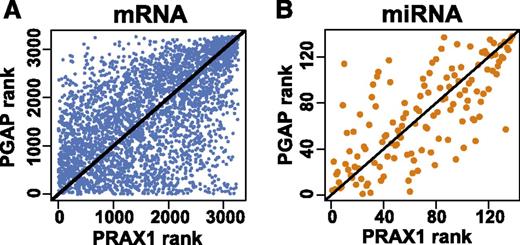
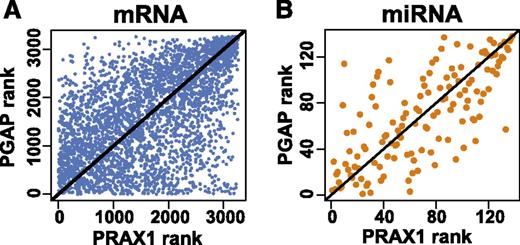
Prior analyses of transcripts have been performed using leukocyte-depleted human platelets from a different cohort of healthy subjects (n = 29 samples for mRNA27 and n = 19 samples for miRNA26 ). Figure 2 plots the Spearman rank correlations between the 2 mRNA studies (r = 0.55; P = 4.3 × 10−260) and the 2 miRNA studies (r = 0.72; P = 1.8 × 10⁻²³).
Validation of RNA abundance. Correspondence in RNA levels between current PRAX1 study and prior microarray analyses of RNA.26,27 (A) and (B) show rank correlations for mRNAs (Spearman coefficient = 0.55, P = 4.3 × 10−260) and miRNAs (Spearman coefficient = 0.72, P = 1.8 × 10⁻²³), respectively. The black line represents the Deming regression line.
Validation of RNA abundance. Correspondence in RNA levels between current PRAX1 study and prior microarray analyses of RNA.26,27 (A) and (B) show rank correlations for mRNAs (Spearman coefficient = 0.55, P = 4.3 × 10−260) and miRNAs (Spearman coefficient = 0.72, P = 1.8 × 10⁻²³), respectively. The black line represents the Deming regression line.
mRNAs and miRNAs DE by age
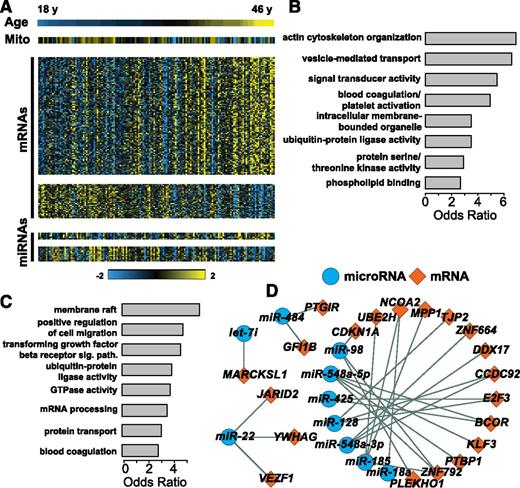
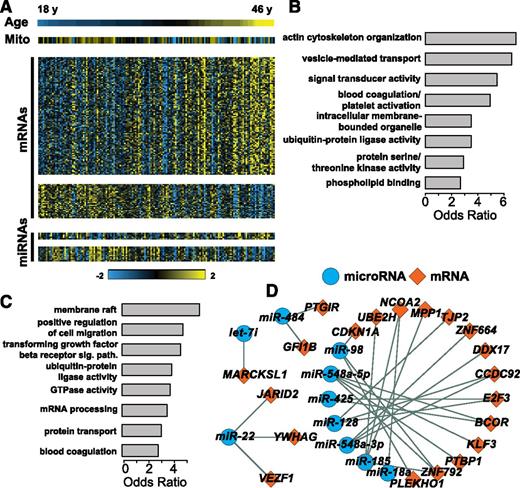
There is limited information on the effect of demographic variables on RNA levels in any human tissue, and the PRAX1 study presented an opportunity to consider these relationships. Figure 3A illustrates that the average level of mitochondrial mRNAs was inversely correlated with age (Pearson r = −0.28; P = 4.8 × 10⁻⁴). We identified 129 non-mitochondrial platelet mRNAs as DE by age (FDR q < 0.05; Figure 3A; supplemental Table 6A). Gene Ontology (GO) enrichment analysis restricted to these 129 mRNAs DE by age revealed well-established GO categories central to platelet function (Figure 3B; supplemental Table 6B).
RNAs associated with age. (A) Multicomponent heatmap of RNAs DE by age with each of 154 subjects represented as a column. The upper heatmap stripe indicates age. The second heatmap stripe indicates composite mitochondrial mRNAs (Mito). The third and fourth heatmaps indicate mRNAs positively and negatively associated with age, respectively. The fifth and sixth heatmaps show miRNA positively and negatively associated with age, respectively. Odds ratios of (B) enriched GO categories among mRNAs DE by age and (C) putative targets of miRNAs DE by age. (D) A network of miRNAs-mRNAs DE by age. For the network of RNAs DE by age, we required that (1) both the miRNA and mRNA were DE by age; (2) the miRNA was predicted to target the mRNA by ≥3 different target prediction algorithms contained in mirDIP; and (3) the Spearman correlation coefficient between miRNA abundance and mRNA abundance levels was less than −0.2 (supplemental Table 6).
RNAs associated with age. (A) Multicomponent heatmap of RNAs DE by age with each of 154 subjects represented as a column. The upper heatmap stripe indicates age. The second heatmap stripe indicates composite mitochondrial mRNAs (Mito). The third and fourth heatmaps indicate mRNAs positively and negatively associated with age, respectively. The fifth and sixth heatmaps show miRNA positively and negatively associated with age, respectively. Odds ratios of (B) enriched GO categories among mRNAs DE by age and (C) putative targets of miRNAs DE by age. (D) A network of miRNAs-mRNAs DE by age. For the network of RNAs DE by age, we required that (1) both the miRNA and mRNA were DE by age; (2) the miRNA was predicted to target the mRNA by ≥3 different target prediction algorithms contained in mirDIP; and (3) the Spearman correlation coefficient between miRNA abundance and mRNA abundance levels was less than −0.2 (supplemental Table 6).
mRNAs and miRNAs DE by gender
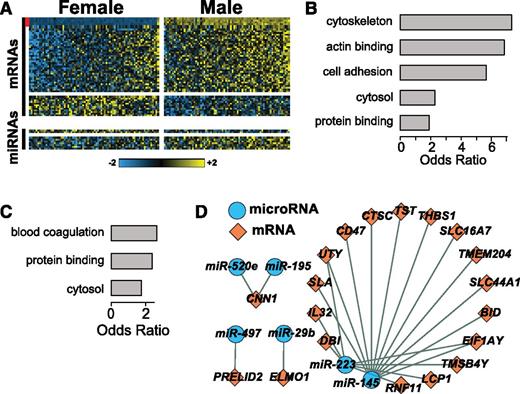
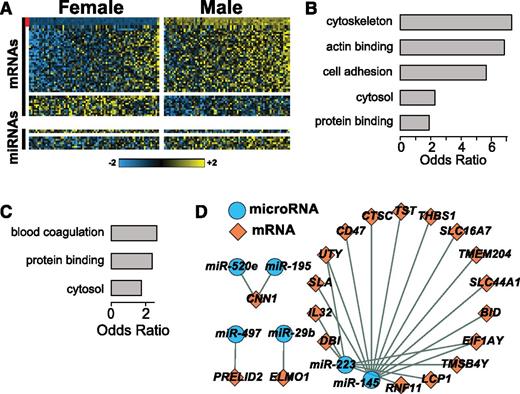
We identified 54 platelet mRNAs as DE by gender (FDR q < 0.05; Figure 4A; supplemental Table 7A). As expected, the Y-chromosome genes (Figure 4A, red bar), EIF1AY, TMSB4Y, UTY, and DDX3Y, were more highly expressed in men (P = 1.22 × 10−82, P = 9.28 × 10−70, P = 2.89 × 10−68, and P = 7.45 × 10−58, respectively; supplemental Table 7A). GO enrichment analysis restricted to the 54 mRNAs DE by gender also revealed well-established GO categories central to platelet function (Figure 4B; supplemental Table 7B).
RNAs associated with gender. (A) Multicomponent heatmap of RNAs DE by gender. The upper 2 heatmaps are mRNAs higher and lower in men compared with women, respectively. The bottom 2 heatmaps show miRNAs higher and lower in men compared with women, respectively. The vertical red stripe indicates probesets mapping to genes located on the Y chromosome. Odds ratios of (B) enriched GO categories among mRNAs DE by gender and (C) putative targets of miRNAs DE by gender. (D) A network of miRNAs-mRNAs DE by gender. Network was generated as in Figure 3 except the miRNA was predicted to target the mRNA by ≥1 target prediction algorithm contained in mirDip, and the Spearman correlation coefficient between miRNA abundance and mRNA abundance was less than −0.15 (supplemental Table 7).
RNAs associated with gender. (A) Multicomponent heatmap of RNAs DE by gender. The upper 2 heatmaps are mRNAs higher and lower in men compared with women, respectively. The bottom 2 heatmaps show miRNAs higher and lower in men compared with women, respectively. The vertical red stripe indicates probesets mapping to genes located on the Y chromosome. Odds ratios of (B) enriched GO categories among mRNAs DE by gender and (C) putative targets of miRNAs DE by gender. (D) A network of miRNAs-mRNAs DE by gender. Network was generated as in Figure 3 except the miRNA was predicted to target the mRNA by ≥1 target prediction algorithm contained in mirDip, and the Spearman correlation coefficient between miRNA abundance and mRNA abundance was less than −0.15 (supplemental Table 7).
mRNAs and miRNAs DE by BMI
No mRNAs were DE by BMI. A single miRNA, miR-27b, was DE by BMI (FDR q < 0.05). GO enrichment analysis restricted to the 15 mRNAs predicted to be targeted by miR-27b revealed no enriched GO categories.
Networks of miRNAs targeting mRNAs co-DE by age and gender
A biological network consists of nodes (miRNAs or mRNAs) and edges (interactions between nodes). We generated separate networks for age and gender in which (1) the mRNA was predicted to contain target binding sites for the miRNA according to the algorithms in the microRNA Data Integration Portal (mirDIP; http://ophid.utoronto.ca/mirDIP/); (2) both miRNA and mRNA were DE for the same characteristic; and (3) there was a negative correlation between miRNA and mRNA abundance levels. The latter criterion was applied to reduce the false-positive rate. Compared with the gender network, more stringent filtering criteria were used for the age network to present comparable sized networks. The resulting networks for miRNA-mRNA pairs DE by age (Figure 3D; supplemental Figure 3 shows the more dense network obtained when using the more lenient criteria) and gender (Figure 4D) are shown. Several findings are worth noting: (1) numerous miRNAs target multiple mRNAs; (2) miR-223 (DE by gender), the most abundant platelet miRNA, is predicted to target 7 mRNAs located on the X chromosome; and (3) the 5p and 3p arms of miR-548a are both DE by age and target nonoverlapping DE mRNAs. Notably, predicted targets of DE age miRNAs were over-represented among the set of mRNAs DE by age (P < .001; over-representation analysis described in supplemental Figure 4). Thus, although the set of mRNAs that is not DE by age contains a few predicted targets of miRNAs DE by age, the set of mRNAs DE by age contains significantly more predicted targets.
Plateletomics Web site
Although our raw data were deposited in Gene Expression Omnibus and is presented in supplemental tables, analysis of these data requires substantial additional computer code. We therefore created a user-friendly interactive public web tool to query this dataset (www.plateletomics.com). The site has multiple levels of functionality, allowing the user to consider relationships among platelet aggregation, mRNA levels, miRNA levels, demographics, and plasma fibrinogen and von Willebrand factor levels.
Relative expression level.
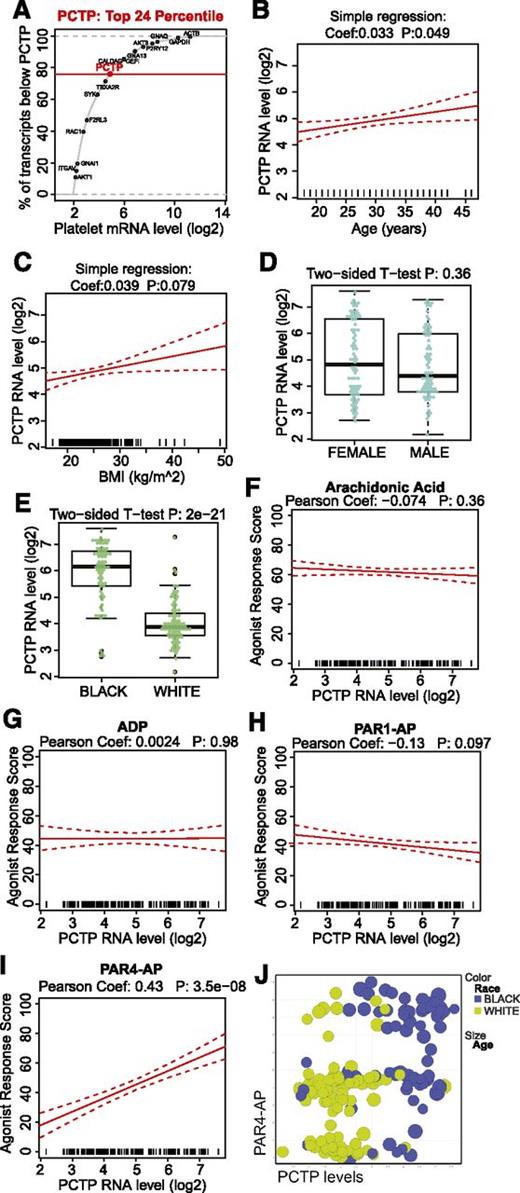
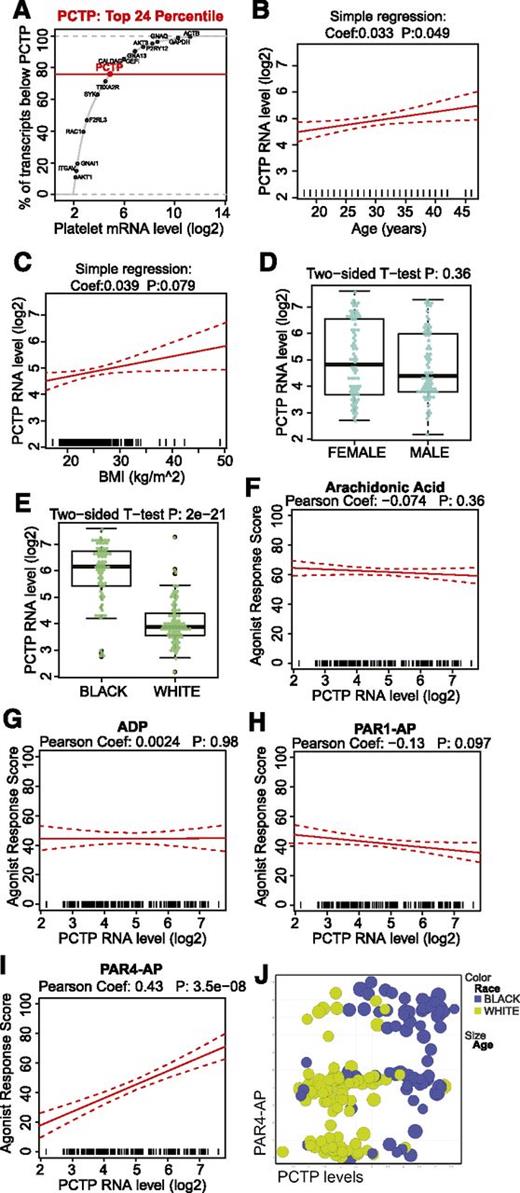
Users enter an mRNA or miRNA gene symbol and obtain a graphical display of the relative expression level of the queried gene among the commonly expressed human platelet RNAs (example of PCTP mRNA shown in all panels of Figure 5). The website also allows visualization of human and mouse levels of a given transcript using published mouse transcriptome data.18
Plateletomics Web site. This figure shows examples of the functionality of the web tool based on PRAX1 data and uses the PCTP mRNA as an example. (A) The user can query the relative expression level among any commonly expressed platelet mRNAs. The queried gene is in red; a set of well-known platelet genes are shown in black for comparison. Relationships of platelet PCTP mRNA levels and demographic features, including (B) age, (C) BMI, (D) gender, and (E) black and white race. Correlations between platelet PCTP mRNA levels and platelet aggregation, including (F) arachidonic acid, (G) ADP, (H) PAR1-AP, and (I) PAR4-AP. (J) Illustration of the capacity to visualize relationships among 4 different variables; in this example, PAR4-AP agonist response (y-axis), platelet PCTP mRNA level (x axis), race (color), and age (size of the data points).
Plateletomics Web site. This figure shows examples of the functionality of the web tool based on PRAX1 data and uses the PCTP mRNA as an example. (A) The user can query the relative expression level among any commonly expressed platelet mRNAs. The queried gene is in red; a set of well-known platelet genes are shown in black for comparison. Relationships of platelet PCTP mRNA levels and demographic features, including (B) age, (C) BMI, (D) gender, and (E) black and white race. Correlations between platelet PCTP mRNA levels and platelet aggregation, including (F) arachidonic acid, (G) ADP, (H) PAR1-AP, and (I) PAR4-AP. (J) Illustration of the capacity to visualize relationships among 4 different variables; in this example, PAR4-AP agonist response (y-axis), platelet PCTP mRNA level (x axis), race (color), and age (size of the data points).
RNA levels by demographic features.
Correlation plots and P values are shown for mRNA and miRNA levels vs age and BMI; box plots and P values are shown for mRNA and miRNA levels by gender and race.
Platelet agonist response by RNA level.
This graphic displays correlation plots and P values between platelet aggregation and mRNA or miRNA levels.
Multidimensional relationships.
Higher-level functionality permits user-defined visualization of 4 variables simultaneously (Figure 5J shows the PAR4 aggregation response vs PCTP mRNA levels by race and age of each subject).
Discussion
We generated an unusually rich dataset from 154 normal individuals and are unaware of other studies that include mRNAs and miRNAs coexpressed in the same primary human tissue for which physiology measures and demographic information are available. Our major finding was the identification of miRNAs targeting mRNA in which each RNA type was DE by the same phenotype (age or gender). The inverse relationship between the RNAs in these pairs suggests miRNAs may regulate mRNA levels on aging and between genders. We also provide web-based access to both the genome-wide expression data and the functional and demographic data. Too often the raw genomic and transcriptomic data deposited at GEO and other repositories become data tombs where data go to die30 because of barriers for biologists and non-informaticians not facile with writing computer code necessary to exploit such data. We constructed a simple and rapid web-based interface to remove these barriers. The interface provides query functionality and visualizations of the queries, as well as links to external resources annotating genes and miRNA. This site extends the utility of our data as a resource for analyses by other investigators and presents a valuable model for how such data may be shared to increase discovery.
Relevance to platelet biology
Our estimate of 7771 commonly expressed platelet genes was consistent with other reports of genome-wide microarray27,31 and RNA-seq16,18 analyses of smaller numbers of samples. The size of our dataset permits accurate estimates of platelet RNA levels in healthy subjects. It is likely that transcript levels will be altered by disease, but our analyses permit rational interpretation of RNA levels and profiles in disease. Notably, a subset of mRNA probesets could not be uniquely mapped, so investigators who do not find their gene of interest when querying our data should consider the ambiguous genes/probesets listed in supplemental Table 2. Prior platelet transcriptomic studies have not included both long and short RNAs and lack corresponding physiology data. Furthermore, it is of interest to know the relative gene expression levels between human and mouse platelets for both optimal experimental design and interpretation, and our web tool permits easy comparisons between species. Last, platelet light transmission aggregometry is the gold standard for platelet function, is reproducible over time,20 and has been used to establish dosing of antiplatelet medications, such as aspirin and clopidogrel, commonly used in the treatment and prevention of myocardial infarction. Our dataset enables testing for associations between specific RNA levels and the platelet aggregation response in an unbiased manner.
Effect of age on RNA expression
Numerous physiologic pathways are believed to be involved in normal aging and a normal lifespan, and the genetics of aging is believed to be complex.32 Genome-wide DNA approaches have been disappointing to date, but study designs are complicated by the complexity of the process, including gene-environment interactions, epigenetics, differences in definitions of young and old, etc. APOE was the only gene with variants identified as meeting genome-wide significance in a study of long-lived individuals compared with younger controls.33 APOE mRNA levels from rat brain and liver did not change with aging.34,35 Although murine hematopoietic stem cells alter their transcriptomes on aging,36 there have been no prior reports of transcript changes in normal aging human tissue. We identified 129 mRNAs DE by age but APOE was in the bottom 13th percentile of platelet transcripts and was not DE by age in PRAX1. Our GO enrichment analysis of mRNAs DE by age showed a significant enrichment for numerous gene categories critical for platelet activation, most notably pathways of signal transduction and granule secretion. We also determined that mitochondrial mRNA levels were inversely correlated with age. Mitochondrial gene SNPs and haplotypes have been noted to vary with healthy human aging,32 and selected mitochondrial mRNAs and proteins are altered in disease,37 but we are not aware of reports of global mRNA alterations with healthy aging.
The levels of different miRNAs have been positively and negatively correlated with age in both Caenorhabditis elegans and mice.38 Indeed, loss of function, overexpression, and knockdown of specific miRNAs has been shown to affect lifespan. However, there is a paucity of information on the relationship of age and miRNA expression in healthy human primary tissues.39-41 In our large sample size, 15 miRNAs were DE by age, with 11 of 15 decreasing with older age, consistent with a small study that profiled miRNAs from the peripheral blood mononuclear cells of 2 young and 2 old subjects.39 Of interest, miRs-128, -106a, -18a, -484, 548a-3p, and -425 significantly decreased with aging in both platelets and peripheral blood mononuclear cells. Two of the 4 platelet miRNAs that increased with aging, miR-29a and miR-23a, were also increased in the aging human epididymides.40 Our finding that miR-22 was down-regulated with age in platelets has also been observed in a small study of human muscle.41 Our data will serve as a useful resource for analyses of miRNAs in age-related human disease.
Effect of gender on RNA expression
In PRAX1, we observed 42 of the 54 mRNA DE by gender were more highly expressed in men, including the previously mentioned Y-chromosome genes. The X-chromosome genes EFHC2 and FUNDC1 were more highly expressed in women (P = 9.58 × 10⁻⁸ and P = .004, respectively) and could represent escape from inactivation. EFHC2 has been shown to be expressed at higher levels in monocytes from women than men.42 Metallothionein genes or pseudogenes were 4 of the 9 mRNAs showing the highest expression in women in PRAX1 (supplemental Table 7A), perhaps due to estrogen-induced increase in cadmium levels that transcriptionally upregulate metallothionein genes.43
Although miRNAs have been reported to be DE by gender in the Ascaris nematode,44 we are unaware of prior reports of human miRNA profile comparisons of gender differences in any tissue. In PRAX1, we observed 2 of the 9 miRNAs DE by gender were more highly expressed in women. Song et al reported that many X-linked miRNAs escape inactivation during prophase of meiosis of mouse sperm.45 Of interest, 3 of the 7 mRNAs DE by gender were predicted to be targeted by the X-chromosome miR-223 that was also DE by gender, raising the intriguing possibility that X-chromosome miRNAs could contribute to sex differentiation by repressing Y-chromosome genes.
miRNAs and mRNAs that are both DE by the same demographic variables may be of particular biologic interest. Because a miRNA-targeted mRNA complexed with Argonaute often results in mRNA degradation,46 we generated networks with an inverse expression relationship between the miRNA and the target mRNA. Although this last criterion excludes miRNA-mRNA pairs in which the miRNA inhibits translation but does not cause degradation of the mRNA, this approach yielded networks of relatively modest size for both age and gender, and the high stringency is expected to reduce false-positive miRNA-mRNA pairs.
BMI, race, and RNA expression
Our multiple regression analysis identified no platelet mRNAs that were DE by BMI in our cohort, whereas platelet transcripts encoding inflammatory markers have been associated with BMI in a prior candidate gene study.47 The reason for this apparent discrepancy is unclear, but may be related to different subject demographics or methods for platelet and platelet RNA purification. We recently demonstrated mRNAs and miRNAs DE by race.25
Summary
We provide a unique 154-subject dataset and a web-based query tool (www.plateletomics.com) of coexpressed mRNAs and miRNAs and physiology from primary human cells. Uses of the data presented in this article and the web tool we generated are summarized in Table 4. These results and future analyses are expected to provide new biologic insight into relationships among cell function, RNA levels, and demographic variables. The identification of miRNA-mRNA pairs that were DE by age or gender suggests that a small number of master miRNAs may regulate genes affecting these fundamental biologic processes. Future association studies between platelet RNAs and either ex vivo platelet function or in vivo platelet-mediated hemostasis and thrombosis must account for age and gender.
This article contains a data supplement.
There is an Inside Blood commentary on this article in this issue.
The publication costs of this article were defrayed in part by page charge payment. Therefore, and solely to indicate this fact, this article is hereby marked “advertisement” in accordance with 18 USC section 1734.
Acknowledgments
The authors thank Carol Sun, Kathleen Delgrosso, Megan Hevelow, and the Cardeza Special Hemostasis Laboratory for technical help.
This work was funded by National Heart, Lung and Blood Institute grant R01HL102482.
Authorship
Contribution: L.M.S. and E.S.C. analyzed data, wrote the manuscript, and generated the Web site; L.C.E. performed the research, analyzed data, and wrote the manuscript; S.N., J.-f.D., and P.F. designed the research; A.B.W. recruited subjects and performed experiments; X.K. and L.M. performed experiments; S.K., M.H., and S.E.M. analyzed the data; and P.F.B. and C.A.S. designed the research, analyzed the data, and wrote the manuscript.
Conflict-of-interest disclosure: The authors declare no competing financial interests.
Correspondence: Paul F. Bray, The Cardeza Foundation for Hematologic Research and the Department of Medicine, Thomas Jefferson University, Jefferson Alumni Hall, Room 394, 1020 Locust St, Philadelphia, PA 19107; e-mail: paul.bray@jefferson.edu.

