Abstract
Background: There has been major improvement in the survival of patients diagnosed with multiple myeloma (MM) over the past two decades. Such improvement has been attributed to the broader use of hematopoietic progenitor cell transplantation and novel drugs that prolong initial remission and more successfully treat relapsed disease. Early mortality (EM), here defined as death in the first year after diagnosis, is uncommon in modern MM trials. The magnitude of EM in unselected patients with MM and its impact on overall outcomes in this disease is unknown
Methods: We analyzed EM in MM utilizing data from the Surveillance Epidemiology and End Result Program (SEER-13). Patients diagnosed with MM as first malignant neoplasm between 1993 and 2010 (follow up until end of 2011) were included. Cases reported from death certificate or autopsy only were excluded, along with patients recorded as alive but with no survival time (<1% of total). Relative EM rates (1 – relative survival) used data from the US population in 2000 as reference. We described EM for different population groups, changes over time and performed multivariate analysis (binary logistic regression) to assess risk factors for EM in MM. To assess the impact of factors other than reduction in EM in the increased survival of MM, we performed a landmark survival analysis including only those patients who survived at least 1 year after diagnosis.
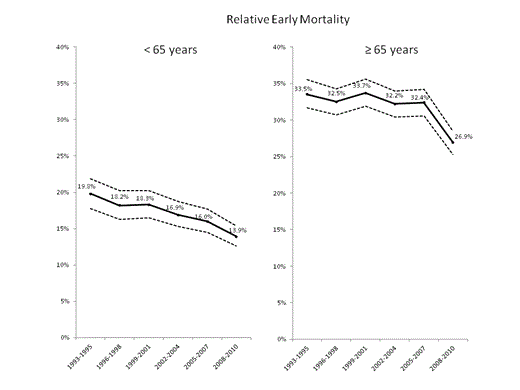
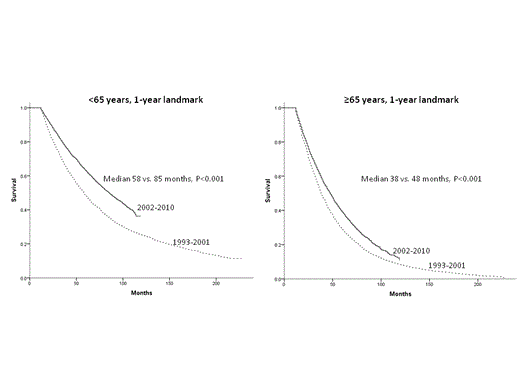
Results: There were 30,324 patients in the analysis, 11,439 diagnosed at age < 65 and 18,885 at age ≥ 65. Absolute EM was 17.6% and 35.3% while relative EMwas 16.9% and 31.7% for the younger and the older groups respectively. There was decline of relative EM rates that occurred in both age groups but only became evident among older patients after 2005 (Figure 1). In multivariate analysis, factors associated with increased risk of EM were male sex, age ≥65 years , diagnosis in 1993-2001, presence of primary plasma cell leukemia, low household income and residence in the coverage area of certain SEER registries (Table 1). Landmark analysis of 1-year survivors demonstrated increased survival from 1993-2001 to 2002-2010 for patients < 65 (median 58 vs. 85 months, P<0.001) and for patients ≥ 65 (median 38 vs. 48 months, P<0.001, Figure 2).
Conclusions: Reduction in EM partially explains population improvements in MM overall survival. EM remains high in MM and a major barrier for continued improvement in survival outcomes.
| Factor . | Reference . | OR . | 95% C.I. . | P . |
|---|---|---|---|---|
| Female sex | Male | 0.90 | 0.85-0.95 | <0.001 |
| Year of diagnosis 1993-2001 | 2002-2010 | 1.16 | 1.10-1.22 | <0.001 |
| Plasma Cell Leukemia | Multiple Myeloma | 5.62 | 4.17-7.58 | <0.001 |
| Age ≥65 years | < 65 years | 2.56 | 2.42-2.72 | <0.001 |
| Race-ethnicity | <0.001 | |||
| NHB | NHW | 0.97 | 0.90-1.04 | 0.39 |
| Hispanic | NHW | 1.04 | 0.95-1.14 | 0.41 |
| AIAN | NHW | 0.90 | 0.63-1.28 | 0.56 |
| API | NHW | 0.84 | 0.75-0.94 | 0.004 |
| Median household income# | 0.91 | 0.87-0.95 | <0.001 | |
| SEER registry | <0.001 | |||
| Alaska | Los Angeles | 1.37 | 0.62-3.02 | 0.43 |
| Atlanta | Los Angeles | 1.003 | 0.89-1.14 | 0.96 |
| Connecticut | Los Angeles | 0.83 | 0.75-0.93 | 0.002 |
| Detroit | Los Angeles | 1.06 | 0.96-1.16 | 0.23 |
| Hawaii | Los Angeles | 1.21 | 1.01-1.45 | 0.04 |
| Iowa | Los Angeles | 0.89 | 0.80-0.99 | 0.03 |
| New Mexico | Los Angeles | 0.88 | 0.77-1.01 | 0.07 |
| Rural Georgia | Los Angeles | 1.10 | 0.76-1.58 | 0.63 |
| San Francisco-Oakland | Los Angeles | 0.99 | 0.86-1.11 | 0.87 |
| San Jose-Monterey | Los Angeles | 1.05 | 0.87-1.12 | 0.51 |
| Seattle-Puget Sound | Los Angeles | 0.91 | 0.83-1.01 | 0.08 |
| Utah | Los Angeles | 1.13 | 0.98-1.29 | 0.08 |
NHB= non-Hispanic Blacks;, NHW= non-Hispanic Whites; AIAN= American Indian, Alaska Natives; API= Asian and Pacific Islanders; #Per US$ 10,000
No relevant conflicts of interest to declare.
Author notes
Asterisk with author names denotes non-ASH members.


