Abstract
Objectives: To evaluate the clinical utility of the novel heavy/light chain immunoassay for the assessment of multiple myeloma patients.
Methods: Serum samples of 99 multiple myeloma patients in different disease stages (74 IgG, 25 IgA) were analysed. Disease assessement was performed by standard laboratory procedures (SPE, serum IFE, serum free light chain assay [FLC], quantitative immunoglobulins, serum beta-2-microglobulin, as well as basic biochemistry and hematology tests) in addition to bone marrow analysis and the novel heavy/light chain assay (HLC). Serum HLC and FLC measurements were obtained using the polyclonal antisera assay Hevylite™ and Freelite™ respectively (The Binding Site, Birmingham, UK) and performed on a Dade BNII analyser (Siemens). SPE and sIFE were performed on a SEBIA Hydrasis platform. Total immunglobulins were measured using Tina-quant Gen.2 reagents on a Roche Cobas 6000cee platform. Statistical analysis was performed using the R package software (R Development Core Team, Vienna, Austria).
Results: The majority of patients (61/99) had total immunoglobulin measurements within normal ranges. However, HLC measurement revealed 16/61 patients to have an abnormal HLC ratio, signifying monoclonality. Furthermore, 5/23 patients who had achieved a complete response (CR) were found to have an abnormal HLC ratio, indicating the presence of residual disease. Subsequently, 2/5 of these patients suffered relapse during the follow-up period.
Analysing the entire group of patients, notable statistically significant correlations were observed for the percentage of clonal plasma cells in the bone marrow and an abnormal serum FLC ratio with an abnormal HLC ratio (p=0.0004 and p=0.0001 respectively) as well as an extremely abnormal HLC ratio (<0.02 or >40; p=0.003 and p=0.01 respectively).
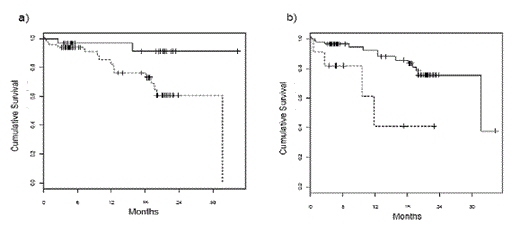
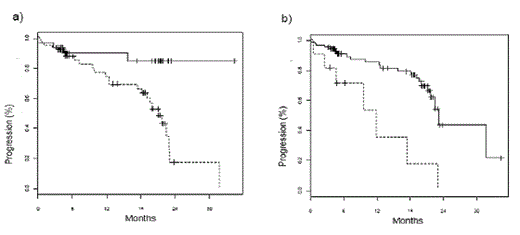
Kaplan-Meier analysis for the entire group showed that overall survival (OS) in patients with abnormal HLC ratios or, in particular, extremely abnormal HLC ratio values was significantly shorter (median survival 31.7 month vs. median not reached, p = 0.021; median 11.8 month vs. 31.7 months; p = 0.0032, respectively, figures 1a and 1b). A significantly shorter time to progression (TTP) was also associated with abnormal or extremely abnormal HLC ratio values (median 21.1 months vs median not reached, p = 0.006; median 11.8 months vs 23.1 months, p = 0.0004; figures 2a and 2b). Interestingly, suppression of the polyclonal isotype pair was also associated with a significantly shorter TTP (median 21.1 months vs median not reached, p = 0.029). In multivariate analysis, abnormal HLC ratio values proved to be an independent prognostic risk factor (p = 0.05; table 1).
Conclusion: The novel heavy/light chain allows accurate measurement of monoclonal immunoglobulins and can be more sensitive than standard techniques at detecting residual disease. Abnormal heavy/light chain ratios and immunoglobulin isotype pair suppression may have prognostic significance for multiple myeloma patients.
Overall survival in patients stratified according to HLC ratio values. a) Median survival was 31.7 months in patients with abnormal HLC ratio values (dotted line) and was not reached in patients with normal values (full line, p = 0.021). b) the difference is even bigger when patients were stratified by extreme values of HLC ratio (< 0.02 or > 40). Median survival was 11.8 months in patients with extreme HLC ratio values (dotted line) and 31.7 months in patients with less extreme values (full line, p = 0.0032).
Overall survival in patients stratified according to HLC ratio values. a) Median survival was 31.7 months in patients with abnormal HLC ratio values (dotted line) and was not reached in patients with normal values (full line, p = 0.021). b) the difference is even bigger when patients were stratified by extreme values of HLC ratio (< 0.02 or > 40). Median survival was 11.8 months in patients with extreme HLC ratio values (dotted line) and 31.7 months in patients with less extreme values (full line, p = 0.0032).
Time to progression in patients stratified according to HLC ratio values. a) Median time to progression was 21.1 months in patients with abnormal HLC ratio values (dotted line) and was not reached in patients with normal values (full line, p = 0.006). b) when patients were stratified by extreme values of HLC ratio (< 0.02 or > 40), median time to progression was 11.8 months in patients with extreme HLC ratio values (dotted line) and 23.1 months in patients with less extreme values (full line, p = 0.0004).
Time to progression in patients stratified according to HLC ratio values. a) Median time to progression was 21.1 months in patients with abnormal HLC ratio values (dotted line) and was not reached in patients with normal values (full line, p = 0.006). b) when patients were stratified by extreme values of HLC ratio (< 0.02 or > 40), median time to progression was 11.8 months in patients with extreme HLC ratio values (dotted line) and 23.1 months in patients with less extreme values (full line, p = 0.0004).
Multivariate Cox regression analysis
| Risk factor . | Relative risk . | 95% confidence interval . | "p" value . |
|---|---|---|---|
| abnormal IgGκ/IgGλ;IgAκ/IgAλ ratio | 3.55 | 0.96 – 13.20 | 0.05 |
| HLC isotype absolute value > median | 0.73 | 0.27 – 1.97 | 0.54 |
| abnormal serum FLC ratio | 1.24 | 0.45 – 3.45 | 0.68 |
| “low” serum albumin | 4.25 | 1.66-10.88 | 0.003 |
| “high” beta 2 microglobulin | 2.94 | 1.13-7.68 | 0.03 |
Last:The Binding Site: Employment.
Author notes
Asterisk with author names denotes non-ASH members.


