Key Points
Eight extracellular biomarkers define the metabolic age of stored RBCs.
Metabolomics defines a universal signature of RBC storage lesion.
Abstract
Metabolomic investigations of packed red blood cells (RBCs) stored under refrigerated conditions in saline adenine glucose mannitol (SAGM) additives have revealed the presence of 3 distinct metabolic phases, occurring on days 0-10, 10-18, and after day 18 of storage. Here we used receiving operating characteristics curve analysis to identify biomarkers that can differentiate between the 3 metabolic states. We first recruited 24 donors and analyzed 308 samples coming from RBC concentrates stored in SAGM and additive solution 3. We found that 8 extracellular compounds (lactic acid, nicotinamide, 5-oxoproline, xanthine, hypoxanthine, glucose, malic acid, and adenine) form the basis for an accurate classification/regression model and are able to differentiate among the metabolic phases. This model was then validated by analyzing an additional 49 samples obtained by preparing 7 new RBC concentrates in SAGM. Despite the technical variability associated with RBC processing strategies, verification of these markers was independently confirmed in 2 separate laboratories with different analytical setups and different sample sets. The 8 compounds proposed here highly correlate with the metabolic age of packed RBCs, and can be prospectively validated as biomarkers of the RBC metabolic lesion.
Introduction
More than 100 million red blood cell (RBC) units are collected yearly worldwide. Processing strategies, storage solutions, and maximum allowed shelf-lives are not universal and vary across regions. Transfusion of high-quality RBCs is an essential part of modern health care,1 however, refrigerated storage promotes the onset of complex biochemical and physiological changes to RBCs, collectively known as the “storage lesion.”2-5 In recent years, the storage lesion has been extensively studied through integrated omics and systems biology approaches.4,6-17 We recently reported how metabolomics was able to reveal a clear metabolic signature descriptive of the RBC storage lesion.10 Then, we demonstrated that RBCs stored in the blood bank do not simply undergo a monotonic decay, but experience a more complex change in metabolism that involves the development of 3 discrete metabolic phenotypes.10 These metabolic phenotypes define a 3-phase metabolic decay profile associated with storage time in saline adenine glucose mannitol (SAGM).10 We also characterized each metabolic phase by determining the systemic changes in metabolic pathway usage between the 3 stages, finding the key pathways and showing how they change in both magnitude and direction.10 These results were independently corroborated in a parallel study that demonstrated how RBCs stored in a different storage additive solution 3 (AS3) undergo a similar 3-phase decay.16
The clinical implication of “old” RBC units is a controversial issue, because results provided by retrospective studies and randomized clinical trials are not in agreement.18-27
Even if the full clinical impact of the storage lesion28 and, specifically, of this multiphase metabolic decay, remains to be elucidated, it can be argued that all the metabolomics studies performed so far showed almost complete overlap of metabolic profiles of RBCs stored in different storage additives, despite interlaboratory strategies and metabolomics platforms.13 For these reasons, we believe that an underlying signature of the RBC storage lesion exists across various media solutions and processing techniques, and that it can be translated in biomarkers that define the metabolic stage of stored RBCs.
Good biomarkers should exhibit high sensitivity (the fraction of correctly identified true positives) and high specificity (the fraction of correctly identified true negatives). For this reason, the use of receiver operating characteristic (ROC) curves is currently one of the standard procedures in medical biomarker studies.29
In this study, 2 data sets from stored RBC units were generated in two laboratories with 2 different mass spectrometry (MS)-based metabolomics approaches, and were used to identify a set of reliable biomarkers that reveal their metabolic state independent of technical variables and storage solutions. A third data set was then generated to validate the biomarkers.
Material and methods
Blood collection and processing into SAGM and AS3-packed RBCs
Blood was collected from 10 healthy donors in accordance with the Declaration of Helsinki, and log4 leukocyte-filtered (Pall Corp., Braintree, MA) packed RBCs were collected in CP2D or CPD, and then after separation of RBCs the first were stored in AS3 (n = 4) (Table 1; data set 2) and the second in SAGM (n = 6) (Haemonetics Corp., Braintree, MA) (Table 1; data set 3). Units were sterilely sampled (1 mL per time point) at storage days 1, 8, 15, 22, 29, 36, to 42 on a weekly basis. For the AS3 arm of the study, cells and supernatants were separated through centrifugation at 2000 × g for 10 minutes at 4°C at each time point.
Ultra high performance liquid chromatography (UHPLC)-MS metabolomics analyses
Metabolomics analyses were performed as previously reported.17 Briefly, 100 μL stored RBCs and 20 μL of supernatants were collected on a weekly basis, extracted at 1:9 and 1:25 dilutions in methanol:acetonitrile:water (5:3:2), vortexed, and centrifuged at 10 000 × g for 15 minutes at 4°C to pellet proteins, prior to analysis of the deproteinated supernatants by UHPLC-MS (Vanquish-Q Exactive; Thermo Fisher Scientific, San Jose, CA).1 For metabolomics analyses, 10 μL of sample extracts were injected into an UHPLC system and run on a Kinetex XB-C18 column (150 × 2.1 mm ID, 1.7 μm particle size [Phenomenex, Torrance, CA]) using either a 3 minute isocratic flow at 250 μL per minute (mobile phase: 5% acetonitrile, 95% 18 mΩ H2O, 0.1% formic acid) or a 9 minute gradient from 5% to 95% organic solvent B (mobile phases: A = 18 mΩ H2O, 0.1% formic acid; B = methanol, 0.1% formic acid). The UHPLC system was coupled online with a Q Exactive System (Thermo Fisher Scientific), scanning in full MS mode (3 minute method) or performing acquisition-independent fragmentation (MS/MS analysis, 9 minute method) at 70 000 resolution in the 60 to 900 m/z range, 4 kV spray voltage, 15 sheath gas and 5 auxiliary gas, and operated in negative and then positive ion mode (separate runs).
Data analysis
Three independent data sets were used in this study (Table 1).
Data set 1.
The first data set was obtained by sampling RBC units stored in SAGM solution by a European group in Iceland and previously published by our group.10 Missing values were replaced by the minimum positive values detected for each parameter. The data were first batch normalized as previously described,8 by dividing each variable of each batch by the square root of the sum of the squares of all original values of that batch. The data set was then normalized by constant sum, log transformed, and scaled by using the unit variance scaling method (mean-centered and divided by the standard deviation [SD] of each variable).
Data set 2.
The second data set was obtained at the University of Colorado Denver (UC Denver) by analyzing a novel sample set of RBCs stored in AS3 solution, consistent with processing, sampling, and analysis previously described by our group for hydrophilic16 and hydrophobic compounds.17 Missing values were replaced by the minimum positive values detected for each parameter. The data set was then normalized by constant sum, log transformed, and scaled by using the unit variance scaling method (mean-centered and divided by the SD of each variable).
Data set 3.
The third data set was obtained at UC Denver, and samples were kindly provided by European collaborators for independent validation of the data set 1. Missing values were replaced by the minimum positive values detected for each parameter. The data set was then normalized by constant sum, log transformed, and scaled by using the unit variance scaling method (mean-centered and divided by the SD of each variable).
Correlation analysis was performed using MetaboAnalyst 3.0.30 Pearson correlation was used to measure the correlation upon determination of normal distribution of tested samples through the Kolmogorov-Smirnov test. Principal component analysis (PCA) was performed using MetaboAnalyst30 in order to individuate any variation in the obtained data set. Univariate ROC curves analysis was performed to evaluate the diagnostic power of all elements by using MetaboAnalyst.30
MetaboAnalyst30 was used for the multivariate ROC curves analysis. This analysis was performed by using 8 selected extracellular metabolites (5-oxoproline, adenine, glucose, lactic acid, malic acid, nicotinamide, hypoxanthine, and xantine) obtained from data set 1 only. The performance of the generated models was cross-validated by using a linear support vector machine. In brief, models were validated through repeated random subsampling cross validation, where in each cross validation, two-thirds of the samples were used to evaluate the importance of each feature based on decreases in accuracy. The generated models were then further validated by 1000 permutation tests using the area under the curve (AUC) as performing measure. The generated models were then used to predict the metabolic state of samples from data set 3, an independent data set prospectively collected in a separate laboratory (UC Denver instead of Iceland) with alternative UHPLC-MS approaches.
Results
The goal of this study was to define robust biomarkers able to express the metabolic age of stored RBCs independent of blood component processing-dependent variables. To achieve this, we used 3 different data sets obtained by collecting blood from 31 different donors. The first data set (data set 1; Table 1) was previously published by our group.10 In this previous work, we analyzed this data set by applying principal component analysis showing that RBCs experience a 3-phase metabolic decay process during storage in SAGM, resulting in the definition of 3 distinct metabolic phenotypes. These 3 phenotypes occur between days 1 to 10, 10 to 18, and after day 18 of cold storage.10
In the present work, the same data set (data set 1; Table 1) was analyzed by using univariate and multivariate ROC curves analysis with the objective of defining biomarkers able to differentiate the metabolic phases experienced by RBCs during the storage.
The other 2 data sets (data sets 2 and 3; Table 1) were generated to validate the results of this study.
Biomarkers for RBCs stored in SAGM
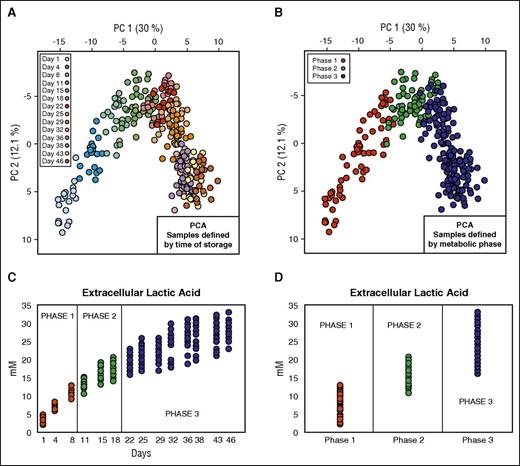
The first data set (data set 1; Table 1)10 contained data coming from metabolomics analysis of 20 RBC units. In the light of previous in silico prediction models of metabolic stages during routine refrigerated storage from our group,10 we rearranged this data set to create 3 groups representing the 3 metabolic phases previously described (Figure 1). These metabolic phases are as follows: phase 1 (n = 60) from day 1 to day 10; phase 2 (n = 60) from day 11 to day 18; and phase 3 (n = 160) from day 18 to day 46. In our data analysis, we considered a total of 111 intra- and extracellular metabolites.
Data set definition. (A) PCA of 20 RBC units where the color of the solid circles is defined by time of storage. (B) PCA of 20 RBC units where the color of the solid circles is defined by metabolic phase. (C) Profile of extracellular lactic acid during the storage. (D) Profile of extracellular lactate in the 3 different metabolic phases.
Data set definition. (A) PCA of 20 RBC units where the color of the solid circles is defined by time of storage. (B) PCA of 20 RBC units where the color of the solid circles is defined by metabolic phase. (C) Profile of extracellular lactic acid during the storage. (D) Profile of extracellular lactate in the 3 different metabolic phases.
We then calculated the ROC curves for each metabolite, in order to identify a set of biomarkers capable of defining the 3 metabolic phases. For AUC for all parameters, see supplemental Tables 1-2, available on the Blood Web site. Several extracellular and intracellular parameters are able to differentiate among the 3 phases. In particular, 32 extracellular metabolites had AUC higher than 0.75 when comparing phase 1 vs phase 2 (supplemental Table 1). Comparing phase 1 vs phase 3, we found that 39 extracellular metabolites were able to differentiate between these 2 phases (AUC >0.75) and 22 extracellular metabolites had AUC higher than 0.75 when comparing phase 2 vs phase 3 (supplemental Table 1).
Moreover, 15 of these extracellular metabolites (lactic acid, nicotinamide, glucose, 5-oxoproline, hypoxanthine, xanthine, malic acid, adenine, K, Cl, Na, glycerophocholine, choline, phosphate, and betaine) had AUC higher than 0.75 for all 3 comparisons (supplemental Table 1).
Intracellular metabolites had less discriminant power. For instance, 27 intracellular metabolites had AUC higher than 0.75 when comparing phase 1 vs phase 2 (supplemental Table 2). Comparison of phase 1 vs phase 3 resulted in 36 intracellular metabolites with AUC >0.75, whereas 20 intracellular metabolites had AUC higher than 0.75 for phase 2 vs phase 3 (supplemental Table 2). Only 10 of these intracellular metabolites (5-oxoproline, fructose-6-phosphate, xanthine, lactic acid, uridine, mannitol, phosphocholine, adenine phosphoglyceric acid, and propionyl-carnitine) had AUC higher than 0.75 for all the 3 comparisons (supplemental Table 2).
Biomarker comparison between RBCs stored in SAGM and AS3
In light of independent reports showing a similar 3 stage distribution of metabolic phenotypes of RBCs stored in AS3, the next step was to extend our previous analysis to a new data set obtained using an additive solution other than SAGM. LC-MS based metabolomics analysis was performed on 4 RBC units stored for 42 days in AS3 storage solution (data set 2; Table 1). We first rearranged this data as described above, creating 3 groups (phase 1, n = 8; phase 2, n = 4; and phase 3, n = 16), and then calculated the ROC curves.
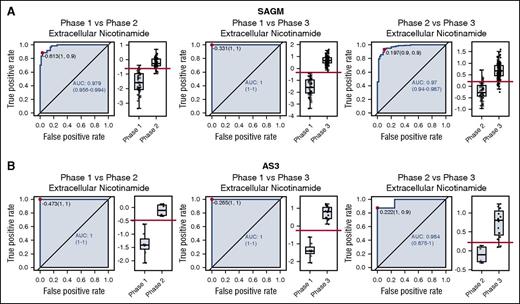
In order to compare the ROC curves obtained for SAGM and AS3, we focused on the metabolites in common between the 2 data sets. The 2 data sets had 27 extracellular metabolites (supplemental Table 3) and 52 intracellular metabolites (supplemental Table 4) in common. We then selected metabolites that had an AUC higher than 0.75 for both data sets and in all 3 conditions (phase 1 vs phase 2, phase 1 vs phase 3, and phase 2 vs phase 3). This selection provided 3 intracellular metabolites (lactic acid, 5-oxoproline, and xanthine) and 8 extracellular metabolites (lactic acid, nicotinamide, 5-oxoproline, xanthine, hypoxanthine, glucose, malic acid, and adenine) with a good discriminating power (AUC >0.75). Figure 2 shows the ROC curves for the 3 comparisons for extracellular nicotinamide.
ROC curves for extracellular nicotinamide comparing pairwise all 3 metabolic phases during cold storage of RBCs. (A) ROC curves obtained from storage in SAGM. (B) ROC curves obtained from storage in AS3.
ROC curves for extracellular nicotinamide comparing pairwise all 3 metabolic phases during cold storage of RBCs. (A) ROC curves obtained from storage in SAGM. (B) ROC curves obtained from storage in AS3.
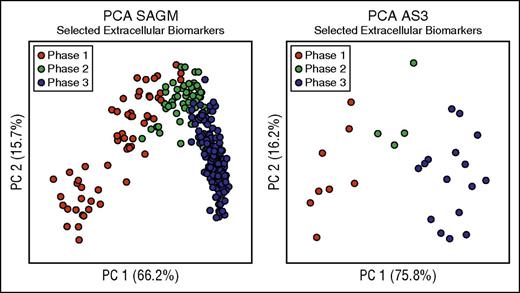
We then focused on the extracellular metabolites because they are easier to measure and had better discriminating power as described above (Table 2). We selected these 8 extracellular metabolites as biomarkers able to characterize the metabolic state of RBCs stored in both SAGM and AS3 (Figure 3; Table 2). In fact, as shown in Figure 3, PCA performed on only the selected 8 extracellular biomarkers was able to clearly describe the 3-phase metabolic decay process previously described in both SAGM10 and AS3.16 Moreover, they also correlated well with each other (supplemental Table 5). Average concentrations of these 8 extracellular biomarkers in the 3 metabolic phases are reported in supplemental Table 6.
Biomarkers selection. This figure considers only 8 biomarkers (lactic acid, nicotinamide, 5-oxoproline, xanthine, hypoxanthine, glucose, malic acid, and adenine) to define the metabolic states of RBCs during cold storage. (A) PCA performed on selected extracellular SAGM biomarkers. (B) PCA performed on selected extracellular AS3 biomarkers.
Biomarkers selection. This figure considers only 8 biomarkers (lactic acid, nicotinamide, 5-oxoproline, xanthine, hypoxanthine, glucose, malic acid, and adenine) to define the metabolic states of RBCs during cold storage. (A) PCA performed on selected extracellular SAGM biomarkers. (B) PCA performed on selected extracellular AS3 biomarkers.
Prediction of RBC metabolic state by using a classification/regression model
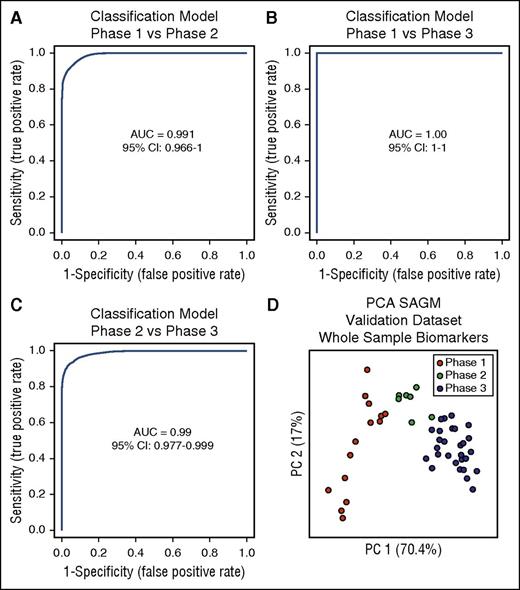
The next step was to test these selected biomarkers for the identification of the metabolic state of RBCs. We used multivariate ROC curves analysis and built 3 different classification/regression models for each condition (phase 1 vs phase 2, phase 1 vs phase 3, and phase 2 vs phase 3) using the 8 selected extracellular biomarkers obtained from the SAGM data set. Linear support vector machine was used for this scope, resulting in 3 different classification/regression models. All of them had strong diagnostic power with an AUC = 0.991 for phase 1 vs phase 2, AUC = 1 for phase 1 vs phase 3, and AUC = 0.99 for phase 2 vs phase 3 (Figure 4A-C).
Three classification/regression models. (A) Phase 1 vs phase 2. (B) Phase 1 vs phase 3. (C) Phase 2 vs phase 3. (D) PCA of a SAGM data set obtained by metabolomics analysis of RBCs. This data set was used to test the predictive power of the 3 models generated. CI, confidence interval.
Three classification/regression models. (A) Phase 1 vs phase 2. (B) Phase 1 vs phase 3. (C) Phase 2 vs phase 3. (D) PCA of a SAGM data set obtained by metabolomics analysis of RBCs. This data set was used to test the predictive power of the 3 models generated. CI, confidence interval.
The performed cross-validation showed average accuracies of 0.937 for the model phase 1 vs phase 2, 1.0 for the model phase 1 vs phase 3, and 0.931 for the model phase 2 vs phase 3. During the permutation tests, none of the results were better than those of the original, obtaining a P < .001 in all 3 models (supplemental Figure 1).
We generated a new data set (data set 3; Table 1) obtained from 7 RBC units in SAGM stored for 42 days and performed metabolomics analysis on whole RBC samples (without separation of supernatants and cells), after 1, 8, 15, 22, 29, 36, and 42 days of storage. We then used this data set for validation of the classification models and predicted the metabolic state of RBCs in these samples by assigning to each sample a specific metabolic phase.
The first model (phase 1 vs phase 2) assigned all samples stored for 1 day (n = 7) to phase 1, whereas samples stored for 8 days (n = 7) were predicted in both phase 1 and phase 2 (supplemental Table 7). Samples stored for 15 days (n = 7) were classified as phase 2.
The second model (phase 1 vs phase 3) classified all samples stored for 1 day and 8 days (n = 14) as phase 1. All samples stored for 22, 29, 36, and 42 days (n = 28) were assigned to phase 3 (supplemental Table 7).
The third model (phase 2 vs phase 3) classified 6 of the 7 samples stored for 15 days as phase 2 with only 1 classified as phase 3. Six of the 7 samples stored for 22 days were predicted to be in phase 3 and only 1 was assigned to phase 2 (supplemental Table 7). All samples stored for 29, 36, and 42 days (n = 21) were predicted to be in phase 3 (supplemental Table 7).
Discussion
Metabolic profiling can provide information on the metabolic state of RBCs during storage, and define “old” and “fresh” blood based on their metabolic phenotype.10
In this study, we decided to investigate in detail the possibility of defining a set of biomarkers able to characterize the metabolic age of RBCs during storage.
Univariate ROC curve analysis performed on data set 1 showed that several metabolites were able to differentiate between the 3 metabolic phases. In particular, extracellular metabolites proved to be promising biomarkers (supplemental Table 1). Because RBCs are stored worldwide in different additive solutions,31,32 and it has been reported that RBCs stored in both SAGM and AS3 experience a similar 3-phase decay process, we decided to expand this study to another metabolomics data set to explore the possibility of defining a set of biomarkers in common with RBCs in other additive solutions.
Therefore, we performed a new experiment and generated a new metabolomics data set in AS3 with which to repeat the univariate ROC curve analysis.
Surprisingly, we were able to reveal in this way a small set of well-defined biomarkers capable of differentiating among the 3 metabolic phases (AUC >0.75) in both RBCs stored in SAGM and AS3 additive solution (Table 2). These 8 extracellular metabolites (lactic acid, nicotinamide, 5-oxoproline, xanthine, hypoxanthine, glucose, malic acid, and adenine) are key metabolites in the main metabolic pathways that characterize the metabolic phenotypes experienced by RBCs. The metabolic roles of these 8 metabolites are as follows:
D-glucose (HMDB00122) is present in all additive solutions because it is used by RBCs to sustain their metabolism. It is consumed by RBCs and oxidized to pyruvate during glycolysis and finally converted to lactate (HMDB00190), which is then secreted in the extracellular environment. The consumption of glucose and secretion of lactate is a very good indicator of the metabolic activity of RBCs during storage.
Adenine (HMDB00034) is also used to maintain RBC metabolism. RBCs consume almost all adenine available during phase 1 of the metabolic decay (day 1-10). We demonstrated previously that RBCs consume adenine only until the end of phase 2, and that adenine consumption is correlated with the time of storage and not with its concentration in the storage solution.33 Adenine is mostly consumed in phase 1. During phase 2, it is used to produce adenosine triphosphate through adenosine 5′-monophosphate metabolism because during this phase pentose sugars are rerouted from pentose phosphate pathway into the adenosine 5′-monophosphate metabolism through a nucleotide salvage pathway.10,13
During phase 3, all pentoses go through the non-oxidative branch of the pentose phosphate pathway and into glycolysis. The cessation of the use of the nucleotide salvage pathways in phase 3 results in an accumulation of purine degradation products, such as xanthine (HMDB00292) and hypoxanthine (HMDB00157), that are then secreted into the extracellular environment.10,13,34
Malic acid (HMDB00156) was found to be present in surprisingly high levels in RBCs.10 It is used as an alternative pathway to produce reduced nicotinamide adenine dinucleotide through the malate dehydrogenase to produce oxaloacetate that then makes its way into lower glycolysis via the conversion of oxaloacetate to pyruvate (A.D. and A.B., written communication, April 2016). RBCs start to release malic acid into the extracellular environment at the beginning of phase 2 together with nicotinamide (HMDB01406), which is a product of nicotinamide adenine dinucleotide degradation.
5-oxoproline (HMDB00157) is related to glutathione metabolism and it accumulates in stored RBCs as a metabolic dead-end in the γ-glutamyl cycle, owing to the absence of the enzyme oxoprolinase in mature erythrocytes.14 Glutathione synthesis is active only in phase 1, then starting from phase 2 there is an accumulation and secretion of 5-oxoproline.
A recent work showed a significant correlation between the levels of (oxidized) fatty acids (especially eicosanoids) and posttransfusion circulation of stored murine RBCs.35 The data sets used in this work were focused on polar metabolites and some of these metabolites, such as eicosanoids, were not detected. Only 5-oxoproline was identified as a marker associated with oxidative stress or glutathione homeostasis.
In order to validate these biomarkers, we used multivariate ROC curve analysis and generated 3 classification/regression models to perform a pairwise comparison of all 3 metabolic phases. The generated models showed strong predictive powers (Figure 4) and all of them had an AUC higher than 0.9. Among the 3 models generated, the one created to differentiate between phase 1 to phase 3 had the highest predictive power. This is reasonable considering that during the first 10 days of storage, RBCs have a completely different metabolism compared with those stored for more than 20 days.
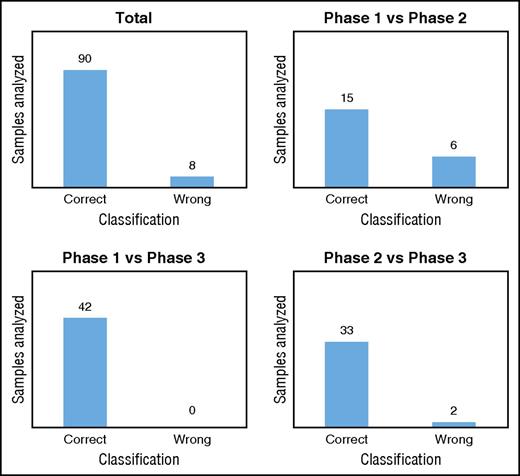
We validated our classification models by using a new data set generated with untargeted metabolomics on RBCs stored in SAGM for 42 days. We used the 8 metabolites selected previously to classify the new samples in each metabolic phase. As expected, the model comparing phase 1 vs phase 3 correctly classified all samples in the correct metabolic phases (Figure 5; supplemental Table 7). In total, 92% of the samples tested were classified in the correct metabolic phase by the 3 models (Figure 5; supplemental Table 7). The model misclassified RBC samples 8 times, including 6 samples stored for 8 days that were classified to phase 2 (supplemental Table 7). This result may not be surprising considering that after 8 days of storage, the metabolic transition from phase 1 to phase 2 is beginning and the level of the selected metabolites is in-between the 2 phases. Misclassified RBCs samples might also reflect donor variability.
Classification of the metabolic phases. Classification/regression models were used to predict the metabolic age of RBCs stored in SAGM (data set 3).
Classification of the metabolic phases. Classification/regression models were used to predict the metabolic age of RBCs stored in SAGM (data set 3).
A total of 308 samples from 24 different donors were used for the biomarker discovery analysis (Table 1). Then, we used 49 samples from 7 new donors to validate these biomarkers (Table 1). The overall results showed that the model was highly predictive of the metabolic phase in which a stored RBC currently resides. By monitoring only 8 extracellular metabolites, we were able to predict the metabolic age of RBCs with >90% accuracy.
However, several aspects not investigated in the present study might influence the RBC metabolism during storage. For instance, a recent study suggests that irradiation on RBCs exacerbates the metabolic storage lesion, resulting in a faster accumulation of some of the metabolic markers we report here as potential biomarkers.36
Interdonor variability, blood processing, as well as sex effects, might also affect the metabolic phases of RBC concentrates.37-39 In the present study, we did not find significant sex-related metabolic signatures. However, we are aware that sex effects might influence the quality of RBCs. In light of these results, further prospective validation in larger sample sets should include “bad” and “good” donors, as well as the analysis of samples representing improper storage. In this way, the biomarkers could be tested under critical conditions.
Even if the full clinical impact of the multiphase metabolic decay of RBCs under storage conditions remains to be elucidated, we believe that it is important to assign a metabolic age to the stored RBCs. Correlating these biomarkers with RBC quality would generate unified reference points, allowing assessment of RBC quality in clinical trials investigating transfusion prognosis.
What emerges from the present study is that, despite significant noise resulting from many relevant variables, a universal signature is detectable and can be used to identify metabolic phenotypes throughout storage duration in different additives, as validated in 2 independent laboratories. The translational implications of such an observation involve the definition of a baseline phenotype of the metabolic lesion, one that can be quantitatively exploited to speed up the design and testing of novel storage strategies/additives in the future.
This article contains a data supplement.
The publication costs of this article were defrayed in part by page charge payment. Therefore, and solely to indicate this fact, this article is hereby marked “advertisement” in accordance with 18 USC section 1734.
Acknowledgment
The authors thank Marc Abrams for fruitful discussions and helpful comments.
This work was supported by the European Research Council grant proposal no. 232816. A.D. is supported by scientific research funds from the National Blood Foundation and the Linda Crnic Institute.
Authorship
Contribution: G.P. designed the study, performed the experiment, analyzed the data, and wrote the manuscript; Ó.E.S., A.D., and T.N. performed experiments; Ó.R., S.G., S.P., Ó.E.S., A.D., B.O.P., A.B., and K.C.H. designed the study and contributed to the writing of the manuscript.
Conflict-of-interest disclosure: G.P., A.B., and S.P. have filled a provisional patent application on using metabolite concentration to assess RBC unit state. A.D., T.N., and K.C.H. are part of Endura LLC. A.D. is a consultant for New Health Sciences Inc. The remaining authors declare no competing financial interests.
Correspondence: Giuseppe Paglia, Center for Biomedicine, European Academy of Bozen/Bolzano, Via Galvani 31, 39100 Bolzano, Italy; e-mail: giuseppe.paglia@eurac.edu.

